Kiwi H1 | Potential bounce off an overlap supportThe Kiwi (NZD/USD) is falling towards an overlap support and could potentially bounce off this level to climb higher.
Buy entry is at 0.6051 which is an overlap support.
Stop loss is at 0.6025 which is a level that lies underneath a pullback support and the 61.8% Fibonacci retracement.
Take profit is at 0.6077 which is a swing-high resistance.
High Risk Investment Warning
Trading Forex/CFDs on margin carries a high level of risk and may not be suitable for all investors. Leverage can work against you.
Stratos Markets Limited (tradu.com ):
CFDs are complex instruments and come with a high risk of losing money rapidly due to leverage. 63% of retail investor accounts lose money when trading CFDs with this provider. You should consider whether you understand how CFDs work and whether you can afford to take the high risk of losing your money.
Stratos Europe Ltd (tradu.com ):
CFDs are complex instruments and come with a high risk of losing money rapidly due to leverage. 63% of retail investor accounts lose money when trading CFDs with this provider. You should consider whether you understand how CFDs work and whether you can afford to take the high risk of losing your money.
Stratos Global LLC (tradu.com ):
Losses can exceed deposits.
Please be advised that the information presented on TradingView is provided to Tradu (‘Company’, ‘we’) by a third-party provider (‘TFA Global Pte Ltd’). Please be reminded that you are solely responsible for the trading decisions on your account. There is a very high degree of risk involved in trading. Any information and/or content is intended entirely for research, educational and informational purposes only and does not constitute investment or consultation advice or investment strategy. The information is not tailored to the investment needs of any specific person and therefore does not involve a consideration of any of the investment objectives, financial situation or needs of any viewer that may receive it. Kindly also note that past performance is not a reliable indicator of future results. Actual results may differ materially from those anticipated in forward-looking or past performance statements. We assume no liability as to the accuracy or completeness of any of the information and/or content provided herein and the Company cannot be held responsible for any omission, mistake nor for any loss or damage including without limitation to any loss of profit which may arise from reliance on any information supplied by TFA Global Pte Ltd.
The speaker(s) is neither an employee, agent nor representative of Tradu and is therefore acting independently. The opinions given are their own, constitute general market commentary, and do not constitute the opinion or advice of Tradu or any form of personal or investment advice. Tradu neither endorses nor guarantees offerings of third-party speakers, nor is Tradu responsible for the content, veracity or opinions of third-party speakers, presenters or participants.
Harmonic Patterns


Gold is consolidating at structural support H4 Timeframe Analysis
Gold is currently holding the Proper rising wedge pattern on H4 and Range of 3380-3390.
Bullish scanario:
3380-3385 is the optimal structural support and potential buyying area still not a signal candle closes below 3380 also market covered the FVG and volume opening gap at 3382. I'm still on upside surprise towards 3405 then 3430.
However, if gold closes the H4 below the $3380 level, i will reassess my outlook towards 3355-3360.
#XAUUSD

Potential bearish drop?Dow Jones (US30) has rejected off the pivot, which acts as an overlap resistance and could drop to the pullback support.
Pivot: 42,584.80
1st Support: 41,458.80
1st Resistance: 43,086.08
Risk Warning:
Trading Forex and CFDs carries a high level of risk to your capital and you should only trade with money you can afford to lose. Trading Forex and CFDs may not be suitable for all investors, so please ensure that you fully understand the risks involved and seek independent advice if necessary.
Disclaimer:
The above opinions given constitute general market commentary, and do not constitute the opinion or advice of IC Markets or any form of personal or investment advice.
Any opinions, news, research, analyses, prices, other information, or links to third-party sites contained on this website are provided on an "as-is" basis, are intended only to be informative, is not an advice nor a recommendation, nor research, or a record of our trading prices, or an offer of, or solicitation for a transaction in any financial instrument and thus should not be treated as such. The information provided does not involve any specific investment objectives, financial situation and needs of any specific person who may receive it. Please be aware, that past performance is not a reliable indicator of future performance and/or results. Past Performance or Forward-looking scenarios based upon the reasonable beliefs of the third-party provider are not a guarantee of future performance. Actual results may differ materially from those anticipated in forward-looking or past performance statements. IC Markets makes no representation or warranty and assumes no liability as to the accuracy or completeness of the information provided, nor any loss arising from any investment based on a recommendation, forecast or any information supplied by any third-party.

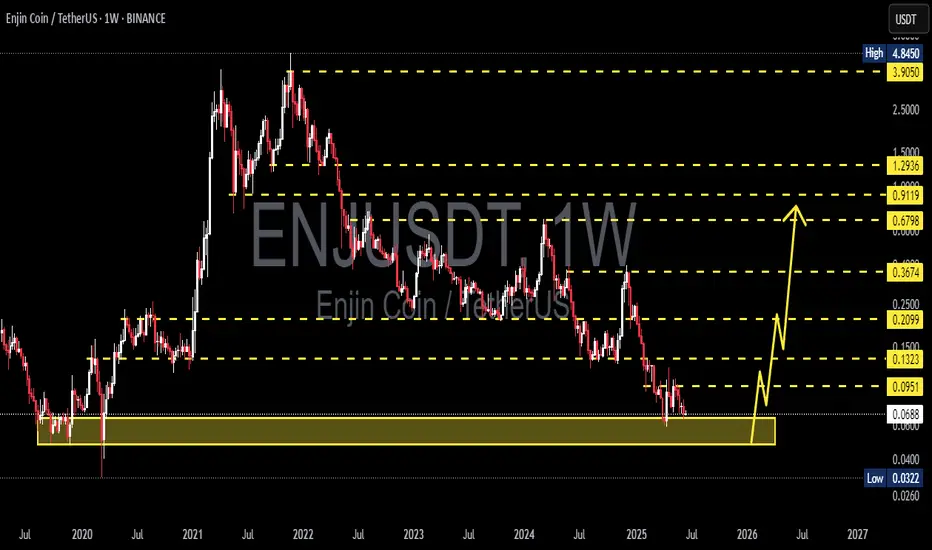
ENJUSDT 1W AnalysisENJ ~ 1W Analysis
#ENJ Buy back gradually from this support block with a short-term target of at least 20%++.
Bullish reversal off 50% Fibonacci support?The Gold (XAU?USD) has bounced off the pivot and could rise to the 1st resistance which acts as a pullback resistance.
Pivot: 3,374.04
1st Support: 3,348.45
1st Resistance: 3,444.62
Risk Warning:
Trading Forex and CFDs carries a high level of risk to your capital and you should only trade with money you can afford to lose. Trading Forex and CFDs may not be suitable for all investors, so please ensure that you fully understand the risks involved and seek independent advice if necessary.
Disclaimer:
The above opinions given constitute general market commentary, and do not constitute the opinion or advice of IC Markets or any form of personal or investment advice.
Any opinions, news, research, analyses, prices, other information, or links to third-party sites contained on this website are provided on an "as-is" basis, are intended only to be informative, is not an advice nor a recommendation, nor research, or a record of our trading prices, or an offer of, or solicitation for a transaction in any financial instrument and thus should not be treated as such. The information provided does not involve any specific investment objectives, financial situation and needs of any specific person who may receive it. Please be aware, that past performance is not a reliable indicator of future performance and/or results. Past Performance or Forward-looking scenarios based upon the reasonable beliefs of the third-party provider are not a guarantee of future performance. Actual results may differ materially from those anticipated in forward-looking or past performance statements. IC Markets makes no representation or warranty and assumes no liability as to the accuracy or completeness of the information provided, nor any loss arising from any investment based on a recommendation, forecast or any information supplied by any third-party.

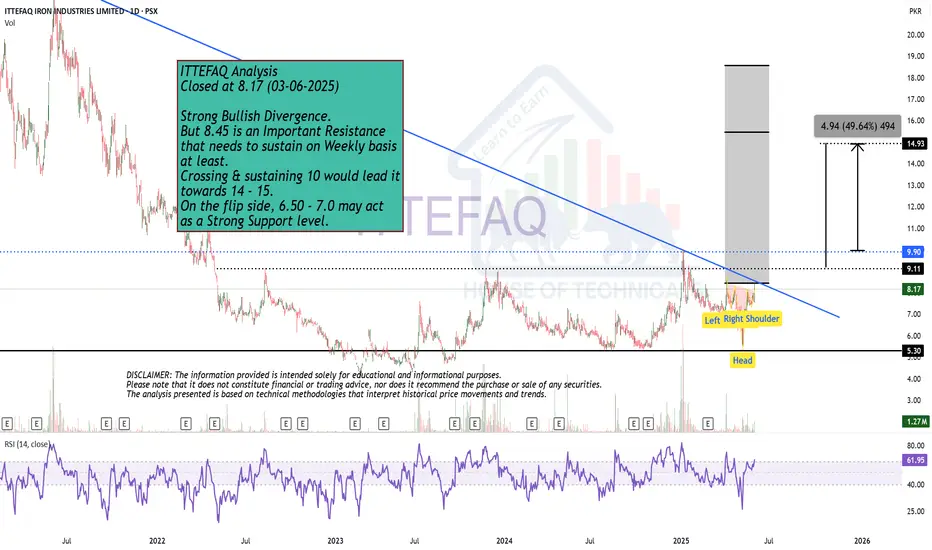
Strong Bullish Divergence. Closed at 8.17 (03-06-2025)
Strong Bullish Divergence.
But 8.45 is an Important Resistance
that needs to sustain on Weekly basis
at least.
Crossing & sustaining 10 would lead it
towards 14 - 15.
On the flip side, 6.50 - 7.0 may act
as a Strong Support level.
Bullish bounce?The Kiwi (NZD/USD) is falling towards the pivot and could bounce to the 127.2% Fibonacci resistance.
Pivot: 0.6036
1st Support: 0.6002
1st Resistance: 0.6093
Risk Warning:
Trading Forex and CFDs carries a high level of risk to your capital and you should only trade with money you can afford to lose. Trading Forex and CFDs may not be suitable for all investors, so please ensure that you fully understand the risks involved and seek independent advice if necessary.
Disclaimer:
The above opinions given constitute general market commentary, and do not constitute the opinion or advice of IC Markets or any form of personal or investment advice.
Any opinions, news, research, analyses, prices, other information, or links to third-party sites contained on this website are provided on an "as-is" basis, are intended only to be informative, is not an advice nor a recommendation, nor research, or a record of our trading prices, or an offer of, or solicitation for a transaction in any financial instrument and thus should not be treated as such. The information provided does not involve any specific investment objectives, financial situation and needs of any specific person who may receive it. Please be aware, that past performance is not a reliable indicator of future performance and/or results. Past Performance or Forward-looking scenarios based upon the reasonable beliefs of the third-party provider are not a guarantee of future performance. Actual results may differ materially from those anticipated in forward-looking or past performance statements. IC Markets makes no representation or warranty and assumes no liability as to the accuracy or completeness of the information provided, nor any loss arising from any investment based on a recommendation, forecast or any information supplied by any third-party.

Bearish continuation for the Swissie?The price is rising towards the pivot which has been identified as a pullback resistance that aligns with the 50% Fibonacci retracement and could drop to the 1st support.
Pivot: 0.8156
1st Support: 0.8055
1st Resistance: 0.8241
Risk Warning:
Trading Forex and CFDs carries a high level of risk to your capital and you should only trade with money you can afford to lose. Trading Forex and CFDs may not be suitable for all investors, so please ensure that you fully understand the risks involved and seek independent advice if necessary.
Disclaimer:
The above opinions given constitute general market commentary, and do not constitute the opinion or advice of IC Markets or any form of personal or investment advice.
Any opinions, news, research, analyses, prices, other information, or links to third-party sites contained on this website are provided on an "as-is" basis, are intended only to be informative, is not an advice nor a recommendation, nor research, or a record of our trading prices, or an offer of, or solicitation for a transaction in any financial instrument and thus should not be treated as such. The information provided does not involve any specific investment objectives, financial situation and needs of any specific person who may receive it. Please be aware, that past performance is not a reliable indicator of future performance and/or results. Past Performance or Forward-looking scenarios based upon the reasonable beliefs of the third-party provider are not a guarantee of future performance. Actual results may differ materially from those anticipated in forward-looking or past performance statements. IC Markets makes no representation or warranty and assumes no liability as to the accuracy or completeness of the information provided, nor any loss arising from any investment based on a recommendation, forecast or any information supplied by any third-party.

Strong Bullish Divergence on Bigger tf.FECTC Closed at 76.81 (16-06-2025)
Strong Bullish Divergence on Bigger tf.
Hidden Bullish Divergence also appearing.
Taken Support from 0.618 fib level.
Cup & Handle Formation on Bigger tf.
Upside Resistance is around 126 - 133
Crossing & Sustaining this level may lead it
towards 220 - 240.
However, it should not break 55 now.

Bearish breakout off major support?USD/JPY is reacting off the pivot which acts as an overlap support and a breakout of this level could lead the price to drop to the 1st support.
Pivot: 144.51
1st Support: 143.74
1st Resistance: 145.22
Risk Warning:
Trading Forex and CFDs carries a high level of risk to your capital and you should only trade with money you can afford to lose. Trading Forex and CFDs may not be suitable for all investors, so please ensure that you fully understand the risks involved and seek independent advice if necessary.
Disclaimer:
The above opinions given constitute general market commentary, and do not constitute the opinion or advice of IC Markets or any form of personal or investment advice.
Any opinions, news, research, analyses, prices, other information, or links to third-party sites contained on this website are provided on an "as-is" basis, are intended only to be informative, is not an advice nor a recommendation, nor research, or a record of our trading prices, or an offer of, or solicitation for a transaction in any financial instrument and thus should not be treated as such. The information provided does not involve any specific investment objectives, financial situation and needs of any specific person who may receive it. Please be aware, that past performance is not a reliable indicator of future performance and/or results. Past Performance or Forward-looking scenarios based upon the reasonable beliefs of the third-party provider are not a guarantee of future performance. Actual results may differ materially from those anticipated in forward-looking or past performance statements. IC Markets makes no representation or warranty and assumes no liability as to the accuracy or completeness of the information provided, nor any loss arising from any investment based on a recommendation, forecast or any information supplied by any third-party.

Bearish drop?The Cable (GBPUSD) is rising towards the pivot, which is a pullback resistance and could reverse to the 1st support.
Pivot: 1.3592
1st Support: 1.3536
1st Resistance: 1.3629
Risk Warning:
Trading Forex and CFDs carries a high level of risk to your capital and you should only trade with money you can afford to lose. Trading Forex and CFDs may not be suitable for all investors, so please ensure that you fully understand the risks involved and seek independent advice if necessary.
Disclaimer:
The above opinions given constitute general market commentary, and do not constitute the opinion or advice of IC Markets or any form of personal or investment advice.
Any opinions, news, research, analyses, prices, other information, or links to third-party sites contained on this website are provided on an "as-is" basis, are intended only to be informative, is not an advice nor a recommendation, nor research, or a record of our trading prices, or an offer of, or solicitation for a transaction in any financial instrument and thus should not be treated as such. The information provided does not involve any specific investment objectives, financial situation and needs of any specific person who may receive it. Please be aware, that past performance is not a reliable indicator of future performance and/or results. Past Performance or Forward-looking scenarios based upon the reasonable beliefs of the third-party provider are not a guarantee of future performance. Actual results may differ materially from those anticipated in forward-looking or past performance statements. IC Markets makes no representation or warranty and assumes no liability as to the accuracy or completeness of the information provided, nor any loss arising from any investment based on a recommendation, forecast or any information supplied by any third-party.

Top 5 Most Effective Forex Trading StrategiesTop 5 Most Effective Forex Trading Strategies Used by Professional Traders
Forex trading requires not just knowledge, but discipline and a clear strategy. So what are the most effective forex trading strategies that professional traders consistently use to achieve sustainable profits?
Let’s explore the 5 most trusted strategies that have stood the test of time – helping you level up your skills and reduce risk in this trillion-dollar market.
1. Breakout Strategy – Catching the Wave When the Market Explodes
A breakout occurs when price moves beyond a key support or resistance level after a period of consolidation. This usually signals the start of a new trend.
Best for: Traders who love strong momentum.
Pro tip: Confirm breakout with volume or candlestick patterns (e.g., engulfing).
Caution: Avoid entering right after the breakout – wait for a retest.
2. Trend Following Strategy – Trade with the Market, Not Against It
“Trend is your friend” – one of the most famous sayings in trading. This strategy helps traders ride the main trend, buying in uptrends and selling in downtrends.
Recommended tools: MA 20, MA 50, RSI, MACD.
Insider tip: Combine with pullback entries (enter when price retraces to dynamic support/resistance).
3. Price Action Strategy – Reading the Market Without Indicators
Price Action focuses on interpreting pure price behavior, without relying on indicators. Many pro traders prefer this approach to understand market psychology in real time.
Advantages: Clean, flexible, sharpens decision-making.
Popular candlestick patterns: Pin Bar, Inside Bar, Fakey, Engulfing.
4. News Trading Strategy – For Quick Thinkers and Fast Hands
When major news events like CPI, NFP, FOMC, or rate decisions hit the market, volatility surges. This creates both high-profit opportunities and high risks.
Common tactic: Straddle – place Buy Stop & Sell Stop before news release.
Risk warning: Watch out for slippage and widened spreads.
5. Fibonacci & Confluence Strategy – High-Probability Entries
This strategy combines tools like Fibonacci retracement, trendlines, support/resistance zones, and moving averages to find high-probability entry points.
Strength: Optimizes Risk: Reward ratio.
Tip: Focus on Fib levels 0.382 – 0.618 (commonly used retracement zones).
Conclusion: The Best Strategy is the One That Matches Your Style
There’s no perfect strategy – but understanding and applying the one that best fits your trading style will help you avoid emotional decisions and build long-term consistency.
Remember: Risk management – Emotional control – Systematic discipline = Long-term trading survival.

GRTUSDT 1W AnalysisGRT ~ 1W Analysis
#GRT Buy back gradually from here with a short term target of at least 20%+ from this support.

EURCAD: AN OPPORTUNITY TO GO LONG.PEPPERSTONE:EURCAD Going long at current market price, my target is 1.57893

QTUMUSDT 1W AnalysisQTUM ~ 1W Analysis
#QTUM Buy back gradually from here with a short term target of at least 20%+ from this support.

GOLD ASIAN report on retest to broken descending trendline at 3376-3374 private trade saw me 150pips instantly...
complete buy idea even on retest

GALAUSDT 1W AnalysisGALA ~ 1W Analysis
#GALA Buy at support block if you still have confidence in this coin with a short term target of at least 20%+ from here.

6.17 Gold Trend after the Big Drop6.17 Gold Trend after the Big Drop
Yesterday, gold continued to fall after rising, and the bulls lacked effective momentum to fight back. During the US trading session, the geopolitical risk aversion sentiment temporarily eased and accelerated the break, making it more difficult to rise in the short term.
In addition to the current decline in oil prices and gold prices, the conflict between Iran and Israel may end with one side kneeling down and surrendering. If this happens, the current gold price will continue to fall.
The current technical side shows that the hourly moving average tends to flatten, and yesterday's low of 3383 has become a key support level. The opening rebound touched the 3403 line and then fell under pressure again, proving that this area is a range of fluctuations between long and short watersheds.
If it cannot stand above 3400 before the opening of the US market, the bears will rely on the moving average to launch a new round of offensives, with the lower targets of 3375 and 3360.
If there is no good news at present, it is recommended to rebound high short strategy.
Thank you for your attention, I hope my analysis can help you.

CHRUSDT 1W AnalysisCHR ~ 1W Analysis
#CHR Buy back gradually from here if you still have confidence in this coin with a short term target of at least 20%+ from here.

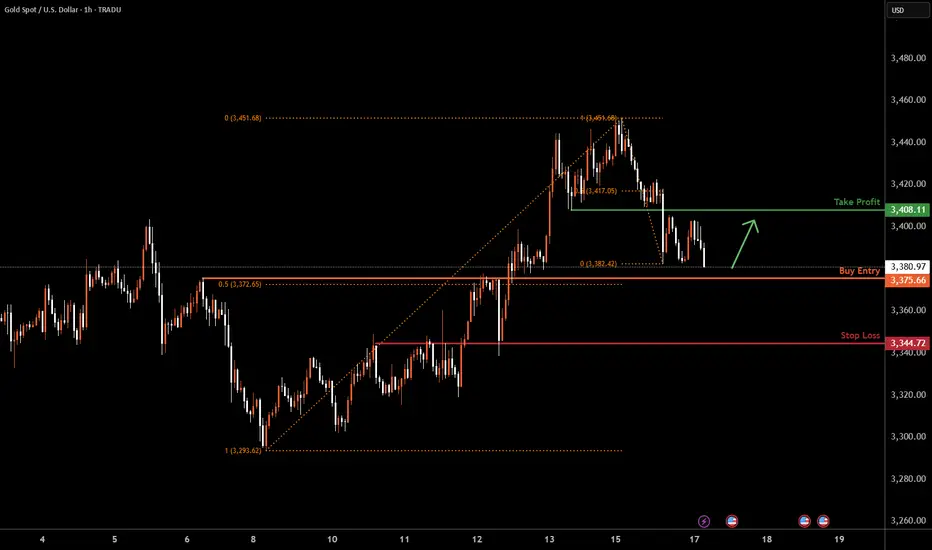
XAUUSD H1 I Bullish Bounce Off Based on the H1 chart analysis, we can see that the price is falling toward our buy entry at 3375.66, which is a pullback support that aligns with the 50% Fib retracement.
Our take profit will be at 3408.11, which is a pullback resistance level.
The stop loss will be placed at 3344.72, an overlap support.
High Risk Investment Warning
Trading Forex/CFDs on margin carries a high level of risk and may not be suitable for all investors. Leverage can work against you.
Stratos Markets Limited (tradu.com ):
CFDs are complex instruments and come with a high risk of losing money rapidly due to leverage. 63% of retail investor accounts lose money when trading CFDs with this provider. You should consider whether you understand how CFDs work and whether you can afford to take the high risk of losing your money.
Stratos Europe Ltd (tradu.com ):
CFDs are complex instruments and come with a high risk of losing money rapidly due to leverage. 63% of retail investor accounts lose money when trading CFDs with this provider. You should consider whether you understand how CFDs work and whether you can afford to take the high risk of losing your money.
Stratos Global LLC (tradu.com ):
Losses can exceed deposits.
Please be advised that the information presented on TradingView is provided to Tradu (‘Company’, ‘we’) by a third-party provider (‘TFA Global Pte Ltd’). Please be reminded that you are solely responsible for the trading decisions on your account. There is a very high degree of risk involved in trading. Any information and/or content is intended entirely for research, educational and informational purposes only and does not constitute investment or consultation advice or investment strategy. The information is not tailored to the investment needs of any specific person and therefore does not involve a consideration of any of the investment objectives, financial situation or needs of any viewer that may receive it. Kindly also note that past performance is not a reliable indicator of future results. Actual results may differ materially from those anticipated in forward-looking or past performance statements. We assume no liability as to the accuracy or completeness of any of the information and/or content provided herein and the Company cannot be held responsible for any omission, mistake nor for any loss or damage including without limitation to any loss of profit which may arise from reliance on any information supplied by TFA Global Pte Ltd.
The speaker(s) is neither an employee, agent nor representative of Tradu and is therefore acting independently. The opinions given are their own, constitute general market commentary, and do not constitute the opinion or advice of Tradu or any form of personal or investment advice. Tradu neither endorses nor guarantees offerings of third-party speakers, nor is Tradu responsible for the content, veracity or opinions of third-party speakers, presenters or participants.
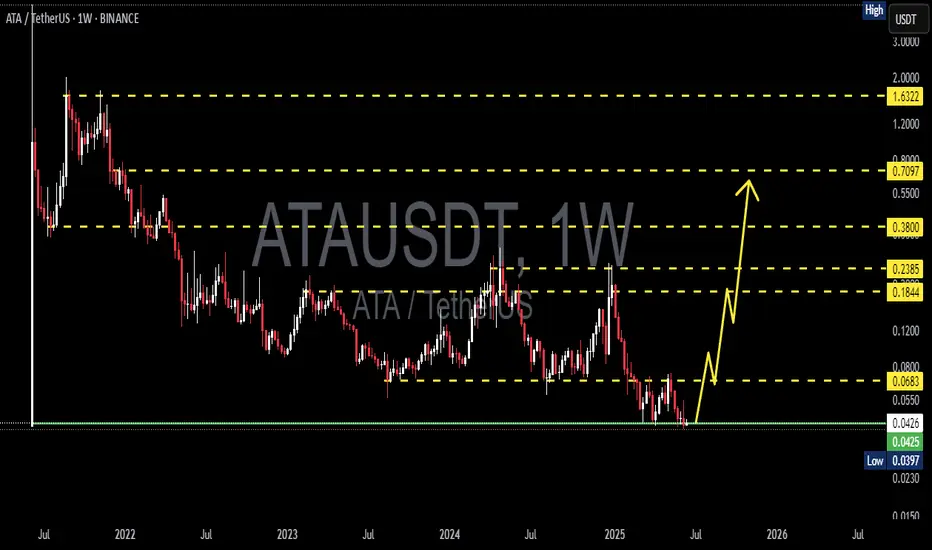
ATAUSDT 1W AnalysisATA ~ 1W Analysis
#ATA This is the lowest price at the launch of this coin. Buy if you are ready to take the risk in this trade. Short term target is at least 15%+.