GBPUSD H1 I Bearish Reversal Off the 61.8% FibBased on the H1 chart analysis, we can see that the price is rising toward our sell entry at 1.3594, which is a pullback resistance aligning with a 61.8% Fib retracement.
Our take profit will be at 1.3555, an overlap support level aligning with the 78.6% Fib retracement.
The stop loss will be placed at 1.3631, a swing high resistance.
High Risk Investment Warning
Trading Forex/CFDs on margin carries a high level of risk and may not be suitable for all investors. Leverage can work against you.
Stratos Markets Limited (tradu.com ):
CFDs are complex instruments and come with a high risk of losing money rapidly due to leverage. 63% of retail investor accounts lose money when trading CFDs with this provider. You should consider whether you understand how CFDs work and whether you can afford to take the high risk of losing your money.
Stratos Europe Ltd (tradu.com ):
CFDs are complex instruments and come with a high risk of losing money rapidly due to leverage. 63% of retail investor accounts lose money when trading CFDs with this provider. You should consider whether you understand how CFDs work and whether you can afford to take the high risk of losing your money.
Stratos Global LLC (tradu.com ):
Losses can exceed deposits.
Please be advised that the information presented on TradingView is provided to Tradu (‘Company’, ‘we’) by a third-party provider (‘TFA Global Pte Ltd’). Please be reminded that you are solely responsible for the trading decisions on your account. There is a very high degree of risk involved in trading. Any information and/or content is intended entirely for research, educational and informational purposes only and does not constitute investment or consultation advice or investment strategy. The information is not tailored to the investment needs of any specific person and therefore does not involve a consideration of any of the investment objectives, financial situation or needs of any viewer that may receive it. Kindly also note that past performance is not a reliable indicator of future results. Actual results may differ materially from those anticipated in forward-looking or past performance statements. We assume no liability as to the accuracy or completeness of any of the information and/or content provided herein and the Company cannot be held responsible for any omission, mistake nor for any loss or damage including without limitation to any loss of profit which may arise from reliance on any information supplied by TFA Global Pte Ltd.
The speaker(s) is neither an employee, agent nor representative of Tradu and is therefore acting independently. The opinions given are their own, constitute general market commentary, and do not constitute the opinion or advice of Tradu or any form of personal or investment advice. Tradu neither endorses nor guarantees offerings of third-party speakers, nor is Tradu responsible for the content, veracity or opinions of third-party speakers, presenters or participants.
Harmonic Patterns

STRKUSDT 1D AnalysisSTRK ~ 1D Analysis
#STRK This is the lowest support for now. Buy if you still have faith in this coin with a short term target of at least 15%+ from here.

EURUSD H1 I Bearish Reversal Based on the H1 chart analysis, we can see that the price is rising toward our sell entry at 1.1570, which is a pullback resistance aligning with a 38.2% Fib retracement.
Our take profit will be at 1.1528, an overlap support level.
The stop loss will be placed at 1.1609, a multi-swing high resistance.
High Risk Investment Warning
Trading Forex/CFDs on margin carries a high level of risk and may not be suitable for all investors. Leverage can work against you.
Stratos Markets Limited (tradu.com ):
CFDs are complex instruments and come with a high risk of losing money rapidly due to leverage. 63% of retail investor accounts lose money when trading CFDs with this provider. You should consider whether you understand how CFDs work and whether you can afford to take the high risk of losing your money.
Stratos Europe Ltd (tradu.com ):
CFDs are complex instruments and come with a high risk of losing money rapidly due to leverage. 63% of retail investor accounts lose money when trading CFDs with this provider. You should consider whether you understand how CFDs work and whether you can afford to take the high risk of losing your money.
Stratos Global LLC (tradu.com ):
Losses can exceed deposits.
Please be advised that the information presented on TradingView is provided to Tradu (‘Company’, ‘we’) by a third-party provider (‘TFA Global Pte Ltd’). Please be reminded that you are solely responsible for the trading decisions on your account. There is a very high degree of risk involved in trading. Any information and/or content is intended entirely for research, educational and informational purposes only and does not constitute investment or consultation advice or investment strategy. The information is not tailored to the investment needs of any specific person and therefore does not involve a consideration of any of the investment objectives, financial situation or needs of any viewer that may receive it. Kindly also note that past performance is not a reliable indicator of future results. Actual results may differ materially from those anticipated in forward-looking or past performance statements. We assume no liability as to the accuracy or completeness of any of the information and/or content provided herein and the Company cannot be held responsible for any omission, mistake nor for any loss or damage including without limitation to any loss of profit which may arise from reliance on any information supplied by TFA Global Pte Ltd.
The speaker(s) is neither an employee, agent nor representative of Tradu and is therefore acting independently. The opinions given are their own, constitute general market commentary, and do not constitute the opinion or advice of Tradu or any form of personal or investment advice. Tradu neither endorses nor guarantees offerings of third-party speakers, nor is Tradu responsible for the content, veracity or opinions of third-party speakers, presenters or participants.

XAUUSD GOLD ANNALSIS OUTLOOK BULLISH MOVES 17/6/2025Sell 3400 3405
take profit 3390
take profit 3380
take profit 3370
take profit 3360
stop los 3415

ZKUSDT 2D AnalysisZK ~ 2D Analysis
#ZK This trade is very risky, buy if you still have confidence in this coin with a short term target of at least 15%+ from here.

DOTUSDT 1W AnalysisDOT ~ 1W Analysis
#DOT Buy back gradually from this support block with a short term target of at least 20%+ from this support.

Geopolitics and Fed policies dominate the trend of gold prices
📌 Gold news
On Monday, boosted by the risk aversion of the Iran-Israel war, the gold price hit a high of 3452, but the continuity was not strong, and a series of other adjustments appeared; let's briefly sort it out:
1: Adjustment: Adjustment is normal. If the market rises, if the risk aversion does not continue to exert force, then the gold price can only return to technical adjustments. Therefore, Monday's adjustment trend and the decline trend are normal!
2: Risk aversion trend: The risk aversion trend will not be reversed for the time being! Once the war starts, it will not end easily; unless the interests of both sides are not damaged, the two sides agree to a ceasefire, but at present, the hope and probability are relatively small, so the risk aversion trend is the mainstream of the current global market;
3: The direction of the Iran-Israel war is nothing more than a few possibilities:
A: The war expands, the surrounding countries stand in line, and the US and Western imperialism join the battlefield; the war expands rapidly! At the same time, Iran is forced to block the Strait of Hormuz! This is a manifestation of escalating war;
B: Both sides, as well as the forces behind them, have calculated their interests, reached an agreement, and agreed to end the war conflict; this mainly depends on Iran's attitude; is it "powerful and unyielding", continuing to oppose the United States and imperialism; or is it pro-American, completely changing its identity, or changing its identity to submit to Israel and the United States;
To sum up: risk aversion eased slightly on Monday, but the overall global market is still risk-averse; technical adjustments are normal trends; but don't completely ignore the importance of risk aversion and risk aversion control because of technical adjustments; in addition, the subsequent results of the Middle East war are nothing more than the above two; what determines all this is the attitude of both sides;
📊Comment Analysis
Although the gold price fell below 3400 and the short-term trend changed, the general direction still remains bullish. In the future, it is still expected to hit the high point of 3500, but it is necessary to wait patiently for the bottom to stabilize before choosing the opportunity to buy the bottom. The current market is changing rapidly, and investors should adhere to the principle of following the trend and flexibly adjust their trading strategies.
💰Strategy Package
Short-term gold 3383-3393 long, stop loss 3372, target 3420-3440;
Short-term gold 3420-3430 short, stop loss 3435, target 3390-3370;
⭐️ Note: Labaron hopes that traders can properly manage their funds

S&P 500 H1 | Falling toward a swing-low supportThe S&P 500 (SPX500) is falling towards a swing-low support and could potentially bounce off this level to climb higher.
Buy entry is at 5,974.27 which is a swing-low support that aligns closely with the 78.6% Fibonacci retracement.
Stop loss is at 5,935.00 which is a level that lies underneath a swing-low support.
Take profit is at 6,056.80 which is a swing-high resistance.
High Risk Investment Warning
Trading Forex/CFDs on margin carries a high level of risk and may not be suitable for all investors. Leverage can work against you.
Stratos Markets Limited (tradu.com ):
CFDs are complex instruments and come with a high risk of losing money rapidly due to leverage. 63% of retail investor accounts lose money when trading CFDs with this provider. You should consider whether you understand how CFDs work and whether you can afford to take the high risk of losing your money.
Stratos Europe Ltd (tradu.com ):
CFDs are complex instruments and come with a high risk of losing money rapidly due to leverage. 63% of retail investor accounts lose money when trading CFDs with this provider. You should consider whether you understand how CFDs work and whether you can afford to take the high risk of losing your money.
Stratos Global LLC (tradu.com ):
Losses can exceed deposits.
Please be advised that the information presented on TradingView is provided to Tradu (‘Company’, ‘we’) by a third-party provider (‘TFA Global Pte Ltd’). Please be reminded that you are solely responsible for the trading decisions on your account. There is a very high degree of risk involved in trading. Any information and/or content is intended entirely for research, educational and informational purposes only and does not constitute investment or consultation advice or investment strategy. The information is not tailored to the investment needs of any specific person and therefore does not involve a consideration of any of the investment objectives, financial situation or needs of any viewer that may receive it. Kindly also note that past performance is not a reliable indicator of future results. Actual results may differ materially from those anticipated in forward-looking or past performance statements. We assume no liability as to the accuracy or completeness of any of the information and/or content provided herein and the Company cannot be held responsible for any omission, mistake nor for any loss or damage including without limitation to any loss of profit which may arise from reliance on any information supplied by TFA Global Pte Ltd.
The speaker(s) is neither an employee, agent nor representative of Tradu and is therefore acting independently. The opinions given are their own, constitute general market commentary, and do not constitute the opinion or advice of Tradu or any form of personal or investment advice. Tradu neither endorses nor guarantees offerings of third-party speakers, nor is Tradu responsible for the content, veracity or opinions of third-party speakers, presenters or participants.

BTC at Resistance — Breakdown or Breakout?Bitcoin is trading near $106,600 and still moving cleanly within a well-defined descending channel on the daily chart. Every time price touches the upper boundary, sellers step in aggressively — and this time looks no different. BTC is once again approaching that key resistance zone.
From where I stand, if we don’t see a breakout in the next few sessions, this could be a solid short setup. The structure is clear: fading strength at resistance, targeting the lower channel edge. In this environment, “short the structure — take profit at support” remains a tactical play.
What’s your move? Are you betting on rejection or ready for a breakout?

Silver H1 | Rising into a swing-high resistanceSilver (XAG/USD) is rising towards a swing-high resistance and could potentially reverse off this level to drop lower.
Sell entry is at 36.50 which is a swing-high resistance.
Stop loss is at 36.70 which is a level that sits above the 78.6% Fibonacci retracement and a swing-high resistance.
Take profit is at 36.06 which is a multi-swing-low support that aligns closely with the 50% Fibonacci retracement.
High Risk Investment Warning
Trading Forex/CFDs on margin carries a high level of risk and may not be suitable for all investors. Leverage can work against you.
Stratos Markets Limited (tradu.com ):
CFDs are complex instruments and come with a high risk of losing money rapidly due to leverage. 63% of retail investor accounts lose money when trading CFDs with this provider. You should consider whether you understand how CFDs work and whether you can afford to take the high risk of losing your money.
Stratos Europe Ltd (tradu.com ):
CFDs are complex instruments and come with a high risk of losing money rapidly due to leverage. 63% of retail investor accounts lose money when trading CFDs with this provider. You should consider whether you understand how CFDs work and whether you can afford to take the high risk of losing your money.
Stratos Global LLC (tradu.com ):
Losses can exceed deposits.
Please be advised that the information presented on TradingView is provided to Tradu (‘Company’, ‘we’) by a third-party provider (‘TFA Global Pte Ltd’). Please be reminded that you are solely responsible for the trading decisions on your account. There is a very high degree of risk involved in trading. Any information and/or content is intended entirely for research, educational and informational purposes only and does not constitute investment or consultation advice or investment strategy. The information is not tailored to the investment needs of any specific person and therefore does not involve a consideration of any of the investment objectives, financial situation or needs of any viewer that may receive it. Kindly also note that past performance is not a reliable indicator of future results. Actual results may differ materially from those anticipated in forward-looking or past performance statements. We assume no liability as to the accuracy or completeness of any of the information and/or content provided herein and the Company cannot be held responsible for any omission, mistake nor for any loss or damage including without limitation to any loss of profit which may arise from reliance on any information supplied by TFA Global Pte Ltd.
The speaker(s) is neither an employee, agent nor representative of Tradu and is therefore acting independently. The opinions given are their own, constitute general market commentary, and do not constitute the opinion or advice of Tradu or any form of personal or investment advice. Tradu neither endorses nor guarantees offerings of third-party speakers, nor is Tradu responsible for the content, veracity or opinions of third-party speakers, presenters or participants.

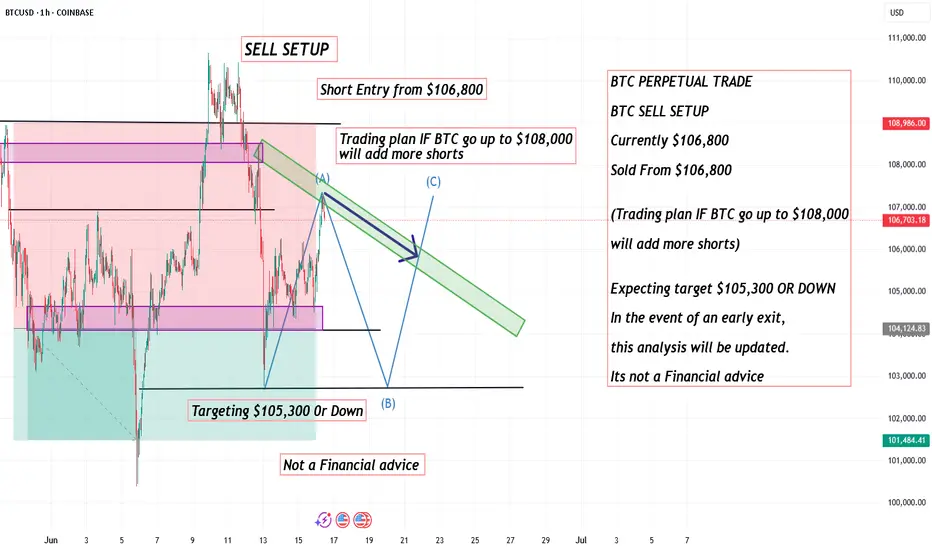
BTC PERPETUAL TRADE ,Sold From $106,800BTC PERPETUAL TRADE
BTC SELL SETUP
Currently $106,800
Sold From $106,800
(Trading plan IF BTC go up to $108,000
will add more shorts)
Expecting target $105,300 OR DOWN
In the event of an early exit,
this analysis will be updated.
Its not a Financial advice
$BTC Holding But Still Bearish Bias Due to War Risk
Bitcoin is trading around $106K, but fear from escalating US–Iran–Israel tensions is keeping the market cautious.
🔸 Key Support Zone: $99,763 – $103,112
As long as BTC stays above this area, it's safe. But if broken, expect a move toward $90,209.
🔸 Upside Target: $110K (Paused)
Breakout chances remain low unless global tensions ease.
🔸 Risk Level: $99K
A daily close below this flips the chart fully bearish.
🔸 Action Plan:
We're still in a short bias zone due to war fears. Hedge remains active. Stay light, stay alert — volatility can spike fast.

EURCAD bullish ideaWe are expecting a continuous bullish move on EURCAD after a clear breakout and Choch on the H4. We patiently wait for a bullish candle confirmation at the demand before continuation.

CLSK / 2hNASDAQ:CLSK has retraced up by 7.9% in total, which may be considered as a correction in wave b of (y). The following decline of 20% in the last subdivision of the entire correction in wave ii(circled) lies ahead soon.
The Retracement Targets >> 7.93 >> 7.84
#CryptoStocks #CLSK #BTCMining #Bitcoin #BTC

RIOT / 2hNASDAQ:RIOT has retraced up by 7.46% in total, which may be considered the 4th wave of wave A, in which five overlapping waves seem to be expanding down.
Wave Analysis >> The rising leading diagonal in wave (1) ended with a diagonal as its 5th wave inside at 10.86. Its correction in the same-degree wave (2) is underway toward the origin of the ending diagonal >> 7.93.
Trend Analysis >> The trend turned to correcting down. It might be a relatively deep retracement that will take a few weeks to develop.
The retracement targets >> 8.20 >> 7.93 >> 7.67
#CryptoStocks #RIOT #BTCMining #Bitcoin #BTC

AttijariWafa Bank (ATW) - Technical Analysis Casablanca St EXThe ATW stock is still following a strong upward trend, but key technical signals are emerging, especially with a RSI divergence. Here's what to watch for:
Trend & Key Zones
Bullish Channel: The stock is within a solid upward channel, indicating continuous growth.
Demand Zone: Around 612.5 MAD, the stock has found strong support in the past.
Consolidation Phase: The price is fluctuating between 663 MAD and 700 MAD, awaiting a breakout.
Major Resistance at 700 MAD
The stock is facing resistance near 700 MAD, a level it's yet to break consistently. A breakout above this could signal further gains, while failure to surpass it could lead to a pullback.
RSI Divergence: Loss of Momentum?
The RSI is showing divergence with price action. Although the price is reaching new highs, the RSI is weakening, indicating that bullish momentum may be losing steam. This could signal a potential reversal or correction in the near term.
What to Watch
If the price breaks above 700 MAD with increasing volume, the upward trend might resume. However, if the RSI divergence continues and the stock fails to break resistance, a pullback to the demand zone may present a buying opportunity.

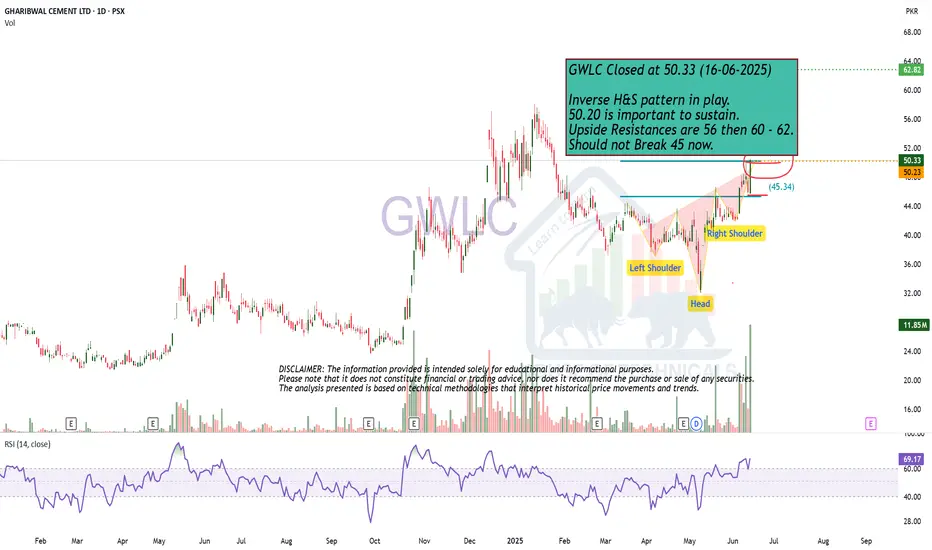
Inverse H&S pattern in play.GWLC Closed at 50.33 (16-06-2025)
Inverse H&S pattern in play.
50.20 is important to sustain.
Upside Resistances are 56 then 60 - 62.
Should not Break 45 now.
DASH - Invert to remove BIASDouble top (or bottom on inverse chart) is due, then off to zero
Not financial advice. Can be negated but just a potential path if this is the finalé

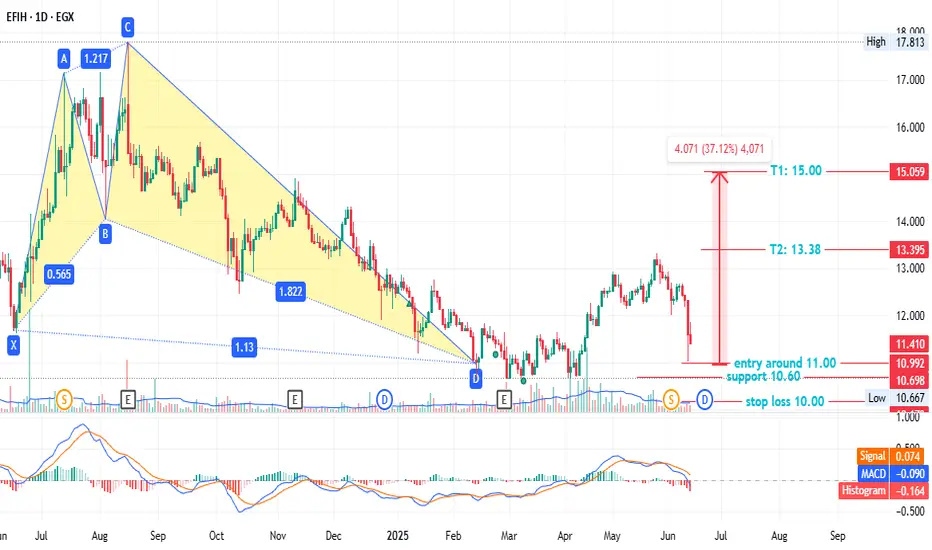
EFIH - anther chance - low risk EGX:EFIH - 1-Day Timeframe
A bullish pattern emerged on Feb 13, but prices adjusted after the 3/2 stock split on Jun 02. Key levels:
- Entry: ~11.00
- Stop loss: 10.00 (7.00% loss)
- Support: 10.60 (6-month low)
- Targets:
- T1: 13.38 (22.24% profit)
- T2: 15.00 (37.12% profit)
This is not investment advice—only my analysis based on chart data. Consult your account manager before investing. Good luck!
Eurcad LongTradeable idea, this pair broke through the trend line and it seems like it might touch it from above. Look carefully at happens here and look to go long where possible.

LUTS - out of box ( T1 10% VS SL 2% )EGX:LUTS timeframe 1 day
Created Bullish Gartley pattern, so we may see action price in this point.
Entry level around 0.573 ( prices now at 0.557 )
Stop loss 0.54 ( estimated loss 5.55% )
First target at 0.629 ( estimated profit 10.00% )
Second target 0.702 ( estimated profit 22.50% )
Third target 0.754 ( estimated profit 31.55% )
NOTE : this data according to timeframe 1 day.
Also MACD show positive diversion that may support our idea.
Its not an advice for investing only my vision according to the data on chart
Please consult your account manager before investing
Thanks and good luck

Wave 5 up in a Diagonal could be hours away The chart posted is the sp 500 futures back in april 10 th I labeled the low at 5102 as wave B or 2 both called for sharp rally to as high as 6147 in which wave 1 or a x 1.168 = 3 or c for a wave B top . since then I saw the high at 5968 as the end of wave 3 top and then looked for a drop back to 5669 we saw 5667 and so far all rallies have taken a 3 wave formation in which Most but Not all times this is occurring in an ending diagonal and in each wave we saw so far .887 the preceding wave . I have traded in and out and I am waiting for a final push up to 6083/6147 midpoint 6100 to take a short position . The alt is a small series of 4/5 4/5 4/5 if this were the count we would then break ABOVE 6147 and then reach 6330 . I am waiting to confirm .Best of trades WAVETIMER

Bearish drop?The Fiber (EUR/USD) has rejected off the pivot and could drop to the 1st support.
Pivot: 1.1611
1st Support: 1.1495
1st Resistance: 1.1649
Risk Warning:
Trading Forex and CFDs carries a high level of risk to your capital and you should only trade with money you can afford to lose. Trading Forex and CFDs may not be suitable for all investors, so please ensure that you fully understand the risks involved and seek independent advice if necessary.
Disclaimer:
The above opinions given constitute general market commentary, and do not constitute the opinion or advice of IC Markets or any form of personal or investment advice.
Any opinions, news, research, analyses, prices, other information, or links to third-party sites contained on this website are provided on an "as-is" basis, are intended only to be informative, is not an advice nor a recommendation, nor research, or a record of our trading prices, or an offer of, or solicitation for a transaction in any financial instrument and thus should not be treated as such. The information provided does not involve any specific investment objectives, financial situation and needs of any specific person who may receive it. Please be aware, that past performance is not a reliable indicator of future performance and/or results. Past Performance or Forward-looking scenarios based upon the reasonable beliefs of the third-party provider are not a guarantee of future performance. Actual results may differ materially from those anticipated in forward-looking or past performance statements. IC Markets makes no representation or warranty and assumes no liability as to the accuracy or completeness of the information provided, nor any loss arising from any investment based on a recommendation, forecast or any information supplied by any third-party.
