CHECKL BTCUSDT SIGNAL READ CAPTAINEntry: around(102893.55)102653.66 ✅
Take Profit 101732.58✅
Take Profit 2: 101231.00✅
Last Target:100412.00 ✅
Stop Loss: 103304.27❌
Harmonic Patterns

XAUUSD Trading Signals: Buy Dips at 3335-3345 Amid Bear Trap💡 Trading Framework In-Depth Analysis:
The Fed's policy statement failed to stir volatility (markets had fully priced in dovish expectations 💨);
Weekly market pattern: Asian sessions consistently saw rallies 📈, followed by profit-taking pullbacks in subsequent sessions 📉;
Tactical entry logic: Use intraday highs in Asian trading as resistance references for long positions 🎯.
📊 Technical Validation & Risk Anchors
⚠️ Key Warning: Geopolitical bullish signals ignored → classic "bear trap" characteristics (bear trap 🚫);
⏳ Timing Strategy: Asian session highs form ideal resistance levels—recommend entering on pullbacks to the 38.2% Fibonacci support level 🎯.
⚡️⚡️⚡️ XAUUSD Precision Trading Signals ⚡️⚡️⚡️
🚀 Long Entry Range: 3335-3345 (stop loss can be set below 3325)
🚀 Take-Profit Target Range: 3360-3370 (partial profit-taking at first target 3360 recommended)
📢 Service Value-Added Notes
✅ Core trading signals updated daily in the morning (validated across 4-hour/daily double-timeframes);
✅ Refer to signal logic at any time during trading for sudden situations 🧭 (with historical win-rate statistics attached);
🌟 Wishing you smooth trading Next week — seize pullback opportunities to position 👇
AUDCHF - Wait For it!Hello TradingView Family / Fellow Traders. This is Richard, also known as theSignalyst.
📈AUDCHF has been overall bearish trading within the flat falling broadening wedge pattern marked in red.
Moreover, the green zone is a supply.
🏹 Thus, the highlighted red circle is a strong area to look for sell setups as it is the intersection of the upper red trendline and supply.
📚 As per my trading style:
As #AUDCHF approaches the red circle zone, I will be looking for bearish reversal setups (like a double top pattern, trendline break , and so on...)
📚 Always follow your trading plan regarding entry, risk management, and trade management.
Good luck!
All Strategies Are Good; If Managed Properly!
~Rich
Disclosure: I am part of Trade Nation's Influencer program and receive a monthly fee for using their TradingView charts in my analysis.

BTC at 103K – Bounce or Breakdown?1. Overall Trend:
The chart is currently within a descending channel, indicated by two parallel downward-sloping trendlines. The price continues to fluctuate within the boundaries of this bearish channel.
2. Current Price Action:
BTC has just touched the lower green support zone (around 103,000 – 102,500 USDT) and is showing a slight rebound.
→ This suggests a potential recovery toward the nearest resistance zone.
3. Key Levels:
✅ Nearest Support Zone:
103,000 – 102,500 USDT → The price is currently bouncing from this area. If this zone holds, a short-term rebound toward resistance is likely.
🟥 Nearest Resistance Zone:
105,000 – 106,500 USDT → This zone has repeatedly rejected price advances in the past. Watch closely as price approaches this level.
🟪 Major Upper Resistance Zone:
Around 107,000 – 109,000 USDT → If price breaks above the red zone, this will be the next target.
4. Potential Scenarios:
🔹 Scenario 1 (Bullish):
If BTC holds the 103K support and breaks above the descending channel → price could aim for 105K – 106.5K. If that level is breached, the next target may be 107K – 109K.
🔸 Scenario 2 (Bearish):
If the 103K support breaks → price may fall deeper toward the lower green support zone (around 101,500 – 100,500 USDT).
🎯 Summary:
Short-term trend remains bearish.
Price is reacting at support → a rebound is possible.
Need confirmation from volume and candlesticks to determine if the current downtrend can be broken.
Don't forget to like – follow – and share if you find it useful!”😁😁😁

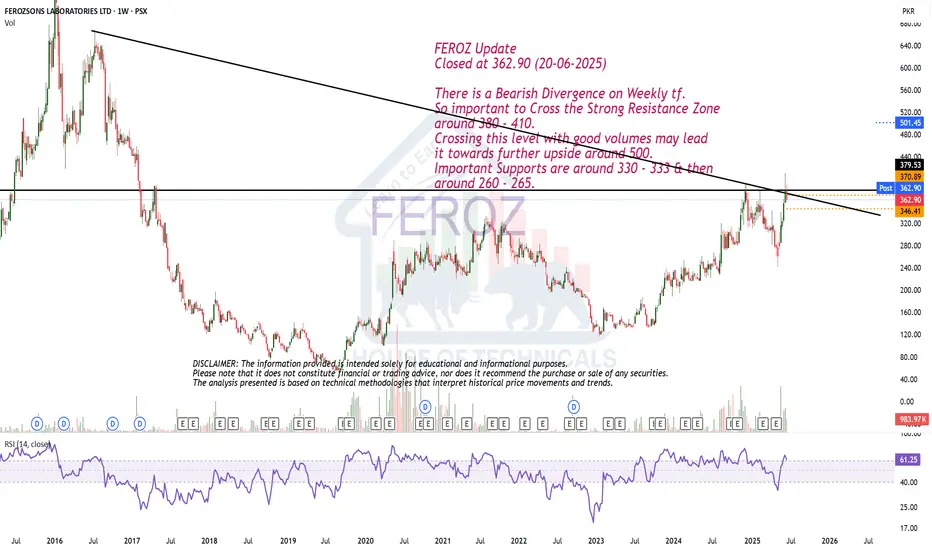
Bearish Divergence on Weekly tf.FEROZ Update
Closed at 362.90 (20-06-2025)
There is a Bearish Divergence on Weekly tf.
So important to Cross the Strong Resistance Zone
around 380 - 410.
Crossing this level with good volumes may lead
it towards further upside around 500.
Important Supports are around 330 - 333 & then
around 260 - 265.
LAYERUSDTBullish trend continuation expectation
either take entry on break of HH
or take entry on fib 0.382 and put SL 0.6013

BTC: A shakeout for more liquidityBTC: A shakeout for more liquidity
.
Wait for a drop and catch the dip, and continuously go up!
US STOCKS- WALL STREET DREAM- LET'S THE MARKET SPEAK!

Bitcoin Could Hit as High as $400KWhen comparing our macro cycle to the 2017 cycle, we see the potential for a very parabolic run on Bitcoin. I believe Bitcoin could hit as high as $400K by 2029. This is because Bitcoin tends to follow the stock market, and I anticipate a major blow-off top coming for the stock market. I expect one more big parabolic run on the Dow Jones leading up to 2029, which would fuel Bitcoin’s rise to $400K.
The lowest I see Bitcoin going during this parabolic run is $250K. On the higher end, I could see it hitting $400K or even more. Big things are coming.
As always, stay profitable.
— Dalin Anderson

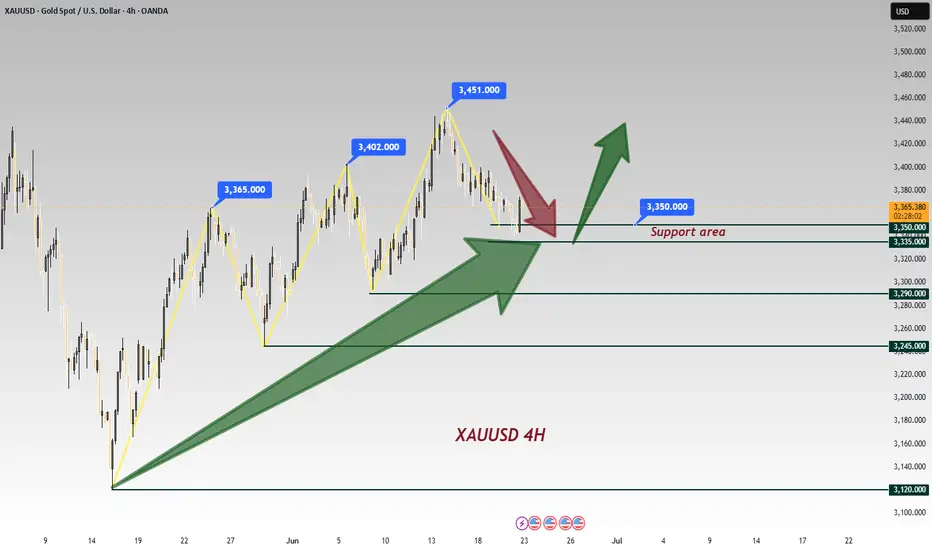
Analysis of gold trend next week, hope it helps you I. Next Week's Trend Analysis
Geopolitics: Middle East Tensions Like an Unattended Gas Stove
The ongoing conflict between Israel and Iran is akin to a gas stove left burning in a kitchen, poised to explode at any moment. Last week, Israel launched airstrikes on Tehran and reportedly killed an Iranian nuclear scientist, prompting Iran to retaliate against Beer Sheva, known as Israel's "cyber capital." More worryingly, Iraqi armed groups have threatened to block the Strait of Hormuz if the U.S. intervenes—a channel through which one-third of global seaborne crude oil passes, essentially gripping the world's energy tap. Russia has also warned of a "highly negative" response if Iran's supreme leader is harmed, further escalating tensions.
In this context, gold serves as a "safe haven" for risk aversion. However, the market remains torn: on one hand, fears of conflict escalation drive funds into gold; on the other, hopes that Iran-Europe talks will ease tensions may prompt some capital to withdraw for wait-and-see. This contradiction was evident last week when gold prices surged to $3,450 before dropping to $3,367. Next week, close attention should be paid to whether the U.S. takes military action against Iran within two weeks and whether actual blockades of the Strait of Hormuz occur—such news will trigger sharp fluctuations in gold prices.
Analysis of gold trend next week, hope it helps you
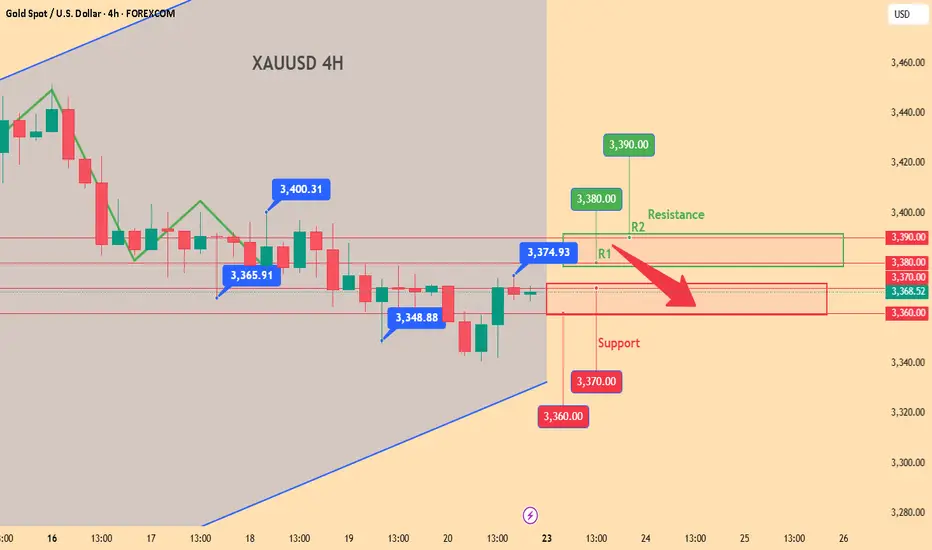
XAUUSD sell@3380~3390
SL:3410
TP:3370~3360

Entry Timing: Wait for Catalysts, Find Optimal PositionsEntry Timing: Wait for Catalysts, Find Optimal Positions
The Federal Reserve's latest report states that interest rates will remain on hold, but future rate cuts will proceed at a slower pace—originally projected to reduce rates by 50 basis points this year, but now possibly only 25 basis points annually, akin to pressing the brake pedal gently without fully stopping. Powell also noted that while inflation has shown signs of rebounding, the impact of geopolitical conflicts on prices may be temporary. This has left the market confused: on one hand, it suggests the U.S. economy may not be as weak as feared, reducing the urgency for rate cuts; on the other, concerns persist that high rates could suppress consumption and investment.
Next week, the U.S. will release GDP data. If the data comes in better than expected, indicating robust consumer spending, the Fed may be less inclined to cut rates promptly, strengthening the U.S. dollar and potentially exerting downward pressure on gold prices. Conversely, if the data disappoints, market expectations for earlier rate cuts could intensify, allowing gold to rebound. Currently, the market is waiting for clear signals from the Fed, and this hesitant sentiment will also keep gold prices volatile.
If there is positive news from Iran-Europe talks or the U.S. GDP data exceeds expectations, gold prices may decline. Consider initiating light short positions when prices fall near $3,350 or rebound to around $3,390.
Analysis of gold trend next week, hope it helps you
XAUUSD sell@3380~3390
SL:3410
TP:3370~3360
Trump:New update(don't miss it)hello friends👋
This time we came with the analysis of Trump's famous coin meme, which you requested a lot.
Well, as you can see, by making a double floor, the price has broken its downward channel and has grown well.
After the price growth, we saw the price suffering and then the price correction, which caused the formation of an upward pattern.
Now, according to the successful formation of this ascending pattern, it should be seen whether the buyers support the price in the specified support areas or not...
Pay attention that our trend is upward and the pattern made also shows an upward trend, that's why we have identified the support areas for you to enter the transaction step by step with risk and capital management.
🔥Follow us for more signals🔥
*Trade safely with us*

BTCUSD:Technical Analysis and OutlookIn the recent trading session, Bitcoin exhibited an upward trend; however, it subsequently experienced a significant decline from the established Mean Resistance level at 110300. On Friday, Bitcoin exhibited notable price action, characterized by a pump-and-dump scenario. At this juncture, Bitcoin is retracing downwards as it seeks to approach the Mean Support level at 101500 and the ultimate Inner Coin Dip at 96500. It is essential to acknowledge the potential for an upward rally from the Mean Support levels of $101500 and/or the Inner Coin Dip at $96500. Such a rally could culminate in a retest of the Mean Resistance level at $107000.

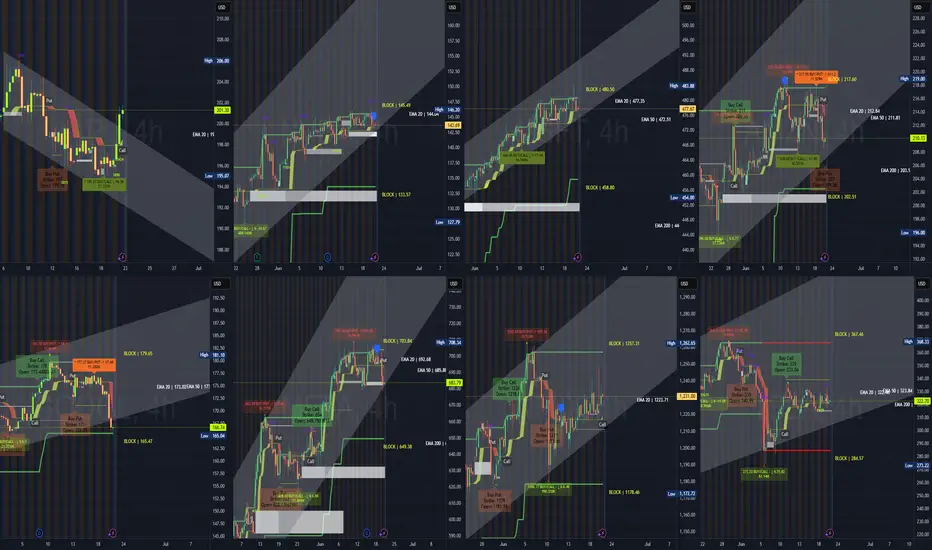
MAG7 - Jun 23, 2025 Institutional Swing Analysis – Jun 21, 2025
📈 AAPL
Trend: Reversal attempt in downtrend
Buy Zones (CALLs): 196 (accumulation)
Sell Zones (PUTs): 199 (distribution)
Support Block: —
Resistance: 201 → 204 → 206
Scenario: Above 200 = continuation to 204–206. Below 198 = back to 195–194.
📈 NVDA
Trend: Consolidating at resistance
Buy Zones: 142.5
Gap Support: 133.57 → 130.27
Support Block: 133.57
Resistance Block: 145.60
Scenario: Above 145.6 = breakout. Below 133.5 = gap fill toward 130.
📈 MSFT
Trend: Strong uptrend
Buy Zones: 466 (accumulation)
Gap Support: 458.8 → 450
Support Block: 458.80
Resistance Block: 480.50
Scenario: Holds 470 = test 485+. Below 458 = fill gap to 450.
📈 AMZN
Trend: Sideways in a wide range
Buy Zones: 212 (accumulation)
Sell Zones: 204, 200
Gap Support: 202.5 → 198
Support Block: 202.51
Resistance Block: 217.60
Scenario: Holding 210 = move to 217+. Below 202 = fill gap to 198–195.
📈 GOOGL
Trend: Bearish
Buy Zones: 175
Sell Zones: 172
Gap Support: 166.7 → 165.4
Support Block: 165.47
Resistance Block: 179.65
Scenario: Below 172 = gap test. Under 165 = risk to 160. Above 179.6 = reversal begins.
📈 META
Trend: Bullish but retracing
Buy Zones: 684
Sell Zones: 708
Gap Support: 683.8 → 649
Support Block: 649.38
Resistance Block: 703.84
Scenario: Holding 683 = move to 700+. Below 683 = gap fill to 649.
📈 NFLX
Trend: Sideways
Buy Zones: 1224
Sell Zones: 1178, 1200
Support Block: 1178.46
Resistance Block: 1257.31
Scenario: Over 1257 = breakout. Below 1220 = retest 1190.
📈 TSLA
Trend: Compressing sideways
Buy Zones: 313 (accumulation)
Sell Zones: 336, 319
Support Block: 284.57
Resistance Block: 367.46
Scenario: Above 336 = move to 355. Below 313 = test 300 → 284.
Live Trade hello friends✋️
Considering the price drop, you can now see that we are in important support and now we can take advantage of this situation and enter into a transaction with risk and capital management.
🔥Follow us for more signals🔥
*Trade safely with us*

NEXTNAV has broken out!NASDAQ:NN has broken out of it's blue arc and will gravitate to it's next one. This can take some months!

CHECK GBPJPY SIGNAL READ CAPTAINEntry: around 196.550) 196.450✅
Take Profit 196.150 ✅
Take Profit 2: 195.600✅
Last Target:195.100 ✅
Stop Loss: 197.000❌

Falling towards 50% Fibonacci support?The Loonie (USD/CAD) is falling towards the pivot which acts as an overlap support that lines up with the 50% Fibonacci retracement and could bounce to the pullback resistance.
Pivot: 1.3651
1st Support: 1.3581
1st Resistance: 1.3735
Risk Warning:
Trading Forex and CFDs carries a high level of risk to your capital and you should only trade with money you can afford to lose. Trading Forex and CFDs may not be suitable for all investors, so please ensure that you fully understand the risks involved and seek independent advice if necessary.
Disclaimer:
The above opinions given constitute general market commentary, and do not constitute the opinion or advice of IC Markets or any form of personal or investment advice.
Any opinions, news, research, analyses, prices, other information, or links to third-party sites contained on this website are provided on an "as-is" basis, are intended only to be informative, is not an advice nor a recommendation, nor research, or a record of our trading prices, or an offer of, or solicitation for a transaction in any financial instrument and thus should not be treated as such. The information provided does not involve any specific investment objectives, financial situation and needs of any specific person who may receive it. Please be aware, that past performance is not a reliable indicator of future performance and/or results. Past Performance or Forward-looking scenarios based upon the reasonable beliefs of the third-party provider are not a guarantee of future performance. Actual results may differ materially from those anticipated in forward-looking or past performance statements. IC Markets makes no representation or warranty and assumes no liability as to the accuracy or completeness of the information provided, nor any loss arising from any investment based on a recommendation, forecast or any information supplied by any third-party.

TSLA JUNE 20 2025 READ NOTESThis is momentum based price targeting & Tesla can easily do $390 but before that 342 is a solid resistance. From there we can get a dip and then price can continue the up move further
ANY NEWS IS TO BE AVOIDED
Now price action which is way superior is clearly suggesting the same up move.
I fact RSI is saying $400++ can come but it would be super dafe to exit around $390
If you nave any doubts then you can leave a comment.

GBPUSD hit its 1D MA50. Perfect buy signal.The GBPUSD pair has been trading within a Channel Up pattern since the January 13 2025 market bottom. Yesterday it hit its 1D MA50 (blue trend-line) for the first time since April 08.
This is the most efficient buy entry as the 1D MA50 has been supporting since the February 13 break-out. Even the 1D CCI turned oversold and rebounded, which is consistent with all bottom buys inside the Channel Up.
The Bullish Leg can extend to as high as +5.05% but due to the presence of the Inner Higher Highs trend-line, we first target 1.3850 (+3.43% rise).
-------------------------------------------------------------------------------
** Please LIKE 👍, FOLLOW ✅, SHARE 🙌 and COMMENT ✍ if you enjoy this idea! Also share your ideas and charts in the comments section below! This is best way to keep it relevant, support us, keep the content here free and allow the idea to reach as many people as possible. **
-------------------------------------------------------------------------------
💸💸💸💸💸💸
👇 👇 👇 👇 👇 👇

Monthly Closing is Important.PRL Closed at 32.21 (20-06-2025)
Monthly closing above 32 - 32.20 would
be a positive sign.
Upside immediate targets can be around 37 -38.
Breaking 31.50 may lead it towards 27 - 28

Play on levelsMonthly closing above 66 is actually
an important Support.
Retest of Trendline done.
Weekly Support is around 71 - 68.
Immediate Resistance is around 91 - 92.
If this level is sustained, we may witness 96 - 97

KDAUSDT 1W Analysis KDA ~ 1W Analysis
#KDA This is the lowest support for now. Buy if you still have confidence in this coin with a short term target of at least 15%+ from this support.
