Harmonic Patterns

Automated Trading with Pine ScriptIn the digital age, trading is gradually shifting from manual analysis to automated solutions. A key player in this process is Pine Script — a programming language developed for the TradingView platform, enabling users to create custom indicators, strategies, and automated signals. Its simplicity and powerful capabilities have made it especially popular among retail traders.
What is Pine Script?
Pine Script is a language developed by the TradingView team specifically for financial market analysis. Unlike general-purpose languages like Python or C++, Pine Script is designed for tasks related to technical analysis and trading automation.
It is used for:
Creating custom indicators;
Writing trading strategies;
Visualizing data on charts;
Setting up trading alerts (notifications).
Why Automate Trading?
Automated trading eliminates the human factor, which is crucial in volatile markets. Key advantages include:
Speed of reaction — the algorithm reacts instantly to signals.
Discipline — automated strategies do not succumb to emotions.
Scalability — one strategy can be applied to dozens of instruments.
Historical analysis — the ability to test ideas on past data (backtesting).
Structure of a Pine Script
Every script starts with a version declaration and the type of tool being created:
pinescript
Copy
Edit
//@version=5
indicator("Sample Indicator", overlay=true)
@version=5 — Pine Script version.
indicator(...) — indicates that the script is an indicator.
overlay=true — places graphics over the price chart.
For strategies, the strategy keyword is used:
pinescript
Copy
Edit
strategy("My Strategy", overlay=true)
Example of a Simple Automated Strategy
Let’s build a script that generates buy and sell signals based on the crossover of two moving averages:
pinescript
Copy
Edit
//@version=5
strategy("MA Strategy", overlay=true)
fastMA = ta.sma(close, 9)
slowMA = ta.sma(close, 21)
longCondition = ta.crossover(fastMA, slowMA)
shortCondition = ta.crossunder(fastMA, slowMA)
if longCondition
strategy.entry("Buy", strategy.long)
if shortCondition
strategy.entry("Sell", strategy.short)
plot(fastMA, color=color.green)
plot(slowMA, color=color.red)
This code:
Opens a long position when the fast MA crosses above the slow MA.
Opens a short position when the fast MA crosses below the slow MA.
Strategy Backtesting
TradingView automatically runs a backtest on historical data. In the Strategy Tester tab, users get:
total number of trades;
average profit;
win rate;
maximum drawdown;
risk/reward ratio.
This is a vital tool to evaluate the effectiveness of a strategy before deploying it in live trading.
Adding Stop Loss and Take Profit
To manage risk, strategies can include loss and profit limits:
pinescript
Copy
Edit
strategy.entry("Buy", strategy.long)
strategy.exit("Exit Buy", from_entry="Buy", stop=100, limit=200)
stop=100 — stop loss at 100 points.
limit=200 — take profit at 200 points.
This enhances both automation and risk control in the trading process.
Setting Up Alerts
While Pine Script cannot place real trades by itself, it can generate alert signals, which can be linked to external systems or brokers.
pinescript
Copy
Edit
alertcondition(longCondition, title="Buy Signal", message="Buy signal")
alertcondition(shortCondition, title="Sell Signal", message="Sell signal")
After adding these conditions to the chart, users can set up alerts that arrive via email, mobile notifications, or webhooks—useful for integration with bots or APIs.
Automated Trading via API
For full automation (from signal to trade execution), Pine Script is often used in conjunction with other technologies:
Webhook — TradingView sends an HTTP request when an alert triggers.
Server or bot — receives and processes the request, then sends an order to the broker.
Broker’s API — executes the order (open, close, modify positions).
Examples of brokers with API access: Binance, Bybit, Interactive Brokers, Alpaca, MetaTrader (via third-party bridges).
Tips for Writing Trading Strategies
Start simple. Use just 1–2 indicators.
Avoid overfitting. Don’t tailor your strategy too closely to past data.
Test on different timeframes. Ensure strategy stability.
Account for fees and slippage. Especially important on lower timeframes.
Add filters. For example, trend direction, volume, or volatility conditions.
Pine Script Limitations
While powerful and beginner-friendly, Pine Script has some limitations:
No tick-by-tick data access. Scripts execute on bar close.
Resource limits. Limits on script length and processing power.
No direct trade execution. Only possible via external integration or supported brokers.
Conclusion
Pine Script is an excellent tool for traders who want to automate their trading ideas. It allows you to create, test, and visualize strategies—even with minimal programming knowledge. While it’s not a full-fledged programming language, its capabilities are more than sufficient for most retail trading needs. With Pine Script, traders can improve efficiency, consistency, and reduce the emotional impact of trading decisions.

Bitcoin Market Analysis and Future Trend ForecastThe Bitcoin market has once again become the focus of investors. The price of Bitcoin has shown a significant upward trend, successfully breaking through the key resistance level of $106,000 per coin with an intraday increase of over 2%, demonstrating the strong vitality of the market. This price movement not only reflects the warming of positive sentiment in the cryptocurrency market but also indicates the gradual recovery of investor confidence, which has become the core driving force behind Bitcoin's current rally.
Currently, the Bitcoin price is at a critical juncture. From a daily chart perspective, after reaching an intraday high of $107,265, Bitcoin failed to effectively break through the key resistance level of $108,000 and has since retracted to fluctuate around $106,940. On the 4-hour timeframe, the MACD indicator shows that the histogram remains in positive territory, but the rate of increase has slowed, suggesting a short-term weakening of bullish momentum. Meanwhile, the RSI indicator stands at around 65, approaching the overbought zone, indicating that the market faces short-term correction pressure.
you are currently struggling with losses,or are unsure which of the numerous trading strategies to follow,You have the option to join our VIP program. I will assist you and provide you with accurate trading signals, enabling you to navigate the financial markets with greater confidence and potentially achieve optimal trading results.
Trading Strategy:
sell@107500-108000
TP:106000-106500

EURUSD Last push before correction.The EURUSD pair made a new High by breaking above the 1.15725 Resistance and is extending the rally since the January 13 2025 Low. That Low was the Higher Low of the multi-year Channel Up, so the current uptrend is technically its latest Bullish Leg.
The first Bullish Leg of that pattern peaked after a +15.75% rise. We expect a similar peak for the current rally, thus targeting 1.17750, before a new pull-back below the 1D MA50 (blue trend-line).
-------------------------------------------------------------------------------
** Please LIKE 👍, FOLLOW ✅, SHARE 🙌 and COMMENT ✍ if you enjoy this idea! Also share your ideas and charts in the comments section below! This is best way to keep it relevant, support us, keep the content here free and allow the idea to reach as many people as possible. **
-------------------------------------------------------------------------------
Disclosure: I am part of Trade Nation's Influencer program and receive a monthly fee for using their TradingView charts in my analysis.
💸💸💸💸💸💸
👇 👇 👇 👇 👇 👇

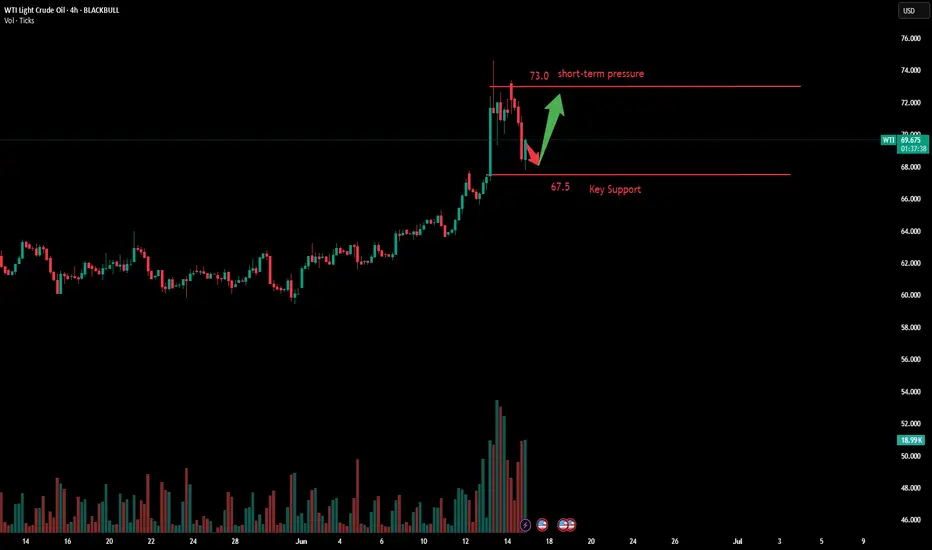
Crude oil continues to decline - latest market trend analysisThe international oil market is currently experiencing a classic upward cycle of "geopolitical risk premium". In the short term, oil prices will be highly sensitive to any news regarding the security of the Strait of Hormuz. Crude oil has continued its volatile upward trend in the short term, surging to test the price near $74. The moving average system is bullishly aligned with oil prices, and the objective short-term trend direction remains upward.
In early trading, oil prices hit a new high near $75.30, but then surged and fell, closing with a bearish real body K-line. The short-term momentum still favors the bulls, and it is expected that the intraday trend of crude oil will continue to maintain a high-level volatile upward rhythm.
you are currently struggling with losses,or are unsure which of the numerous trading strategies to follow,You have the option to join our VIP program. I will assist you and provide you with accurate trading signals, enabling you to navigate the financial markets with greater confidence and potentially achieve optimal trading results.
Trading Strategy:
buy@68.5.0-69.5
TP:73.0-74.0
The situation has eased, and gold has pulled back!
Although Iran has released a signal of easing, Israel's action plan remains unchanged and the situation remains tense. Just recently, Israeli missiles attacked Iran's national news TV station.
Gold has only fallen back, and it is definitely not turning around. Gold continues to be bullish, and there are still long positions near 3400. Overall, it continues to look above 3460.
With the situation easing, it began to pull back. The fermentation of this round of news has restrained the big funds and did not test the high point of 3500 upwards. Overall, the increase in gold prices is not large, and there is still a process of pulling. The fundamentals have not changed, and gold is still in a bull market.
Today's trend is obviously still mainly washing the market. The big negative line came down and then pulled up strongly.
The bottom line is 3380.
It is obviously the support of the market and the bottom signal. This 3380 is the previous high point and the future support. At present, it is to keep an eye on this position and continue to increase positions near 3400. It's that simple.

XAUUSD bullish move possible.This chart represents a technical analysis of Gold Spot (XAU/USD) on the 30-minute timeframe. Here's a concise breakdown of the key points:
🔹 Structure & Key Levels:
Liquidity Sweep: Price initially swept the liquidity above the recent highs, triggering stop-losses of early sellers or weak buyers.
Support Zone: Marked around the 3410–3415 range, where price has shown rejection and stability.
Prime Zone for Long Position: Below support, around 3400–3405, this area is marked as an ideal entry for long trades based on strong bullish reactions in the past.
🔸 Possible Scenarios:
Bullish Reaction from Support: Price may respect the current support zone and begin an upward move towards the resistance area around 3450.
Deeper Pullback into Prime Zone: If support breaks, price could dip into the prime long entry zone before reversing upwards.
✅ Conclusion:
The chart suggests a buy (long) setup is likely, especially from the support or prime zone, targeting the previous highs near 3450. Risk management would be important if the price breaks below 3390.96 (red zone), which could invalidate the long setup.

Gold has broken below the $3,400 level.The gold price continued its steady retracement during the European session, pulling back from a two-month high to around $3,400. The positive performance of equity markets is regarded as a key factor undermining the safe-haven demand for precious metals, as gold's three-day winning streak appears to have come to an end. However, analysts believe the downside remains limited, as traders may avoid aggressive positioning ahead of Wednesday's crucial Federal Open Market Committee (FOMC) policy decision.
Meanwhile, growing market expectations that the Federal Reserve will further cut interest rates in 2025 have kept the U.S. dollar under sustained pressure after it hit a three-year low last Friday. This scenario, in turn, provides some support for non-yielding gold. Additionally, persistent trade uncertainties and escalating geopolitical tensions in the Middle East may emerge as drivers for gold prices, keeping bearish traders cautious before any meaningful downward moves.
Although gold has broken below $3,400 and the short-term trend has shifted, the long-term direction remains unchanged with a bullish bias. There is still potential to target the $3,500 high in the future, but it is necessary to wait for the bottom to stabilize before accumulating long positions. In the current market, we can only follow the trend—adapting to market movements. Consider initiating short positions during the rebound in the coming two days.
you are currently struggling with losses,or are unsure which of the numerous trading strategies to follow,You have the option to join our VIP program. I will assist you and provide you with accurate trading signals, enabling you to navigate the financial markets with greater confidence and potentially achieve optimal trading results.
Trading Strategy:
sell@3420-3430
TP:3380-3390

USDJPY TRADE OPPORTUNITY.This chart represents a short (sell) trade setup for USD/JPY on the 15-minute timeframe.
Chart Breakdown:
Trendline: A clear descending trendline indicates a bearish market structure.
Entry Zone: The price is expected to enter the resistance area (marked as "Entry Zone") around 144.191.
Stop Loss (SL): Placed above the resistance zone at 144.529, in case the price breaks out upward.
Target 1: 143.744 – the first level of potential profit-taking.
Target 2: 143.379 – further continuation of the bearish move.
Final Target: 143.076 – the major target if bearish momentum continues.
Idea Summary:
This setup anticipates that the price will reject the trendline and entry zone and then drop to lower support levels. It’s a classic lower high formation with trendline confluence, aiming for multiple take-profits on the way down.

Gold: Key Levels Amidst Bull-Bear ClashDaily Technical Analysis
Daily Chart
Gold trended sideways-up last week, repeatedly testing upper resistance without a decisive breakout, though bullish momentum remains robust 🚀💪. The Bollinger Bands are expanding upward with price near the upper band, moving averages in bullish alignment, and MACD forming a golden cross above the zero axis with an expanding red histogram—signaling a dominant long-term uptrend 🔥📈!
4-Hour Chart
After reaching an intraday high of 3451, price corrected lower, forming small bearish candles that indicate short-term bearish momentum 📉🔻. However, moving averages still maintain a bullish order, with initial support at the psychological level of 3400. If price stabilizes here, further upside may resume 📈🚀. MACD has formed a bearish cross at high levels with a nascent green histogram, suggesting near-term correction is needed ⚠️🔄!
1-Hour Chart
Price is in a correction channel after retreating from highs, suppressed by short-term moving averages 📉🔽. Note that 3382 acts as a key prior support—if price pulls back to this zone, it may trigger bullish rebounds 💪🔥! RSI hovers around 50, indicating balanced long-short forces with an unclear near-term direction 🤷♂️🔀.
Gold Trading Strategies
sell@ 3430-3450
tp:3410-3400
buy@3400-3403
tp:3420-3430 (3450 if 3430 breaks)🚀
Professional trading strategies are pushed daily 📊
Lock in precise signals amid market fluctuations 🚀
Confused about market trends? Stuck in strategy bottlenecks?
Real-time strategies serve as your "trading compass" 🌐
From trend analysis to entry/exit points, dissect market logic comprehensively
Refer now 📲
Help you move steadily forward in investments ✨
👇👇👇

Is the breakout near?Today’s chart compares Total Crypto Market Cap 🆚 USDT Dominance - two metrics with a clear inverse correlation.🪞
🧠 Simple logic: when USDT.D drops, people are buying crypto and moving out of stablecoins. When it rises — capital seeks safety.
Since breaking its downtrend in early April, TOTAL shot up and is now consolidating in a bullish pennant — a classic continuation pattern. 📈
Meanwhile, USDT.D is forming a bearish pennant, signaling potential further downside. 📉
Most are still not ready for what’s coming... 🚀

EURUSD at Key Resistance – Bull Trap or Breakout Incoming?The Euro has rallied into a major supply zone at 1.15800+, a level that hasn’t been broken since mid-2023. As price trades within this supply range, traders are eyeing either a strong breakout or a potential rejection back toward demand.
🟦 Key Supply Zone: 1.14994 – 1.16100
🟧 Major Demand Zones:
• 1.09023 (mid-range)
• 1.02903 (long-term support & prior consolidation base)
⚖️ Current Outlook:
• EURUSD is showing strength, but bullish momentum is slowing at resistance.
• A rejection candle from here could signal downside toward 1.0900 and even 1.0290.
• Break and close above 1.16100 on the daily would confirm bullish continuation toward untested zones.
🗓️ Marked Date: January 29, 2025 – Previous structure shift & start of bullish wave
💡 Watch Closely:
Price behavior around the current supply zone will determine direction for weeks ahead. Risk/reward now favors patient traders — wait for confirmation!
🧠 Chart Tools:
LuxAlgo Supply & Demand Visible Range
Timeframe: Daily (1D)
🚨 Potential Scenarios:
🔺 Breakout = Target 1.1800+
🔻 Rejection = Drop toward 1.0900 – 1.0300
👇 What’s your bias here? Are the bulls done or just getting started?
#EURUSD #ForexSignals #LuxAlgo #SupplyAndDemand #PriceAction #ForexStrategy #BreakoutOrRejection #FrankFx #TradingViewAnalysis #SmartMoneyTraders

USDJPY Ready to Lift Off from Demand Zone – Breakout Brewing?The Dollar-Yen pair is trading at 144.05, showing signs of strength after bouncing off a strong daily demand zone around 140.55. Price has respected this zone several times since May, suggesting a solid base for a bullish move.
🟠 Key Demand Zone (Support): 140.55 – 141.00
🔵 Major Resistance Ahead:
• 150.63 (mid-range key level)
• 155.70 – 157.00 (supply zone & previous highs)
📈 Bullish Outlook:
If price holds above 140.55, we could see a breakout of the minor range consolidation heading into July. First target sits at 150.63, and further upside could see a retest of the supply zone around 156.
📉 Bearish Risk:
Failure to hold above 140.55 opens up room for a deeper correction — but strong demand and historical bullish reactions favor the bulls for now.
🔍 Why This Matters:
• Clean demand zone reaction
• Low volatility = possible expansion phase ahead
• JPY fundamentals remain weak, giving USD strength tailwind
💡 Watch for a breakout candle above recent consolidation highs to confirm the next leg upward.
📅 Timeframe: Daily (1D)
🧠 Tools: LuxAlgo Supply & Demand Visible Range
🚀 Will USDJPY rally toward 150+ or stall at mid-resistance? Let’s talk setups👇
#USDJPY #ForexSetup #SmartMoney #DailyChart #SupplyDemand #PriceAction #BreakoutTrade #TradingView #FrankFx #YenWatch #LuxAlgo

XAUUSD – Can the bulls drive it up to $3,485?XAUUSD is a typical case of a market trading within an ascending channel, with price action consistently respecting both its upper and lower boundaries.
As you can see in my analysis, the price has recently broken through an important resistance zone and may return to retest it. If this level holds as support, it will indeed confirm the bullish trend and make the move towards my projected target of 3,485 highly likely, aiming for the next resistance zone at 3,485 and 3,500.
If the price remains above this support zone, my bullish outlook remains intact. However, if the price fails to hold above this level, the short-term bullish outlook will therefore be disrupted and may be followed by the next downward retracement.

Opportunity for selling EURUSDI see that EURUSD has confirmed strong resistance, so I took a sell trade with it.

GBPUSD Approaching Key Supply Zone – Watch This Breakout The British Pound is currently trading around 1.3591, showing bullish momentum — but it's now pressing against a major daily supply zone near 1.3620 - 1.3577. This area has historically rejected price action, making it a critical point of interest.
🔵 Key Resistance Zone (Supply): 1.3577 - 1.3620
🔵 Next Support Levels to Watch If Rejected:
• 1.2967 (Mid-level structure & former resistance)
• 1.2744 (Weekly support)
• 1.2273 (High-demand zone + March accumulation zone)
🔻 Bearish Outlook (if rejection occurs):
Expect sellers to step in strongly around this supply zone. A confirmed rejection here could trigger a multi-leg bearish correction toward the 1.2967 level, and possibly even the 1.2470 or 1.2270 demand zones below.
📌 Bullish Case:
A breakout above 1.3620 with strong volume could signal a continuation of the bullish trend, targeting new highs into Q3.
🧠 Strategy Tips:
• Look for bearish candlestick confirmation on the daily around 1.3577 - 1.3620
• Monitor fundamentals — especially upcoming UK & US economic data
• Use a tight SL above the zone if shorting, or wait for a confirmed retest breakout to go long
📅 Timeframe: Daily (1D)
🔍 Indicator: Supply & Demand Visible Range (LuxAlgo)
📊 What are your thoughts — rejection or breakout? Let’s discuss in the comments!👇
#GBPUSD #ForexAnalysis #PriceAction #SupplyAndDemand #SmartMoney #DailyChart #ForexSetup #BreakoutOrBounce #FXCM #LuxAlgo #TradingView #FrankFx

CHECK BTCUSD SIGNAL READ CAPTAINbtcusd sell now ✅
entry point (107.650) (107.450)
TAKE PROFIT 1: (106.800)
TAKE PROFIT 2: (105.800)
LAST TARGET (105.000)
STOP LOSS (108.400)

GOLD GOLD CAME right inside my demand floor sweeping all intraday support into 3393-3400 and extended to 3384.
the buy zone triggered and is going up.

What I expect on EURUSDI expect a bounce around this level then back down to this support line at the minimum

GOLD (XAUUSD) SELL SETUP – Triple Top Rejection Confirmed? Gold is currently testing a strong supply zone near the $3,450 resistance area for the third time. Each test has been followed by sharp rejections, forming a potential triple top pattern, which is a classic bearish reversal signal.
🔵 Key Levels to Watch:
Resistance: $3,450 – Strong supply zone (highlighted blue zone)
Mid Support: $3,032 – Previous structure support & demand
Major Demand: $2,647 – Long-term demand zone (orange)
🔻 Bearish Signals:
Price failed to break above the $3,450 supply zone
Strong bearish wick and rejection candle
Lower highs on RSI/MACD (not shown but worth noting)
📌 Potential Trade Idea:
Entry: Near $3,400–$3,450 zone
Target 1: $3,032 (mid-term support)
Target 2: $2,647 (long-term demand)
SL: Above $3,470 (clear invalidation)
🗓️ As we move toward July, a break below $3,300 could trigger momentum selling down to $3,000 and even $2,647.
💬 What’s your bias on gold this week? Are we heading for a major correction or another bounce?
#Gold #XAUUSD #Forex #TechnicalAnalysis #TripleTop #BearishSetup #SmartMoney #PriceAction #TradingView #LuxAlgo #SwingTrade #Commodities

CHECK XAUUSD SIGNAL READ CAPTAN xauusd buy now ✅
entry point (3403) (3401)
TAKE PROFIT 1: (3408)
TAKE PROFIT 2: (3418)
LAST TARGET (3426)
STOP LOSS (3393)

My analysis New buy setup for XAUUSD (Gold):
- Entry: 3410
- Targets:
1. 3403 (wait, isn't this lower than entry?)
2. 3406 (still lower than entry)
3. 3410 (same as entry)
4. Open target
- Stop Loss (SL): 3402
Your targets seem a bit unusual – typically, targets are set above the entry price for buy trades. Are you expecting a bounce or reversal?

CHECK GBPJPY SIGNAL READ CAPTAINgbpjpy sell now ✅
entry point (195.850) (195.750)
TAKE PROFIT 1: (195.500)
TAKE PROFIT 2: (195.150)
LAST TARGET (194.800)
STOP LOSS (1996.200)
