PENGUUSDT Forming Falling WedgePENGUUSDT is currently showing a textbook falling wedge pattern on the daily chart, which is a bullish technical setup often signaling a trend reversal. The price has been compressing within downward-sloping resistance and support lines, and with the wedge tightening, a breakout is becoming more likely. This setup is particularly appealing when paired with the recent increase in trading volume, suggesting accumulation and growing market interest. If a breakout confirms, the projected upside could be in the range of 90% to 100%+ based on historical wedge breakouts and current technical targets.
From a volume and sentiment perspective, the coin has seen consistent liquidity, and investor chatter is increasing across forums and social platforms. The consolidation after a previous strong uptrend adds further strength to the setup — a classic "bullish continuation" after a healthy correction phase. Traders often look for such patterns to catch early momentum before a full-scale rally unfolds. In the case of PENGUUSDT, once resistance breaks convincingly, a strong wave upward could follow swiftly.
The breakout zone to watch sits slightly above the upper descending trendline, and with price already nudging against it, traders should keep an eye on confirmation candles with strong volume. Given the relatively clean overhead structure, any successful breakout could lead to a quick retest of previous highs, providing significant upside. The 100% profit projection marked on the chart highlights the measured move target, aligning with prior resistance zones.
Technically sound and backed by rising interest, PENGUUSDT presents a high-potential opportunity for short-term and swing traders. If momentum continues, this could become one of the top-performing micro-cap plays in the coming weeks.
✅ Show your support by hitting the like button and
✅ Leaving a comment below! (What is You opinion about this Coin)
Your feedback and engagement keep me inspired to share more insightful market analysis with you!
Harmonic Patterns

PNUTUSDT Forming Falling WedgePNUTUSDT is presenting a compelling falling wedge pattern, signaling a high-probability bullish reversal. This technical formation typically occurs after a sustained downtrend and is characterized by converging trendlines sloping downward. In the case of PNUTUSDT, the wedge is nearing its apex, indicating that a breakout is likely imminent. The setup is further supported by healthy volume levels, adding credibility to the expected move. Historically, falling wedges often lead to explosive upside moves, and this pair is currently projecting a potential gain of 90% to 100%+ if the breakout confirms.
Market interest in PNUTUSDT is steadily growing, as indicated by rising trading activity and increased visibility across community forums and social platforms. This surge in attention aligns with the volume spike seen during recent trading sessions — a classic precursor to bullish breakouts. As more investors start to take positions in anticipation of a breakout, price momentum can accelerate rapidly, creating ideal conditions for short- to mid-term gains.
From a technical standpoint, a confirmed breakout above the wedge’s upper resistance line could open the door to rapid price expansion, especially with limited overhead resistance. Traders should watch for confirmation signals such as strong bullish candlesticks, increasing volume, or a retest of the breakout level. PNUTUSDT is shaping up as an exciting opportunity for swing traders looking to capitalize on pattern-based moves in the altcoin space.
With bullish sentiment, clear technical structure, and improving market participation, PNUTUSDT could be on the verge of a significant breakout. It’s a setup that combines strong technicals with growing investor interest — a powerful combination in crypto trading.
✅ Show your support by hitting the like button and
✅ Leaving a comment below! (What is You opinion about this Coin)
Your feedback and engagement keep me inspired to share more insightful market analysis with you!

MUBARAKUSDT Forming Falling Wedge PatternMUBARAKUSDT is currently showcasing a classic falling wedge pattern, a widely recognized bullish reversal setup in technical analysis. After a period of steady decline within converging trendlines, the price appears to be approaching a breakout point. This pattern often signals a shift in market momentum, especially when supported by increasing volume — which is the case here. The current formation suggests a potential surge of 90% to 100%, offering a high-upside opportunity for early-positioned traders.
The volume profile remains favorable, indicating strong underlying investor interest. A falling wedge coupled with good volume often precedes powerful rallies as it demonstrates that sellers are losing steam while buyers are preparing to step in. MUBARAKUSDT is also gaining traction in online discussions and social sentiment, signaling that the broader market is beginning to pay attention to this emerging asset. This growing interest can serve as a catalyst for price acceleration once the breakout is confirmed.
Technically, a break above the upper resistance line of the wedge will be a key signal for bullish continuation. Traders should closely monitor breakout levels along with short-term resistance zones to manage entries. With proper confirmation, this trade setup has the potential to deliver one of the stronger moves among small-cap altcoins currently in consolidation phases.
Given the combination of chart structure, volume dynamics, and growing interest from crypto communities, MUBARAKUSDT is shaping up to be a coin to watch in the coming sessions. This setup is ideal for those seeking high-reward breakout trades based on technical strength.
✅ Show your support by hitting the like button and
✅ Leaving a comment below! (What is You opinion about this Coin)
Your feedback and engagement keep me inspired to share more insightful market analysis with you!

KERNELUSDT Poised for Breakout: Double Bottom Signals ReversalDouble bottom pattern forming on BINANCE:KERNELUSDT on daily with bullish follow-through.
Price approaching downtrend resistance — a breakout could trigger a strong upside move.
Targets on breakout:
🟡 Target 1: 0.2066
🟡 Target 2: 0.2384
🟡 Target 3: 0.2734 (+54%)
Watching for daily close above trendline for confirmation.
#KERNELUSDT #CryptoBreakout #ChartPattern #DoubleBottom #AltcoinAnalysis

EURAUD - BearishEURAUD has formed head and shoulders pattern on 1H and currently trading near its neckline. Place sell stop on break of neckline with SL above right shoulder.

DOLLAR INDEXThe DXY (U.S. Dollar Index) is a measure of the U.S. dollar’s value relative to a basket of six major foreign currencies: the euro (57.6%), Japanese yen (13.6%), British pound (11.9%), Canadian dollar (9.1%), Swedish krona (4.2%), and Swiss franc (3.6%). It serves as a benchmark for the dollar’s global strength and is influenced by macroeconomic factors like interest rates, trade flows, and inflation expectations.
10 years bond yield Correlations with DXY
1. 10-Year Bond Yield
Positive Correlation: The DXY and U.S. 10-year Treasury yields generally move in the same direction. Higher yields attract foreign capital into U.S. bonds, increasing demand for dollars and strengthening the DXY.
Current 10-Year Yield (June 12, 2025): 4.36%, down slightly from 4.41% the previous day but up 1.16% year-over-year.
2. Bond Price
Inverse Relationship with Yields: Bond prices fall when yields rise (and vice versa). Since DXY and yields are positively correlated, the dollar tends to strengthen when bond prices decline.
3. Interest Rates
Direct Link: Higher U.S. interest rates increase the dollar’s appeal as investors seek higher returns, boosting DXY. Conversely, rate cuts weaken the dollar.
Example: The Federal Reserve’s rate hikes in 2023–2024 contributed to DXY strength, while recent rate-cut expectations have moderated its gains.
Current 10-Year Treasury Yield
As of June 12, 2025, the 10-year Treasury yield is 4.36%, below its long-term average of 5.83%.
Key Drivers of DXY in 2025
Federal Reserve Policy: Markets are pricing in potential rate cuts later in 2025, which could limit DXY upside.
Global Risk Sentiment: Safe-haven dollar demand rises during geopolitical or economic uncertainty.
Inflation Trends: Persistent U.S. inflation could delay Fed easing, supporting DXY
technical level to watch is the support level at 97,949

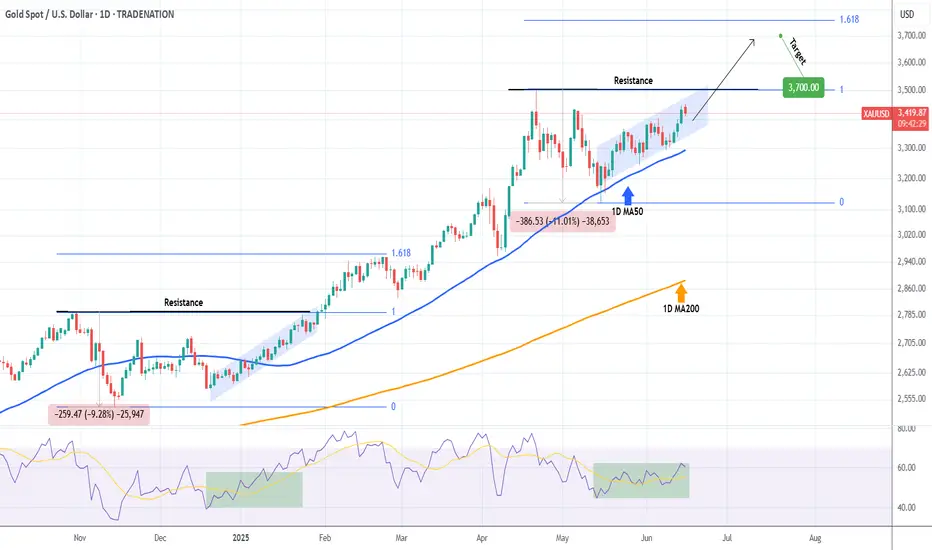
XAUUSD Strong break-out ahead to $3700.Gold (XAUUSD) is trading within a Channel Up, while being supported by the 1D MA50 (blue trend-line). This is similar to the December 19 2024 - January 30 2025 Channel Up, which when it broke above the previous Higher High Resistance, it rose straight to the 1.618 Fibonacci extension.
As a result, as long as the 1D MA50 supports, we are looking for a medium-term bullish break-out, possible by the end of July, targeting at least 3700.
-------------------------------------------------------------------------------
** Please LIKE 👍, FOLLOW ✅, SHARE 🙌 and COMMENT ✍ if you enjoy this idea! Also share your ideas and charts in the comments section below! This is best way to keep it relevant, support us, keep the content here free and allow the idea to reach as many people as possible. **
-------------------------------------------------------------------------------
Disclosure: I am part of Trade Nation's Influencer program and receive a monthly fee for using their TradingView charts in my analysis.
💸💸💸💸💸💸
👇 👇 👇 👇 👇 👇
WEEK 16 - 20 JUN WAR, VIX OPTIONS, SPY MONTHLY OPTIONS ******** AAPL
Block High: 212.09
Block Low: 194.80
PUT Active: Strike 200.17
CALL Active: Strike 196
Open Gap: 198.22 → 195.70 (likely support retest or fill)
Channel: Bearish
Scenario:
Holding 195.70 = chance to fill gap to 198.
If 194.80 breaks = risk drops to 190–186.
******** NVDA
Block High: 145.00
Block Low: 137.46
PUT Active: Strike 145.25
Channel: Sideways
Scenario:
Support at 140–141 holding.
Over 145 = breakout. Below 137.5 = flush to 133.
******** MSFT
Block High: 479.37
Block Low: 457.50
PUT Active: Strike 475
Channel: Ascending
Scenario:
Strong demand near 470.
Above 479 = upside to 488+. Below 457 = pullback to 448.
******** AMZN
Block High: 217.60
Block Low: 207.64
PUT Active: Strikes 214, 212
CALL Active: Strike 212
Open Gap: 212.72 → 207.64
Channel: Downtrend with support defense
Scenario:
Gap can act as support. Bounce at 208–210 = move back to 215+.
Loss of 207.6 = risk to 202.
******** GOOGL
Block High: 179.65
Block Low: 169.91
CALL Active: Strikes 178, 175
PUT Active: Strike 172
Open Gap: 174.83 → ~170.6 (still active)
Channel: Uptrend
Scenario:
Above 176 = retest 179.
Below 172 = gap fill to 170, then 169.9 as key level.
******** META
Block High: 701.96
Block Low: 663.45
PUT Active: Strike 708.36
Open Gap: 688.60 → 670 (gap is open)
Channel: Soft descending
Scenario:
Holding 670 = chance to reclaim 700+.
Break of 663 = full gap fill to 640s.
******** NFLX
Block High: 1258.98
Block Low: 1187.95
PUT Active: Strike 1220
CALL Active: Strike 1190
Open Gap: None
Channel: Consolidation triangle
Scenario:
Breakout over 1229 = continuation to 1260+.
Below 1188 = pullback to 1160–1170.
******** TSLA
Block High: 356.53
Block Low: 277.59
CALL Active: Strike 313
PUT Active: Strike 336
Open Gap: 336.44 → 313.44 (wide open)
Channel: Broadening range
Scenario:
Defending 313 = move toward 336.
Loss of 313 = fills the gap to 300–290 range.

$EURUSD Analysis | Bearish Confluences in PlayPEPPERSTONE:EURUSD
The Fiber is currently testing multiple technical barriers, including the golden Fibonacci zone, channel resistance , and bearish harmonic patterns. A lower-degree double top has led to a potential bearish 2618 setup, suggesting short-term downside risk.
📉 Fractal Structure Zones
🔸 Daily fractal resistance (short-term): 1.1631
🔸 Weekly fractal resistance (mid-term): 1.1573
🔸 Intraday resistance (4H): 1.1569
🔸 Intraday support (4H): 1.1523
🔸 Daily fractal support: 1.1371
🔸 Monthly fractal resistance (long-term): 1.1213
🔸 Weekly fractal support: 1.1065
🔸 Monthly fractal support: 1.0177
A rejection below intraday support may validate the bearish setup, while a sustained break above daily resistance would question the harmonic scenario.
Happy Trading,
André Cardoso

Artificial Superintelligence (FET): Looking For Buy Entry 2We are shifting our focus currently to the 200EMA, where we are expecting the price to reach that area this week; after that, we will be looking for a proper breakout from that region.
In total we still got those 3 entry points we've been aiming for since last time so we wait patiently, not rushing.
It does not matter which entry will be triggered; once we see that, we will be opening a decent R:R position (more info once we reach certain zones).
Swallow Academy

Middle East tensions rise, gold eyes 3500 this week
🌍 Over the weekend, tensions in the Middle East escalated sharply, with geopolitical conflicts further intensifying. Multiple forces were drawn into the fray, the scope of conflict expanded continuously, and related military actions triggered widespread international concern, significantly increasing regional uncertainty. This geopolitical instability has had a profound impact on global financial markets, causing a notable decline in investors' risk appetite. Against this backdrop, gold, as a traditional safe-haven asset, has once again become the top choice for investors. The market expects that as the Middle East situation continues to ferment in the coming week, risk-averse sentiment will remain high, and gold is expected to continue benefiting from this trend, with a high likelihood of breaking through the key $3,500 mark 📈.
Additionally, this week's Federal Reserve interest rate decision and Chairman Powell's speech will also be key factors influencing the trend of gold prices. Recent U.S. economic data has been mixed, and fluctuations in inflation figures as well as subtle changes in the job market have left the market full of uncertainty about the Fed's monetary policy direction. If the Fed signals a dovish stance in its interest rate decision, hinting at the possibility of future rate cuts, gold prices will undoubtedly gain further upward momentum. A lower interest rate environment reduces the opportunity cost of holding gold while weakening the appeal of the U.S. dollar, thus prompting more funds to flow into the gold market. Conversely, if the Fed adopts a hawkish stance, emphasizing the maintenance of current interest rates or even hinting at possible future rate hikes, this will exert certain pressure on gold prices ⚖️.
Equally noteworthy is that U.S. President Trump will visit Canada from June 15th to 17th to attend the G7 Leaders' Summit. Trump's words and deeds in international affairs often carry significant influence and uncertainty. At this summit, his speeches and interactions with other world leaders may trigger a reassessment of the global economic and trade situation by the market, thereby causing fluctuations in gold prices 📊. For example, if Trump makes tough statements on trade policies, geopolitics, etc., it may exacerbate market concerns and push gold prices higher; if he conveys more positive signals of cooperation, market risk appetite may recover, and gold prices may face certain correction pressure. Therefore, investors need to closely monitor every move of Trump at the summit to timely grasp investment opportunities and risks in the gold market 👀
⚡️⚡️⚡️ XAUUSD ⚡️⚡️⚡️
🚀 Buy@ 3410 - 3415
🚀 TP 3480 - 3490
Accurate signals are updated every day 📈 If you encounter any problems during trading, these signals can serve as your reliable guide 🧭 Feel free to refer to them! I sincerely hope they'll be of great help to you 🌟 👇

NZDJPY TECHNICALS AND FUNDAMENTALS DETAILED ANALYSISNZDJPY is currently trading around the 87.00 handle and has just bounced strongly from a well-respected support zone. The pair is now showing clear signs of recovery after a brief corrective dip, and price action on the 8H chart confirms a bullish reversal structure. The support held firmly, and we’ve already seen a solid rejection wick forming the foundation of this new impulsive leg up. With this momentum in play, I’m targeting the 90.00 zone in the coming sessions.
On the macro front, the New Zealand dollar is benefiting from a relatively hawkish RBNZ stance. Inflation pressures remain sticky in New Zealand, and the central bank has reiterated its cautious approach toward rate cuts. Meanwhile, the Japanese yen remains under persistent selling pressure due to the Bank of Japan's ultra-loose policy and intervention uncertainty. These diverging central bank outlooks are fueling continued upside in NZDJPY as carry trade flows remain in favor of the kiwi.
From a technical perspective, the market structure remains bullish. After retesting a previous higher low, price is climbing within a clean channel and has broken minor resistance levels convincingly. This aligns well with a swing continuation pattern toward the 90.00 mark. Momentum is supported by increasing bullish volume, and as long as we remain above 86.00, the bulls are firmly in control.
In my analysis, this is a textbook setup. We’re seeing higher lows, strong trend continuation, and a macro-backed directional bias. I’m long from 87.00 with a bullish outlook into 90.00. I’ll reassess price action as we approach major resistance levels, but until then, I remain confidently positioned with a clear technical and fundamental confluence.

Middle East Tensions Soar, Bulls Remain DominantBrief Update on Escalating Israel-Iran Conflict:
On June 14, Israeli forces airstruck Iran's Defense Ministry, nuclear facilities, and oil installations—causing a Tehran residential building to collapse and killing 60 civilians. 💥
Iran fired 50 ballistic missiles into Israel, damaging structures in Tel Aviv. A senior advisor to Iran's Supreme Leader died from injuries; Israel released a hit list of 9 Iranian nuclear scientists. ⚠️
Iran Nuclear Talks Developments:
Iran announced new nuclear safeguards without IAEA notice, warning NPT withdrawal if sanctioned. 🛑
June 15th U.S.-Iran talks canceled. ⏳
The Middle East situation is currently heating up 🌍💥. With the intensifying of geopolitical tensions in the Middle East over the weekend, gold is likely to continue to benefit from the boost of risk-averse sentiment next week and may break through the $3,500 mark 📈. The price of gold will also be affected by the Federal Reserve's decision and Powell's speech during the week 🏛️. In addition, US President Trump will visit Canada to attend the G7 Leaders' Summit from June 15th to 17th, and his speech at that time may also affect the fluctuation of gold prices, which is worthy of attention 🇺🇸🇨🇦
⚡️⚡️⚡️ XAUUSD ⚡️⚡️⚡️
🚀 Buy@ 3410 - 3415
🚀 TP 3480 - 3490
Accurate signals are updated every day 📈 If you encounter any problems during trading, these signals can serve as your reliable guide 🧭 Feel free to refer to them! I sincerely hope they'll be of great help to you 🌟 👇

XAUUSD is on bullish momentum H1 & H4 Timeframe Analysis
Gold is currently showing a bullish trend due to the ongoing Middle East crisis.if th Escalation between Iran & isreal became more tense then focus on buying gold on every DIP.
Bullish scanario:
I’ve identified my re-entry zones and plan to buy on every dip, focusing on scalping with buy positions only.
3380-3390 is the optimal buying area.
At moment 3410 is the buying area because the relative trend line matched at this place.
My target is the potential extension towards the $3480 milestone.
Bearish Scenario:
However, if gold closes the H4 below the $3380 level, I expect it to shift into a ranging market 3380-3330 and I will reassess my outlook towards 3355 1st then 3335 on second target.
#XAUUSD

XAUUSD GOLD ANNALSIS OUTLOOK BULLISH PERFORMANCE 16/6/2025sell 3440 3445
take profit 3435
take profit 3425
take profit 3415
stop los 3458

Monday trades of the day🔥 These are the scalps I’ve got my eye on today. 🔥
Mostly looking at continuation longs — unless structure tells a different story.
💡 Key Plan:
For each long setup, I’ll wait for an internal market structure (MS) flip before pulling the trigger. No confirmation, no entry. Precision is the priority.
📅 Class Schedule:
Monddaday | After 6 PM

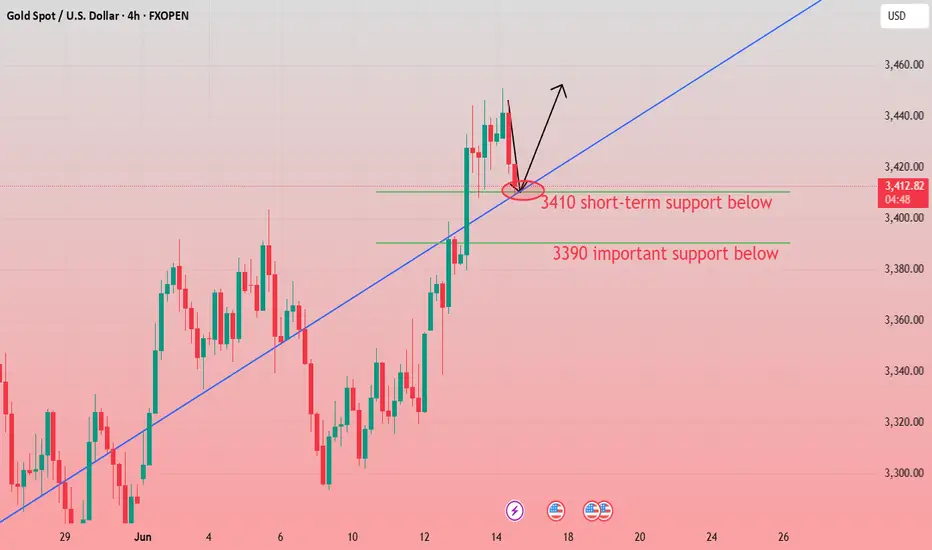
Gold trend analysis and operation ideasFrom the 4-hour market analysis, the support below is around 3408-10. The short-term bullish strong dividing line moves up to the 3388-93 level. The daily level stabilizes above this position and continues to maintain the same low-long rhythm. Short positions against the trend need to be cautious. There is a high probability that the short-term will continue to rush up to test the previous high.
Gold operation strategy:
Gold goes long when it falls back to 3408-10, and goes long when it falls back to 3388-95. Stop loss 3384, target 3445-3450, and continue to hold if it breaks;
BTC BITCOIN ,we are watching every step and price action,the next clear directional bias on long will be on the break and close of daily supply roof at 111k, while the sell confirmation will be on the break and possible retest of the daily ascending trending line holding buyers for today 16th.
Israel and Iran war could be seeing liquidity into crypto especially bitcoin

GBPCAD sellopened under previous consolidation and value area
lower prices are accepted
swiped out asia session on H1

Gold price falls back and continues to go longFrom the 4-hour market analysis, the support below is around 3408-10, and the short-term bullish strong dividing line moves up to the 3388-93 level. The daily level stabilizes above this position and continues to maintain the same low-long rhythm. Short positions against the trend need to be cautious. There is a high probability that the short-term will continue to rush up to test the previous high.
Gold operation strategy:
Gold falls back to 3408-10 and goes long. Fall back to 3388-95 and add more positions. Stop loss 3384, target 3445-3450, and continue to hold if it breaks;

ES1!/SP500 Targeting Weekly Range Resistance***QUOTING SEP CONTRACT FOR JUNE CONTRACT OR CASH US500 EQUIVALENT LEVELS SUBTRACT ~52 POINTS***
***WEEKLY ACTION AREA VIDEO TO FOLLOW AHEAD OF NY OPEN***
WEEKLY BULL BEAR ZONE 6090/6100
WEEKLY RANGE RES 6150 SUP 5914
DAILY RANGE RES 6090 SUP 5972
DAILY VWAP BULLISH 6019
WEEKLY VWAP BULLISH 5923
DAILY BALANCE - 6064/5965
WEEKLY ONE TIME FRAMING UP - 5965
MONTHLY ONE TIME FRAMING UP
GAP LEVELS 5843/5741/5710/5339
Balance: This refers to a market condition where prices move within a defined range, reflecting uncertainty as participants await further market-generated information. Our approach to balance includes favoring fade trades at the range extremes (highs/lows) while preparing for potential breakout scenarios if the balance shifts.
One-Time Framing Up (OTFU): This represents a market trend where each successive bar forms a higher low, signaling a strong and consistent upward movement.
One-Time Framing Down (OTFD): This describes a market trend where each successive bar forms a lower high, indicating a pronounced and steady downward movement.
GOLDMAN SACHS TRADING DESK VIEWS
Weekend Cross-Asset Dislocations (15-Jun-2025)
Oil Options Positioning Reaches Extreme Levels
On Friday, call buying in oil pushed the put-call skew to one of its most extreme levels in over 25 years. This indicates that investors are positioning for significant upside asymmetry. Notably, the shift in the put-call skew far exceeded the movement in near-term oil futures, compared to similar past episodes.
AI-Related Capex Remains Steady
Our analysts report that capex spending for 2025 and 2026 by the six largest hyperscalers has remained stable over the past few months. Bearish investors might interpret the absence of upward revisions as a sign of slowing momentum in the broader AI sector. Conversely, bullish investors could view the rebound in stock prices as a signal of growing confidence in hyperscalers and other AI-exposed companies to generate revenue sufficient to support planned capex.
Sector-Specific Divergences in Put-Call Skew
Friday saw notable divergences in put-call skew across sectors, highlighting the varied impact of global events. Increased call-buying pressure in energy aligns with the extreme shift in oil’s put-call skew. Meanwhile, rising put-call skew in Materials and Financials reflects heightened downside concerns, with Materials put-buying signaling fears of a broader economic slowdown.
Balanced Positioning in Single Stock Put-Call Skew
Despite sector-specific disparities, single-stock positioning remains balanced. The average stock’s put-call skew has returned to levels seen in March 2025, before the US tariff announcements.
IG Credit Spreads Tight Relative to Equities
Investment-grade (IG) equity investors appear more cautious than their credit counterparts, likely due to elevated uncertainty around US interest rates. A potential rate increase could disproportionately impact IG equity valuations.
Retail Investor Activity Remains Stable
Retail investor volumes have aligned with their five-year average, suggesting they remain engaged but have not been a dominant driver of equity performance in recent weeks. For single stocks, retail investors have been in a holding pattern, having shifted from net buyers earlier this year to small net sellers recently. This suggests they may be waiting for a broader market dip to resume buying.
SPX Daily Options Pricing Reflects Steady Volatility
SPX options are pricing daily moves between 0.9% and 1.2% over the next four weeks. Notably, options for this week’s FOMC meeting are pricing a relatively low ±0.9% move. While a ±1.2% move is priced for July 7, uncertainty remains regarding the volatility impact of the tax bill and the end of the 90-day tariff pause.
Professional Investors Maintain Cautious Stance
Entering 2025, professional investors significantly reduced their demand for leveraged equity exposure through futures, swaps, and options, signaling potential downside risks. While this trend has continued, the pace of selling has slowed in recent weeks, making the cautionary signal less alarming.
Wednesday marks the VIX expiry, which we believe has been supporting the market. Thursday is a market holiday, and Friday brings option expiry, likely leading to a high out-of-office session as risk-taking eases. The market may challenge crowded trades, with "short oil" being noted as particularly crowded.
1. Positioning (i): Hedge funds have been buying U.S. equities for six consecutive weeks, with net leverage exceeding 50% after reaching a five-year low in April. Despite a generally bearish outlook, investors are positioned bullishly due to limited alternatives.
2. Positioning (ii): Sector flows show increased risk aversion, with strong demand in utilities and significant supply in consumer discretionary sectors.
3. Positioning (iii): The systematic community remains long on stocks and is unlikely to sell significantly unless conditions worsen. The key level to watch in the SPX is 5800, both medium-term and short-term.
4. Flows (i): The long-only community has finally turned to buying stocks after three weeks of selling imbalances, ending $10 billion better to buy across all sectors.
5. Flows (ii): As the June expiry approaches, SPX call open interest is at an all-time high with 8.7 million contracts.
6. Trades (i): In derivatives, there have been buyers of VIX puts extending to July, with a significant premium built into the VIX curve. SPX realized volatility is at 12, while July VIX is nearly double that. Outright puts are intriguing, and some VIX puts were traded contingent on SPX falling below a certain level.
7. Trades (ii): Our cash desk believes the AI theme is gaining momentum. Callahan notes the increased visibility around GenAI as the biggest takeaway from the week. The Ellison earnings transcript highlights "astronomical" demand.
8. Trades (iii): The Goldman Sachs house view and consensus suggest that gold will continue its rapid rise. A July 97% put costs 100 basis points, representing the maximum loss premium paid.

ECB’s De Guindos Sees Balanced Inflation RisksEuropean Central Bank Vice President Luis de Guindos said Monday that the EUR/USD at 1.15 does not hinder the ECB’s inflation goal, noting the euro’s gradual rise and stable volatility.
He stated inflation risks are balanced, with little chance of falling short of the target, and that markets have clearly understood the ECB’s recent policy signals. De Guindos reaffirmed the ECB is close to its inflation objective
Looking ahead, he warned that tariffs could slow growth and inflation in the medium term but expressed confidence in the Fed maintaining swap line arrangements. He also confirmed there have been no discussions about repatriating gold reserves from New York.
At the time, EUR/USD was down 0.09%, trading near 1.1537.
Resistance is located at 1.1580, while support is seen at 1.1460.

Gold price falls back and continues to go longFrom the 4-hour market analysis, the support below is around 3408-10. The short-term bullish strong dividing line moves up to the 3388-93 level. The daily level stabilizes above this position and continues to maintain the same low-long rhythm. The short position against the trend needs to be cautious. There is a high probability that the short-term will continue to rush up to test the previous high.
Gold falls back to 3408-10 and goes long. Fall back to 3388-95 and add to long position. Stop loss at 3384. Target at 3445-3450. Continue to hold if it breaks.
