Cup & handle, bull flag - look for a breakoutCommodities are bullish right now if you didn't know.
Silver, Gold, Natural Gas, Palladium and more. They are all interesting right now. Commodities is the sector you should be looking at right now.
We had tech, weedstocks, cryptos, ai
now look for commodities for near term plays.
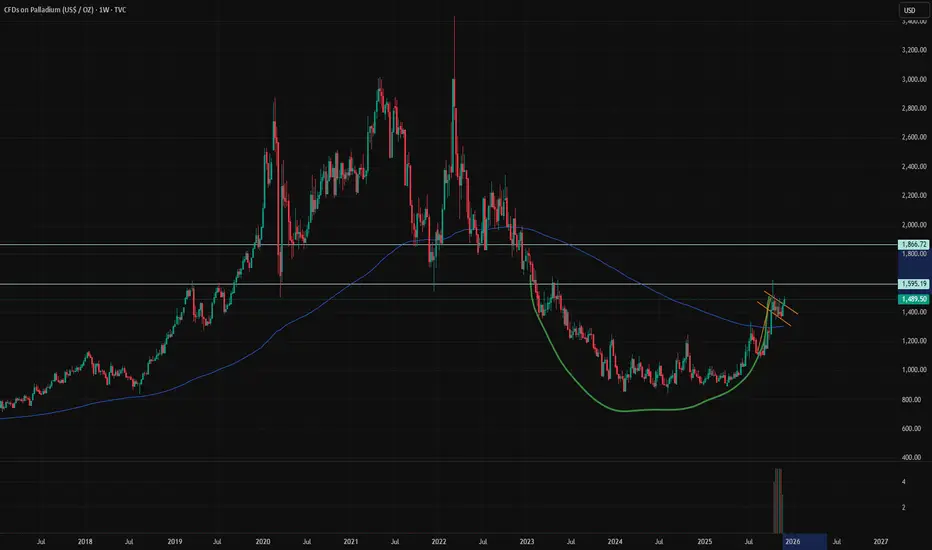
Speaking of Palladium, I love this chart. Beautiful.
We have a nice formation of a 2 year cup with a resistance at 1600$
Short term, we have near break out of bull flag at 1500$
The blue zone extending to may should be a zone where you have to keep close attention to this chart.
I'm expecting a breakout with target of 1870 ish on palladium. I'm early on this one, there is no breakout at the moment. I just follow the good sector and bet on the nice chart.
Harmonic Patterns
Cipher Mining : Bitcoin Miner to AI Infrastructure PowerhouseDespite a recent corrective pullback of 33.26% from its 52-week zenith of $25.52, achieved on November 5th, Cipher Mining Inc. (CIFR) is not merely weathering the storm—it is actively engineering a fundamental business transformation that has captured the intense scrutiny of Wall Street. The company, which initially carved its niche as a large-scale Bitcoin miner, is now successfully pivoting to become a formidable player in the future-facing digital infrastructure landscape. This strategic evolution, underscored by a monumental, recently expanded partnership, suggests that the company's journey is far from stalled; it may, in fact, be just beginning a new and more lucrative chapter.
The Strategic Pivot: Evolving from Pure-Play Miner to Digital Infrastructure Leader
Founded in 2021 and headquartered in New York, Cipher Mining established itself with a clear focus: building and operating industrial-scale facilities to mine Bitcoin. However, recognizing the immense and parallel growth in the artificial intelligence (AI) sector, the company has astutely leveraged its core competencies to expand its mission. With a market capitalization of approximately $6.6 billion, Cipher continues its Bitcoin mining operations, but it is now rapidly emerging as a developer and operator of high-performance computing (HPC) data centers. This dual-pronged strategy allows it to capitalize on the crypto cycle while simultaneously building a resilient, long-term revenue stream from the voracious demand for AI computational power.
The Cornerstone Agreement: A Decade-Long, Multi-Billion Dollar Partnership with Fluidstack
The primary catalyst for the recent investor fervor stems from Cipher's deepened alliance with Fluidstack, a specialist in building powerful HPC clusters for top-tier enterprise clients. While the companies initially announced a 10-year colocation partnership in September, they have significantly expanded the terms this month.
The expanded agreement entails:
Substantial Capacity Allocation: Cipher will add a critical 39 MW of IT load (supported by up to 56 MW of underlying capacity) to its Barber Lake HPC data center campus in Texas.
Full Campus Utilization: This addition enables Fluidstack to lease the entirety of the site's massive 300 MW capacity, effectively making Cipher's Texas campus a dedicated hub for Fluidstack's AI cloud operations.
The financial implications of this deal are staggering and provide unprecedented revenue visibility:
Base Contract Value: The initial 10-year term is projected to generate approximately $830 million in revenue for Cipher.
Extension Potential: The agreement includes two optional five-year extensions. If exercised, the total contract value could surge to approximately $2 billion.
Total Lease Value: Over the entire potential lease period, the cumulative value could approach a monumental $9 billion.
A Seal of Approval: Google's Billion-Dollar Backstop
Adding a profound layer of credibility and financial security to the venture, technology behemoth Google (GOOG, GOOGL) has demonstrated its confidence in the partnership. To support this massive expansion, Google has increased its financial backstop of Fluidstack's lease obligations by $333 million. This elevates Google's total support to a colossal $1.73 billion. This vote of confidence from one of the world's most influential tech companies not only de-risks the project for Cipher but also enables more robust and favorable debt financing for the data center's development.
Funding the Future: A Balanced Capital Strategy
To bring this ambitious project to life, Cipher Mining has outlined a prudent funding strategy. The construction will be financed through a combination of project-related debt, facilitated by the strong Google backing, and an injection of approximately $118 million in additional equity. This balanced approach aims to minimize dilution for existing shareholders while leveraging the attractive debt markets to fund a high-return project.
Wall Street's Verdict: Overwhelmingly Bullish
The strategic shift and the landmark Fluidstack agreement have not gone unnoticed by analysts. A wave of enthusiasm is sweeping through Wall Street, solidifying Cipher's status as a compelling growth story.
Strong Buy Consensus: The stock currently boasts a "Strong Buy" analyst consensus rating. Out of the 14 experts covering CIFR, a commanding ten recommend a "Strong Buy," two advocate a "Moderate Buy," and only two maintain a "Hold" rating.
Price Target Upside: The average 12-month price target sits at $25.04, implying a substantial 30.8% upside from current price levels. The most optimistic forecasts are even more bullish, with a high price target of $33 suggesting a potential surge of 72%.
Notably, firms like H.C. Wainwright have turned increasingly bullish, raising their price target to $30 from $25. They specifically highlighted the company's direct colocation deal with Amazon Web Services (AWS) as a major "stamp of credibility" that validates Cipher's position in the competitive HPC and AI data center market.
Spectacular Year-to-Date Performance in Perspective
Even after its recent pullback, Cipher's stock performance in the current year has been nothing short of extraordinary. The shares have skyrocketed 312.72% year-to-date (YTD), a rally fueled by three key drivers:
Explosive growth in Bitcoin mining output.
The strategic pivot into high-performance computing.
The securing of major AI hosting contracts, including the flagship deal with Fluidstack.
This performance becomes even more striking when contrasted with the broader market. The S&P 500 Index ( SP:SPX ), while having a strong year, has managed a far more modest gain of 15.83% over the same period, placing Cipher's 312%+ rally in a league of its own.
Conclusion: Is Cipher Mining Stock a Buy Now?
The critical question for investors remains: does the recent dip represent a buying opportunity or a sign of underlying weakness? The evidence suggests the former. Cipher Mining is successfully executing a transformative strategy, moving beyond the volatility of Bitcoin mining to establish itself as a critical infrastructure provider in the high-growth AI ecosystem. The $830 million to $9 billion partnership with Fluidstack, backed by Google's financial muscle, provides a decade-plus of visible, high-quality revenue. Combined with overwhelming analyst support and a proven ability to outperform the market, Cipher Mining (CIFR) presents a compelling narrative for investors seeking exposure to the convergence of blockchain and artificial intelligence infrastructure. While the stock's volatility may not be for the faint of heart, its fundamental prospects appear stronger than ever.

NQ1! 1M Bearish ABCD harmonic pt2@12982NQ1 Bearish ABCD (represented with `~` icon in this chart) hit pt1 at 19465 after first JPN carry trade crisis, then bullish retracement up to 1.272, now projected to continue bearish to pt2 @ 12982 (or lower).

Ethereum (ETH) Update | is lower coming? Ethereum has rejected cleanly from a key technical zone and continues to move within an aggressive downtrend. Price is now sitting directly on the $2,800 support region, a level that has historically attracted short-term reactions.
Multiple lower-time-frame candle closes may form around this zone before ETH chooses its next move. The broader high-time-frame range remains intact, meaning Ethereum is still rotating between established highs and lows without breaking structure.
Key Points
- Strong rejection from a major resistance level
- ETH now testing the $2,800 support zone
- Downtrend still dominant with HTF range intact
What to Expect
If $2,800 holds, ETH may see a short-term relief bounce. Failure to hold this level opens the door to deeper corrective targets within the broader HTF range.

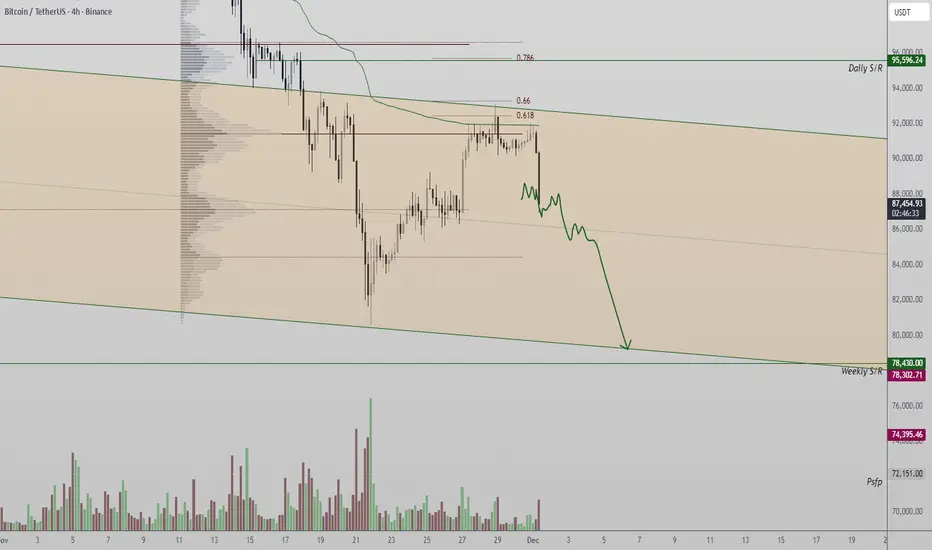
Bitcoin (BTC) Update| Trading Range Low Target Bitcoin has rejected from the local channel high, where the VWAP and the 0.618 Fibonacci retracement created strong confluence. The rejection was confirmed by a clear engulfing candle, sending price back toward the base of the previous consolidation zone.
A series of candle closes around this area may occur before a decisive move forms. For now, BTC remains structurally contained within its broader trading channel, signalling slow and corrective behaviour unless a breakout develops.
Key Points
- Rejection at channel high with VWAP + 0.618 Fib confluence
- Engulfing candle signals weakening momentum
- Price revisits prior consolidation base
What to Expect
If BTC holds this consolidation base, a short-term bounce is possible. A breakdown, however, would reopen lower support retests within the trading channel.
BTCUSD 1W - My Thoughts Going into Dec 1 2025 Week BTC heads into the first week of December in a clear corrective phase, with price likely to remain choppy as it digests the recent downside move. The mid-80k zone is acting as an interim equilibrium, but the broader structure still favors a deeper liquidity sweep toward the 70k-73k support band before any meaningful trend re-acceleration.
Volatility should remain elevated, and the market is positioned to shake out weak hands during this chop. Structurally, pullbacks into key supports continue to define the higher timeframe trend, while sellers are losing momentum on each leg lower.

Is $SOFI gunning for $37?Is NASDAQ:SOFI gunning for $37?
After a few months consolidating between the $25 and $32 levels, Sofi appears to be ready to have upward momentum as the MACD is showing a bull cross. Assuming the market selloff in high beta is taking a prolonged pause, I see this name gradually climbing based on their future growth prospects as a platform based financial innovation and banking company.
Idea would invalidate on a weekly close below $28.
I would put a stop at $27.5 if tailing.
Best of luck of tailing.

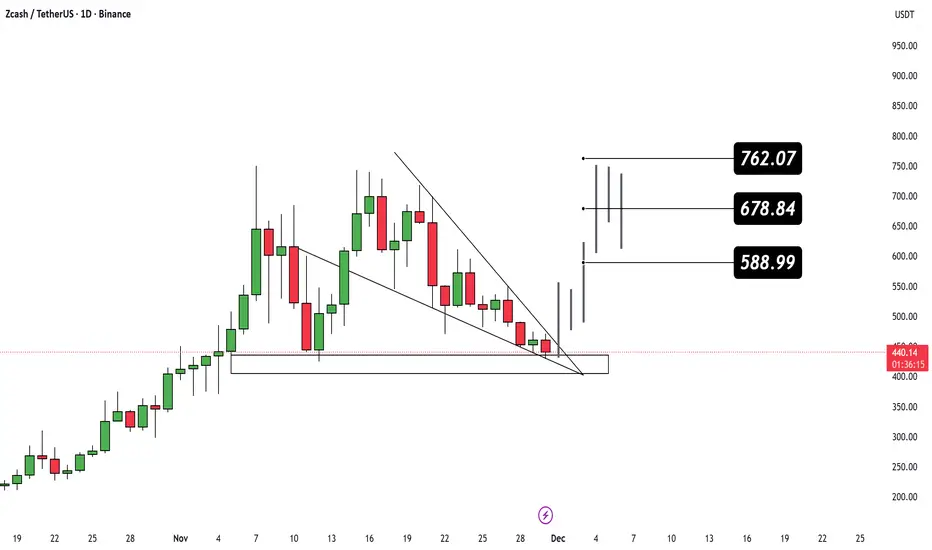
ZEC Massive Reversal Loading
Zcash is completing a falling wedge + demand zone touch, a classic bullish reversal setup📉➡️📈
As long as price holds the support box, upside continuation becomes highly likely.
🎯 Targets:
• $588.99
• $678.84
• $762.07
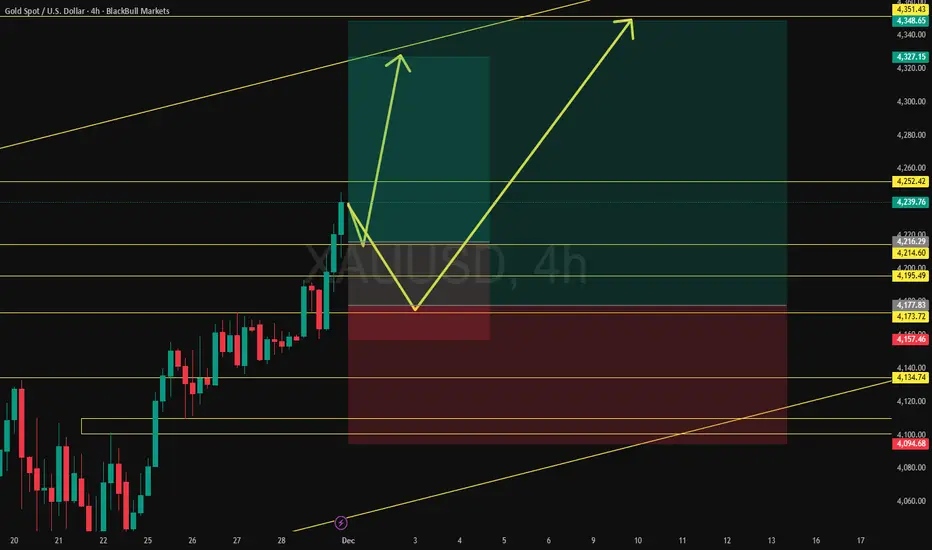
Gold Early-Week Long Setup — Sharp Pullback → Swift Upside MoveGold closed the week and month with strong bullish momentum. Historically, this often leads to a swift early-week continuation move if we get a tradable pullback.
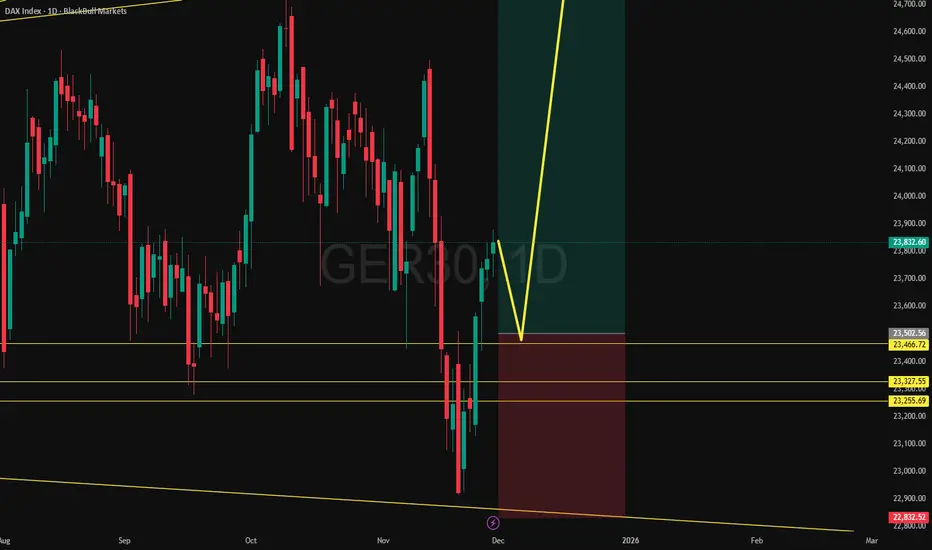
DAX Expanding Wedge Long Setup — Bottom Retest + False BreakDAX is trading inside a broadening/expanding wedge within a larger uptrend. Price has recently swept the lower boundary and faked below a short-term trendline, showing signs of a downside trap.
LINK NEXT TARGET#LINK is completing a clean harmonic reversal pattern on the 4D timeframe — with price sitting exactly at point A, a key demand zone and structural support🔥📈
BIST:LINK If this harmonic plays out, we should see a multi-leg expansion toward:
🎯 Point B → 0.473 ratio
🎯 Point C → 0.484 completion
🎯 Point D → 1.244 – 4.373 extension zone (major breakout targets)

NVO- Super Mega TrendOnce a life time oppurtunity for a mega company. I belive this megatran will work. althought there are few negative news for the company I belive they are just small problems

S&P500 Index Goes "Hanging Man" Due To Mixed Monthly ReturnsHanging man pattern is a single-candle bearish reversal signal that appears after an uptrend and warns that selling pressure is starting to emerge, even if the candle closes bullish.
For the S&P 500 November 2025 monthly candle, current data show a shallow pullback within an ongoing uptrend rather than a textbook hanging man, so any bearish implication is weak and unconfirmed.
What a hanging man is
A hanging man is a one-candle pattern that appears after a price advance and has a small real body near the top of the range, a long lower shadow (typically at least twice the body), and little or no upper shadow. It signals that sellers were strong intramonth (long lower wick) but buyers managed to push price back up by the close, creating a warning of potential trend exhaustion that must be confirmed by a subsequent bearish candle or downside break.
Key points for a valid hanging man on a higher timeframe such as a monthly chart are:
Clear prior uptrend into the candle.
Small body near the high, long lower shadow, minimal upper shadow.
Bearish confirmation the next bar (lower close or break of the low).
S&P 500 November 2025 monthly candle
Available November 2025 data show that the S&P 500 spent most of the month near recent highs after breaking above the 6,800 area, with the broader structure still strongly bullish into year-end 2025. While there was some downside volatility, the monthly action is better characterized as a modest pullback or consolidation after a strong advance than a classic hanging man with a pronounced long lower shadow and tiny body at the top of the range.
Several technical commentaries into late November and early December focus on resistance, overbought readings, and risk of correction, but they do not highlight a confirmed monthly hanging man or other completed exhaustion signal for 2025. One analysis even notes that a specific type of monthly exhaustion pattern is not yet in place for 2025, implying that the major trend remains intact despite short‑term risks.
Bearish technical perspectives from here
Even without a textbook monthly hanging man, there are credible bearish technical scenarios because the index is extended and pressing important resistance zones, meaning a confluence of resistance near high Fibonacci retracement levels, overbought momentum (elevated RSI), and key moving average and trendline tests as areas where a failure could trigger a correction.
Market breadth remains weak
In a short, in the year 2025 there're still no any new 52-week highs for major indices that count number of stocks above 200-Day average, like INDEX:MMTH , INDEX:NCTH , INDEX:R1TH , INDEX:S5TH and so on.
Potential bearish follow‑through in coming months generally centers on:
A failure to sustain above current resistance bands, leading to a pullback toward roughly the 5400 – 5000 region that aligns with prior supports and Fibonacci levels.
Rising volatility around macro catalysts such as inflation data and Federal Reserve policy decisions, which could accelerate downside if the index breaks below short‑term support and recent uptrend lines.
Overall, the S&P 500 remains in a longer‑term uptrend into late 2025, and any hanging‑man‑like monthly candle would be treated as an early warning, not a standalone sell signal; bears still need confirmation via a decisive break of support and a sequence of lower highs and lower lows on weekly and daily charts.

SUNDAY BREAKDOWN 11/30/2025Patient and discipline. Trust your analysis and let the market come to ur set up.

XAUUSD on bullish runXauusd bullish trend is still going after the last week CME conspiracy.
What will be my stance?
Currently my 1st POI will be at 4190-4180 zone
Main target: 4245 then 4270-80(strong resistance area as Supply zone)
Important support:My 2nd POI will be at 4135–4145(good area for potential buy/reversal).
I’ll be watching the Asia session carefully for clean trade setups.
Avoid jumping in too early — the market may create fake spikes to grab liquidity first.

"UPTOBER" GOES "LAST-100K-SEEN-TOBER" AS BTC SHED 30 PERCENT OFFHooray.. Hooray...They called
🌕 “Uptober” Strikes Again
October has a reputation in crypto lore and it’s living up to it.
In the midst of all of that, Big Crypto Guys have been selling for a long time.
- And know what else?
- Last time they did it in 2021, then a year later BTC dropped 70%, or so.
..and yet, BTC has dropped 30 percent already.
Immediate supports could be seen as 76'000 and 50'000 (one- and two-year lows respectively).
--
Best wishes,
@PandorraResearch Team

BTCUSDWe now have seen a bounce at the FVG..at the sametime an arc retest.
We hit the bottom channel and a strong impulse while the S&P 500 just hit an all time high..new levels to be hit for the new investors. Watch closely

Bitcoin: Recovery Path to 250kHey guys in this video, I shared my thoughts on the current market state of INDEX:BTCUSD , why I believe the bull market isn't over yet and also what to expect the coming weeks.
If you find this content helpful, like, share, follow and most importantly share your thoughts in the comment below if you agree or disagree with my view. Lets help each other. Cheers.💚


ETH returned to the demand zone 2500–2700Ethereum (ETH) daily timeframe
ETH returned to the demand zone 2500–2700 where last time the market formed a reversal and produced one of the strongest upswings of the year. Now we see an almost mirror reaction. Liquidity is gathered. A buyer showed up. The market still holds structure above the local low and that is the first healthy signal.
Key level now is 3000–3040. If Ether stays above it and does not fall back under the active sell zone, the chance of trend recovery returns. In that case I look for a potential move to 3320 and after a breakout toward the liquidity area 3550–3720.
Further on the chart there are two heavy zones that will be a real test for the market. First 4000–4250, second deeper 4600–4850. If Ether breaks above them, bears can be temporarily forgotten. For now those are only intermediate stages.
The risk scenario is also clear. Losing 2700 especially on rising volume reopens the path to the 2400–2500 range. Below that is the zone where the global reversal was caught before and where the market can again hunt stops before a strong move.
Summary: Ether stands at a technical point that will decide the next direction. The first signal is here but confirmation is not yet. I’m watching closely without euphoria or guessing. Facts matter, not hopes. If the scenario confirms I’ll take the trend. If price falls apart, I’ll see it immediately.

Hitting prior highs…Ok so I’m thinking we break this top as a fake out for bulls to get momentarily trapped. We will break the high earlier this month then bulls will pile in, price will pullback over the next day or two then we will continue our way toward $5 and above. Major move happened last week and I think there may be some refuel and exhaustion at the start of the week. I started a short to scalp but will be closing it immediately upon profit. Looking to pile in and rebuy when this contract retraces to 4.6ish.

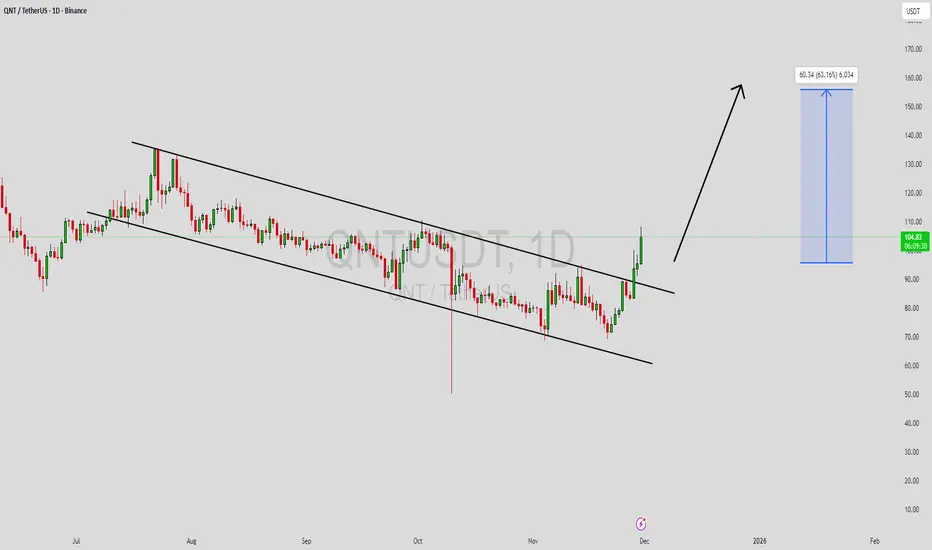
QNTUSDT Forming Falling WedgeQNTUSDT is forming a clear falling wedge pattern, a classic bullish reversal signal that often indicates an upcoming breakout. The price has been consolidating within a narrowing range, suggesting that selling pressure is weakening while buyers are beginning to regain control. With consistent volume confirming accumulation at lower levels, the setup hints at a potential bullish breakout soon. The projected move could lead to an impressive gain of around 50% to 60% once the price breaks above the wedge resistance.
This falling wedge pattern is typically seen at the end of downtrends or corrective phases, and it represents a potential shift in market sentiment from bearish to bullish. Traders closely watching QNTUSDT are noting the strengthening momentum as it nears a breakout zone. The good trading volume adds confidence to this pattern, showing that market participants are positioning early in anticipation of a reversal.
Investors’ growing interest in QNTUSDT reflects rising confidence in the project’s long-term fundamentals and current technical strength. If the breakout confirms with sustained volume, this could mark the start of a fresh bullish leg. Traders might find this a valuable setup for medium-term gains, especially as the wedge pattern completes and buying momentum accelerates.
✅ Show your support by hitting the like button and
✅ Leaving a comment below! (What is your opinion about this Coin?)
Your feedback and engagement keep me inspired to share more insightful market analysis with you!
GIGGLEUSDT Forming Bullish MomentumGIGGLEUSDT is forming a clear bullish momentum pattern, a classic bullish reversal signal that often indicates an upcoming breakout. The price has been consolidating within a narrowing range, suggesting that selling pressure is weakening while buyers are beginning to regain control. With consistent volume confirming accumulation at lower levels, the setup hints at a potential bullish breakout soon. The projected move could lead to an impressive gain of around 140% to 150% once the price breaks above the wedge resistance.
This falling wedge pattern is typically seen at the end of downtrends or corrective phases, and it represents a potential shift in market sentiment from bearish to bullish. Traders closely watching GIGGLEUSDT are noting the strengthening momentum as it nears a breakout zone. The good trading volume adds confidence to this pattern, showing that market participants are positioning early in anticipation of a reversal.
Investors’ growing interest in GIGGLEUSDT reflects rising confidence in the project’s long-term fundamentals and current technical strength. If the breakout confirms with sustained volume, this could mark the start of a fresh bullish leg. Traders might find this a valuable setup for medium-term gains, especially as the wedge pattern completes and buying momentum accelerates.
✅ Show your support by hitting the like button and
✅ Leaving a comment below! (What is your opinion about this Coin?)
Your feedback and engagement keep me inspired to share more insightful market analysis with you!
