YFIUSDT 1W AnalysisYFI ~ 1W Analysis
#YFI This is the lowest support block for now. Buy gradually from here with a short term target of at least 20%+ from this support.
Harmonic Patterns

LEVERUSDT 1D AnalysisLEVER ~ 1D Analysis
#LEVER This trade is very risky. Buy if you still have confidence in this coin with a short term target of at least 15%+ from this support.

CAD/CHF – Bearish Continuation Setup🔍 **CAD/CHF – Bearish Continuation Setup**
The CAD/CHF pair is set up for a continuation of its bearish trend, with the macroeconomic calendar showing no major events for either currency that could disrupt technical flows. Canadian Housing Starts data is minor, and there is nothing significant for the Swiss franc, making this an ideal week for technical setups.
On the daily chart, CAD/CHF is firmly bearish, showing persistent lower highs and lower lows as price rides down a well-defined channel. Attempts to rally have consistently failed at order blocks located in premium zones, with each mitigation quickly sold into by institutional players. This is confirmed by the repeated sweeps of liquidity above prior highs before price resumes its decline.
The H1 and M15 timeframes show precise execution of smart money concepts: the most recent rally into premium was met with an aggressive bearish rejection, break of structure, and clear loss of bullish momentum on the RSI. The structure remains bearish and intact, with no signs of exhaustion or reversal.
Given the overall technical picture and the lack of upcoming news, the most probable scenario is continued movement lower into unmitigated discount zones. Traders should look to enter short on pullbacks to premium order blocks, with stops placed above the most recent liquidity highs, and targets set at well-defined support and imbalance zones below.
**In summary:**
CAD/CHF remains a sell this week, as bearish momentum and smart money distribution dominate. The lack of news supports pure price action trades, making this an attractive opportunity for SMC-based strategies.
---

TOKENUSDT 1D AnalysisTOKEN ~ 1D Analysis
#TOKEN This is the lowest support for now. Buy gradually from here with a short term target of at least 15%+ from this support.

AUD/NZD – Smart Money Rejection Setup🔍 **AUD/NZD – Smart Money Rejection Setup**
AUD/NZD is consolidating after forming a clear bearish structure on the daily and 1H timeframes. Price recently swept liquidity above the previous day’s high and rejected strongly from the premium zone.
On M15, we observed a CHoCH and BOS, with a bearish rejection candle confirming redistribution. RSI has flipped downward, reinforcing bearish intent.
🎯 Risk-Reward: 1:3+
🧠 With no major macroeconomic drivers this week, this setup favors pure technical structure based on Smart Money concepts. Execution should follow mitigation confirmation.

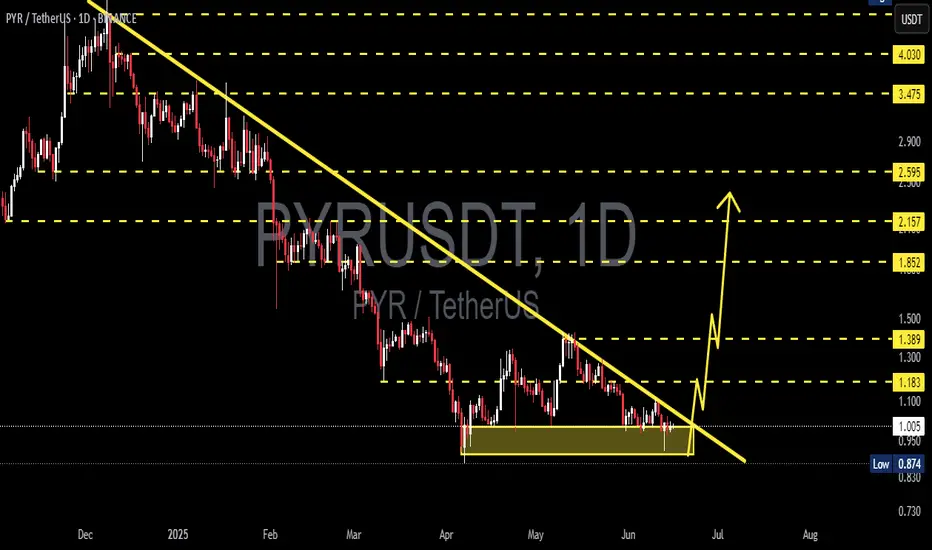
PYRUSDT 1D AnalysisPYR ~ 1D Analysis
#PYR Buy back gradually from here if you still have confidence in this coin with a short term target of at least 15%+
CHF/JPY – Premium Exhaustion Sell Setup🔍 **CHF/JPY – Premium Exhaustion Sell Setup**
On the daily timeframe, CHF/JPY reached a major Premium zone and swept the previous Weak High at 178.400. RSI is at its highest overbought level in months, indicating strong exhaustion.
Price has also formed internal CHoCH on lower timeframes (M15–H1), and we expect a correction towards the next key demand and imbalance zones.
🧠 Clean Smart Money setup based on exhaustion, premium rejection and BOS confirmation. No high-impact news expected for CHF or JPY this week – ideal for a technical swing setup.
Wait for mitigation or entry confirmation.

AUD/CHF – Smart Money Swing Setup🔍 **AUD/CHF – Smart Money Swing Setup**
Price continues its bearish structure on H4, with lower highs and lower lows aligning with institutional order flow. M15 confirmed a bearish CHoCH and BOS with liquidity above equal highs, offering a clean Sell Limit opportunity.
We have identified a high-probability target near 0.51500 — a strong H4 demand zone aligned with previous lows and an unmitigated order block.
🎯 Risk-Reward ~1:5
No major macro news this week for AUD or CHF, providing a clean environment for price action to unfold. Wait for mitigation and confirmation before entry.

GOLD GOLD ,April 3351 supply roof saw Sydney session take instant 100pips on early market open and if that layer is broken then we could be watching buyers print a new weekly high with 3500 ALTH in mind with extended buy touching 3530-3523 based on the structure. Its also giving aggressive buy into 3578-3580
Am watching the demand floor at 3393-3400 for buy

DENTUSDT 1W AnalysisDENT ~ 1W Analysis
#DENT This trade is very high risk. Buy if you still have confidence in this coin with a short term target of at least 20%+ from this support.

USD/CAD H1 | Bearish downtrend to extend deeper?USD/CAD is rising towards a pullback resistance and could potentially reverse off this level to drop lower.
Sell entry is at 1.3615 which is a pullback resistance.
Stop loss is at 1.3660 which is a level that sits above the 50% Fibonacci retracement and an overlap resistance.
Take profit is at 1.3565 which is a swing-low support.
High Risk Investment Warning
Trading Forex/CFDs on margin carries a high level of risk and may not be suitable for all investors. Leverage can work against you.
Stratos Markets Limited (tradu.com ):
CFDs are complex instruments and come with a high risk of losing money rapidly due to leverage. 63% of retail investor accounts lose money when trading CFDs with this provider. You should consider whether you understand how CFDs work and whether you can afford to take the high risk of losing your money.
Stratos Europe Ltd (tradu.com ):
CFDs are complex instruments and come with a high risk of losing money rapidly due to leverage. 63% of retail investor accounts lose money when trading CFDs with this provider. You should consider whether you understand how CFDs work and whether you can afford to take the high risk of losing your money.
Stratos Global LLC (tradu.com ):
Losses can exceed deposits.
Please be advised that the information presented on TradingView is provided to Tradu (‘Company’, ‘we’) by a third-party provider (‘TFA Global Pte Ltd’). Please be reminded that you are solely responsible for the trading decisions on your account. There is a very high degree of risk involved in trading. Any information and/or content is intended entirely for research, educational and informational purposes only and does not constitute investment or consultation advice or investment strategy. The information is not tailored to the investment needs of any specific person and therefore does not involve a consideration of any of the investment objectives, financial situation or needs of any viewer that may receive it. Kindly also note that past performance is not a reliable indicator of future results. Actual results may differ materially from those anticipated in forward-looking or past performance statements. We assume no liability as to the accuracy or completeness of any of the information and/or content provided herein and the Company cannot be held responsible for any omission, mistake nor for any loss or damage including without limitation to any loss of profit which may arise from reliance on any information supplied by TFA Global Pte Ltd.
The speaker(s) is neither an employee, agent nor representative of Tradu and is therefore acting independently. The opinions given are their own, constitute general market commentary, and do not constitute the opinion or advice of Tradu or any form of personal or investment advice. Tradu neither endorses nor guarantees offerings of third-party speakers, nor is Tradu responsible for the content, veracity or opinions of third-party speakers, presenters or participants.

Nikkei 225 H1 | Swing-high resistance at 61.8% Fibo retracementThe Nikkei 225 (JPN225) is rising towards a swing-high resistance and could potentially reverse off this level to drop lower.
Sell entry is at 38,245.01 which is a swing-high resistance that aligns with the 61.8% Fibonacci retracement.
Stop loss is at 38,500.00 which is a level that sits above the 78.6% Fibonacci retracement and a pullback resistance.
Take profit is at 37,855.58 which is an overlap support.
High Risk Investment Warning
Trading Forex/CFDs on margin carries a high level of risk and may not be suitable for all investors. Leverage can work against you.
Stratos Markets Limited (tradu.com ):
CFDs are complex instruments and come with a high risk of losing money rapidly due to leverage. 63% of retail investor accounts lose money when trading CFDs with this provider. You should consider whether you understand how CFDs work and whether you can afford to take the high risk of losing your money.
Stratos Europe Ltd (tradu.com ):
CFDs are complex instruments and come with a high risk of losing money rapidly due to leverage. 63% of retail investor accounts lose money when trading CFDs with this provider. You should consider whether you understand how CFDs work and whether you can afford to take the high risk of losing your money.
Stratos Global LLC (tradu.com ):
Losses can exceed deposits.
Please be advised that the information presented on TradingView is provided to Tradu (‘Company’, ‘we’) by a third-party provider (‘TFA Global Pte Ltd’). Please be reminded that you are solely responsible for the trading decisions on your account. There is a very high degree of risk involved in trading. Any information and/or content is intended entirely for research, educational and informational purposes only and does not constitute investment or consultation advice or investment strategy. The information is not tailored to the investment needs of any specific person and therefore does not involve a consideration of any of the investment objectives, financial situation or needs of any viewer that may receive it. Kindly also note that past performance is not a reliable indicator of future results. Actual results may differ materially from those anticipated in forward-looking or past performance statements. We assume no liability as to the accuracy or completeness of any of the information and/or content provided herein and the Company cannot be held responsible for any omission, mistake nor for any loss or damage including without limitation to any loss of profit which may arise from reliance on any information supplied by TFA Global Pte Ltd.
The speaker(s) is neither an employee, agent nor representative of Tradu and is therefore acting independently. The opinions given are their own, constitute general market commentary, and do not constitute the opinion or advice of Tradu or any form of personal or investment advice. Tradu neither endorses nor guarantees offerings of third-party speakers, nor is Tradu responsible for the content, veracity or opinions of third-party speakers, presenters or participants.

Nasdaq-100 H1 | Approaching a pullback resistanceThe Nasdaq-100 (NAS100) is rising towards a pullback resistance and could potentially reverse off this level to drop lower.
Sell entry is at 21,719.73 which is a pullback resistance.
Stop loss is at 21,870.00 which is a level that sits above the 78.6% Fibonacci retracement and a swing-high resistance.
Take profit is at 21,477.88 which is a multi-swing-low support.
High Risk Investment Warning
Trading Forex/CFDs on margin carries a high level of risk and may not be suitable for all investors. Leverage can work against you.
Stratos Markets Limited (tradu.com ):
CFDs are complex instruments and come with a high risk of losing money rapidly due to leverage. 63% of retail investor accounts lose money when trading CFDs with this provider. You should consider whether you understand how CFDs work and whether you can afford to take the high risk of losing your money.
Stratos Europe Ltd (tradu.com ):
CFDs are complex instruments and come with a high risk of losing money rapidly due to leverage. 63% of retail investor accounts lose money when trading CFDs with this provider. You should consider whether you understand how CFDs work and whether you can afford to take the high risk of losing your money.
Stratos Global LLC (tradu.com ):
Losses can exceed deposits.
Please be advised that the information presented on TradingView is provided to Tradu (‘Company’, ‘we’) by a third-party provider (‘TFA Global Pte Ltd’). Please be reminded that you are solely responsible for the trading decisions on your account. There is a very high degree of risk involved in trading. Any information and/or content is intended entirely for research, educational and informational purposes only and does not constitute investment or consultation advice or investment strategy. The information is not tailored to the investment needs of any specific person and therefore does not involve a consideration of any of the investment objectives, financial situation or needs of any viewer that may receive it. Kindly also note that past performance is not a reliable indicator of future results. Actual results may differ materially from those anticipated in forward-looking or past performance statements. We assume no liability as to the accuracy or completeness of any of the information and/or content provided herein and the Company cannot be held responsible for any omission, mistake nor for any loss or damage including without limitation to any loss of profit which may arise from reliance on any information supplied by TFA Global Pte Ltd.
The speaker(s) is neither an employee, agent nor representative of Tradu and is therefore acting independently. The opinions given are their own, constitute general market commentary, and do not constitute the opinion or advice of Tradu or any form of personal or investment advice. Tradu neither endorses nor guarantees offerings of third-party speakers, nor is Tradu responsible for the content, veracity or opinions of third-party speakers, presenters or participants.

WTI Oil H1 | Potential bullish bounceWTI oil (USOIL) is falling towards a multi-swing-low support and could potentially bounce off this level to climb higher.
Buy entry is at 71.83 which is a multi-swing-low support.
Stop loss is at 68.50 which is a level that lies underneath a pullback support and the 50% Fibonacci retracement.
Take profit is at 77.60 which is a swing-high resistance.
High Risk Investment Warning
Trading Forex/CFDs on margin carries a high level of risk and may not be suitable for all investors. Leverage can work against you.
Stratos Markets Limited (tradu.com ):
CFDs are complex instruments and come with a high risk of losing money rapidly due to leverage. 63% of retail investor accounts lose money when trading CFDs with this provider. You should consider whether you understand how CFDs work and whether you can afford to take the high risk of losing your money.
Stratos Europe Ltd (tradu.com ):
CFDs are complex instruments and come with a high risk of losing money rapidly due to leverage. 63% of retail investor accounts lose money when trading CFDs with this provider. You should consider whether you understand how CFDs work and whether you can afford to take the high risk of losing your money.
Stratos Global LLC (tradu.com ):
Losses can exceed deposits.
Please be advised that the information presented on TradingView is provided to Tradu (‘Company’, ‘we’) by a third-party provider (‘TFA Global Pte Ltd’). Please be reminded that you are solely responsible for the trading decisions on your account. There is a very high degree of risk involved in trading. Any information and/or content is intended entirely for research, educational and informational purposes only and does not constitute investment or consultation advice or investment strategy. The information is not tailored to the investment needs of any specific person and therefore does not involve a consideration of any of the investment objectives, financial situation or needs of any viewer that may receive it. Kindly also note that past performance is not a reliable indicator of future results. Actual results may differ materially from those anticipated in forward-looking or past performance statements. We assume no liability as to the accuracy or completeness of any of the information and/or content provided herein and the Company cannot be held responsible for any omission, mistake nor for any loss or damage including without limitation to any loss of profit which may arise from reliance on any information supplied by TFA Global Pte Ltd.
The speaker(s) is neither an employee, agent nor representative of Tradu and is therefore acting independently. The opinions given are their own, constitute general market commentary, and do not constitute the opinion or advice of Tradu or any form of personal or investment advice. Tradu neither endorses nor guarantees offerings of third-party speakers, nor is Tradu responsible for the content, veracity or opinions of third-party speakers, presenters or participants.

Gold long Gold can take out the lows from last week , and then continue higher.
If war escalates any further , this cant be stopped.

Triple Top Trouble? NAS100 May Be Losing SteamThe NAS100 has formed a potential triple top, and key trendlines are starting to break to the downside. This could signal a short-term correction before bulls attempt another push for new highs. A temporary drop might offer a better long setup if momentum resets.

Middle East Conflict Boosts Gold – But Is a Pullback Coming FirsGold is surging as the Middle East conflict intensifies, fueling a rush to safety. We’ve seen a clear breakout from the recent range, with a significant gap up at the open. While momentum could drive price to new highs, I’m eyeing a pullback to key zones for a cleaner entry—either at the trendline retest or a daily weakness setup.

FETUSD – Post-Breakout CooldownFetch showed a period of quiet sideways movement before breaking out sharply toward $0.70. The rally was followed by a rejection and pullback near resistance, currently stabilizing above $0.675.

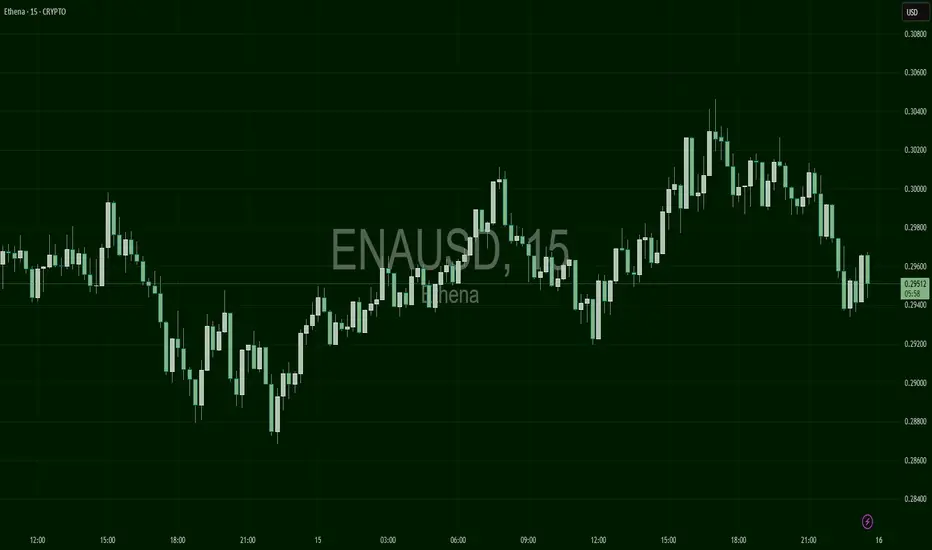
ENAUSD – Mid-Rally CorrectionENA had a consistent upward run overnight after forming a double-bottom near $0.285. The rally stalled at $0.306 with signs of profit-taking, now trending slightly lower.
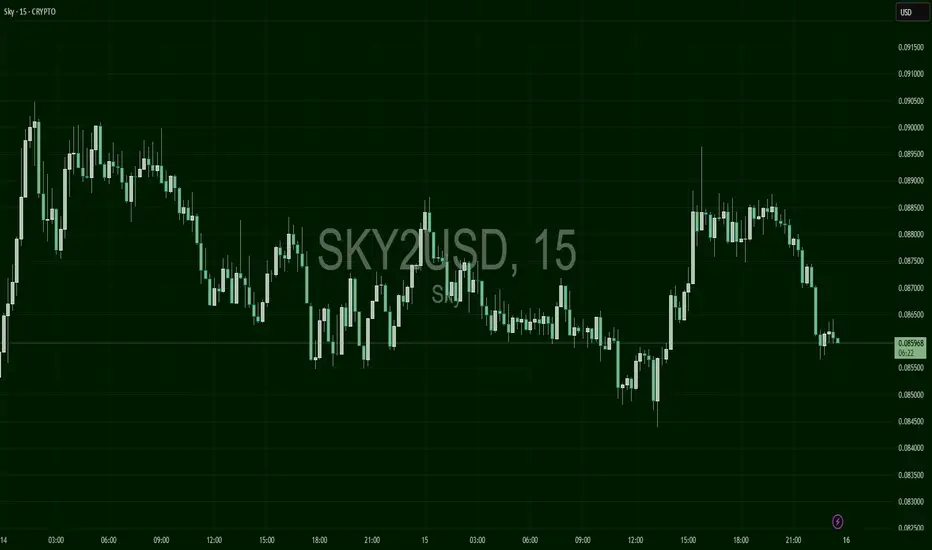
SKY2USD – Flatline BounceSKY2 maintained a tight range across most of the chart, but it spiked upward late in the session before falling back. Current bias remains directionless.
VETUSD – Bounce Then DriftVeChain recovered from a sharp drop near $0.0212 with a clean upward swing, briefly peaking before drifting sideways. Consolidation pattern forming.

ETH NEXT MOVE The chart shows **ETH/USD (Ethereum to USD)** on the **4H timeframe**, forming a **rising channel** pattern. Here's a breakdown of the analysis:
---
### 🔍 **Pattern Identified**
* **Rising Channel** (also known as an ascending channel):
* **Upper Resistance Line:** Price is currently testing this line.
* **Lower Support Line:** Held multiple times, confirming structure.
---
### 📈 **Current Price Action**
* **Price:** \~\$2,796.7
* ETH is **at the top of the channel**, facing strong **resistance**.
* Recent move was sharp and bullish, indicating momentum.
---
### ⚠️ **Possible Scenarios**
#### ✅ **Bullish Breakout (Less Common in Channels)**
* If price **breaks above** and **closes convincingly above the channel**, especially with high volume:
* Target zones: \$2,900 → \$3,000 → \$3,200.
* Look for **bullish continuation setups** on lower timeframes.
#### ❌ **Rejection from Resistance (More Likely)**
* If price **rejects the top** of the channel:
* Expect a pullback toward the **mid-line** or **lower support** (\~\$2,550 to \$2,400).
* This would offer a potential **buy-the-dip** opportunity.
---
### 📉 **Bearish Confirmation**
* A **breakdown below the lower trendline** (\~\$2,400):
* Invalidates the channel.
* Could trigger deeper correction toward \$2,200 and below.
---
### 📊 **Strategy Suggestions**
#### If Trading the Range:
* **Sell/Short** near top of channel (\~\$2,800), SL above channel.
* **Buy/Long** near bottom of channel (\~\$2,400), SL below channel.
#### If Anticipating Breakout:
* **Wait for retest** after breakout and enter on confirmation.
* Use trailing stops to manage risk.
---
### 🧠 Summary
| Bias | Direction | Reason |
| ------- | ------------- | ------------------------------------------- |
| Neutral | Ranging | Still inside the channel |
| Bullish | Above \$2,850 | Breakout with volume can fuel momentum |
| Bearish | Below \$2,400 | Breakdown from channel means trend reversal |

Beyond the Headlines - Gold Outlook June 16-20, 2025Beyond the Headlines: Gold's Ascent Amidst Global Shifts & Key Technicals 🌐🚀
Everything about the last week can be found here:
OANDA:XAUUSD 💰📈
We all know what's going on, I believe. Israel struck Iran 💥, and this conflict will likely take a bit before things cool down. 🥶
---
## Geopolitical News Landscape 🌍📰
### Israel / Iran
Since June 12, Israel launched "Operation Rising Lion," targeting Iranian nuclear sites like Natanz and Esfahan – over 128 killed, Iran claims. 🇮🇷 retaliated with missile and drone strikes on Haifa and Tel Aviv, killing at least 10. 🚀
**Outlook:** 🔥 Tensions are spiraling. Without urgent mediation, full-scale regional war remains a real risk. 💣
### India / Pakistan
Since the May ceasefire, few clashes have occurred. However, both navies increased readiness, signaling potential escalation at sea. 🚢
**Outlook:** ⚖️ Peace is fragile. A strategic dialogue is key to avoiding a renewed border or maritime conflict. 🙏
### Gaza Conflict
Between June 7–15, Israeli strikes killed at least 41 Palestinians, including 8 near an aid center in Rafah. Over 55,000 total deaths, and famine is looming. 💔
**Outlook:** 🆘 Gaza remains a humanitarian catastrophe. Global pressure for access and a ceasefire must intensify. 🕊️
### Russia / Ukraine
June 13–15: Russia returned the bodies of 1,200 Ukrainian soldiers in a rare POW swap gesture. 🤝 Fighting remains intense in Sumy and Toretsk; Russia hit a major oil refinery. 🏭
**Outlook:** 🕊️ While symbolic moves continue, no peace is in sight – battlefield outcomes will shape diplomacy. ⚔️
### U.S. - China Trade War
The U.S. hiked tariffs to 55% on key Chinese goods. 🇺🇸🇨🇳 responded with 10% on U.S. imports. Talks yielded a partial truce, but military-use rare earths remain unresolved. 💻
**Outlook:** 🔧 Tech remains the battleground. Without progress on critical materials, the trade war may deepen. 📉
### Global Trade War
The OECD revised global growth downward due to rising tariffs from the U.S. targeting 🇨🇳, 🇲🇽, 🇨🇦. Global trade volume is expected to shrink by 0.2–1.5%. 📉
**Outlook:** ⛓️ Supply chain disruption is spreading. Global trade will stay under pressure without coordinated policy. 🌍➡️🌍
### Trump vs. Powell
Trump labeled Powell a "numbskull" for not cutting rates, suggesting he might "force something" if re-elected. 🗳️ The Fed maintains policy independence ahead of a critical June decision. 🏛️
**Outlook:** ⚔️ Political pressure on the Fed is mounting. Expect more friction as the election cycle heats up. 🔥
### U.S. Inflation
CPI rose 2.4% YoY in May (from 2.3%); Core CPI held steady at 2.8%. Monthly growth was modest at 0.1%. Key rises were seen in healthcare and vehicle prices. 🚗🏥
**Outlook:** Inflation is stable but sticky. 🚦 The Fed will likely hold rates steady until clearer disinflation signals appear. 📊
---
## Technical View 📐📈
### Market Structure:
Gold shows a clear **bullish market structure** with higher highs and higher lows. ⬆️ Recent price action suggests we're in a strong uptrend with institutional buying pressure. 🏦
### Key Levels:
* The chart shows a significant low around the **$3,245 area** (marked as "Low") which could act as a key institutional support level. 💪
* The current high near **$3,446** represents a potential institutional resistance zone. 🛑
* Look for potential **order blocks** around the **$3,380-$3,400 range** where price consolidated before the recent breakout. 🧱
### Fair Value Gaps (FVG):
There appear to be several gaps in the price action during volatile moves, particularly during strong rally phases. These could act as future support/resistance areas. 📉📈
### Gann Analysis:
The price movement shows strong adherence to Gann principles:
* The rally from the low follows a steep angle, suggesting strong momentum. 🚀
* Key Gann angles would place support around the **$3,300-$3,320 zone**. 📐
* The current price near **$3,436** is testing natural resistance levels based on Gann square calculations. 📏
### Fibonacci Levels:
From the significant swing low to the current high:
* 23.6% retracement: ~$3,395 📉
* 38.2% retracement: ~$3,370 📉
* 50% retracement: ~$3,345 📉
* 61.8% retracement: ~$3,320 📉
The golden ratio levels suggest key support on any pullback would be around the **$3,370-$3,345 zone**. ✨
### Institutional Levels:
* **Weekly/Monthly Levels:** The **$3,400** and **$3,450** areas appear to be significant institutional levels based on round numbers and previous price action. 🏦💰
* **Smart Money:** The accumulation pattern before the breakout suggests institutional participation. 🧠💡
### Cycle Timing:
Based on the timeframe (appears to be 30-minute bars from May 26-June 15):
* We're seeing approximately **3-week cycles** in the major moves. 🗓️
* The current rally phase appears to be in its mature stage. 🌳
* The next potential cycle turn could be approaching, suggesting caution for new longs at current levels. ⚠️
---
### Trading Considerations:
* Watch for rejection at current levels near **$3,446**. 📉
* Key support confluence around **$3,370-$3,345** for potential re-entry. 🎯
* Volume and momentum divergences would be critical for timing any reversal. 📊🔄
Other indicators tend to show bullish scenario enhancements. 🚀
Gold has formed a ** Standard Bullish Flag pattern ** over a time from early April till today. 🚩🐂
Also, the structure of a ** reverse Head & Shoulders ** is existing and has broken the neckline! 🔄🗣️
Another indicator is an existing "** Ascending Bull Flag **." ⬆️🚩
Please take the time to let me know what you think about this. 💬
-------------------------------------------------------------------------
This is just my personal market idea and not financial advice! 📢 Trading gold and other financial instruments carries risks – only invest what you can afford to lose. Always do your own analysis, use solid risk management, and trade responsibly.
Good luck and safe trading! 🚀📊
