Bitcoin at Risk of Major Pullback! Key Support Levels to Watch BTCUSD is showing signs of weakness after rejecting the strong supply zone near $110K. Price has started forming lower highs and currently sits around $104,739, with bearish momentum gradually building. 👀
🔻 If the selling pressure continues, we could see price testing the next key support at $94,444 – a previously strong breakout level.
🚨 A break below $94K could open the way for a deeper correction toward the $76,318 demand zone, which aligns with a prior consolidation base and high-volume node. This level also overlaps with a visible range support and the March-April demand block (orange zone), making it a critical area for bulls to defend.
🔍 Technical Overview:
Resistance zone: $109,000 – $110,000 (rejection confirmed)
Key supports:
$94,444 → retest likely
$76,318 → major demand zone + potential long entry
Structure: Lower high forming, bearish signals increasing
Indicators: Potential bearish divergence forming (RSI not shown but implied)
🧠 What to Watch:
Watch for volume spike and candle pattern confirmation on the $94K level.
A clean break below $94K with retest could offer swing short setups.
Bulls will need to reclaim $110K to regain momentum.
💬 What’s your take? Are we heading for $76K or will bulls defend $94K? Comment below!
#BTC #Bitcoin #BTCUSD #Crypto #BitcoinAnalysis #TechnicalAnalysis #PriceAction #SupplyAndDemand #SupportResistance #Bearish #CryptoTrading #SwingTrade #TradingView
Harmonic Patterns

H1 pullback in bullish H4 marketThe market is at a point where we must sell, it's at a maximum of Elliott Waves, wave 5 is already extremely extended, so prepare for a mega drop of several weeks while everyone continues to buy at the lows, it will continue to go down. In summary, we have a bullish market on H4, now there will be a correction on H1, that is, a bearish trend on H1 for several weeks; it is not an ABC, but 5 bearish waves.

Turbulent Week Ahead? Gold Outlook June 9-13, 2025Hey fellow traders,
Let's dive into the OANDA:XAUUSD outlook for the upcoming week, June 9-13, 2025. The recent price action has been a rollercoaster 🎢, and the next few days promise even more fireworks 🎇.
Looking back at the 30-minute chart from May 22 to June 6, gold saw an initial consolidation, then a strong rally to multi-week highs near 3,420. However, this was followed by a sharp, dramatic reversal, pushing prices back below 3,300. This "bull trap" 🐂 pattern suggests underlying weakness and potential preemptive market positioning.
Another view on this could be the possibility that a gap on the chart at 3300-3295 of around $5 could get closed. Since strong support is right below this, it could serve as a good launchpad 🚀 for an upward rally. Let's see if the upcoming Asia session on Monday triggers this because its only - $14 from $3309.
Key Drivers for the Week Ahead:
📅 June 9, 2025 (Monday)
US-China High-Level Trade Talks Commence in London
High-level delegations from the United States and China began trade discussions in London. This meeting followed an announcement by President Donald Trump on Friday, June 6, 2025, who described a preceding 90-minute phone call with Chinese President Xi Jinping as "very positive".
The US delegation included Treasury Secretary Scott Bessent, Commerce Secretary Howard
Lutnick, and US Trade Representative Jamieson Greer, reflecting a coordinated approach to addressing complex trade issues. The talks were primarily aimed at resolving the ongoing bilateral trade war, with a particular focus on tariffs and the global supply of critical rare earth minerals.5 While no specific time for the commencement of talks was provided, it is understood they began during London's daytime, approximately (10:12 CEST / 04:12 EDT).
These discussions occurred in the context of a temporary 90-day agreement reached on May 12, 2025, which had seen the US reduce its tariffs on Chinese imports from 145% to 30%, and China reciprocate by lowering its tariffs on US goods from 125% to 10%.9 However, this temporary truce is set to expire in early August, and President Trump had recently accused China of violating the agreement, specifically regarding critical mineral exports. The broader bilateral relationship remains strained by issues extending beyond tariffs, including restrictions on advanced chips, student visas, and concerns over China's state-dominated economic model.
The prompt scheduling of these high-level talks immediately after a leader-to-leader call suggests a tactical move towards de-escalation of immediate trade tensions, aiming to prevent a full-blown trade war. The objective appears to be managing current conflicts rather than achieving a fundamental resolution, especially with the May 12 agreement nearing its expiration. The core disputes, such as control over rare earths and technology, are deeply entrenched and reflect a broader geopolitical competition rather than mere economic disagreements. This pattern of temporary de-escalation followed by persistent underlying tensions indicates a long-term,structural competition. It suggests that trade policy is increasingly intertwined with national security and geopolitical strategy, implying that businesses should anticipate continued volatility and strategic decoupling in certain sectors, rather than a return to pre-trade war normalcy.
Other big movers for gold will be the US inflation reports. 💥
📅 Wednesday, June 11 (14:30 CEST / 08:30 EDT):
We get the crucial US Consumer Price Index (CPI) data.
Watch for Core CPI (YoY) with a forecast of 2.9% and headline CPI (YoY) at 2.5%.
📅 Thursday, June 12 (14:30 CEST / 08:30 EDT):
The US Producer Price Index (PPI) follows.
Forecasts are for Core PPI (YoY) at 3.0% and headline PPI (YoY) at 2.6%.
📊 These numbers are critical. If inflation comes in hotter 🔥 than expected, it will likely strengthen the US Dollar 💵 and push real interest rates higher 📈, making gold less attractive. This could trigger further declines 📉, especially given the current market structure. Conversely, cooler 🧊 inflation could spark a significant rebound 🔄.
Beyond US data, keep an eye 👁️ on speeches from various European Central Bank (ECB) officials throughout the week, including President Lagarde on Tuesday (23:15 CEST / 17:15 EDT). Their collective tone 🎤 could influence EUR/USD dynamics and indirectly impact the US Dollar Index, offering a counterbalance ⚖️ or amplification to gold's movements.
Key Numbers and Technical Levels to Watch:
Gold is currently sitting on a substantial speculative net long position of 187.9K contracts. This is a massive amount of bullish bets 📊🐂, making gold highly vulnerable to rapid liquidation 💣 if the fundamental picture turns sour. A "long squeeze" could amplify any downside move.
Immediate Support: The 3,300 level is paramount. A decisive break below it would signal further weakness. Below that, 3,250 is strong technical support where we saw a bounce previously.
Overhead Resistance: Look for resistance at 3,350-3,360, and then the recent peak of 3,420. Reclaiming these levels would require a significant shift in sentiment.
Expect high volatility ⚡, especially around the US inflation releases. Trade smart 🧠, manage your risk ⚖️, and stay nimble! 🏃
Geopolitical News Landscape 🌍
India / Pakistan
The ceasefire from May 10 is holding, but diplomatic relations remain frosty. India has launched a global image campaign to gain support, while Pakistan insists on dialogue and accountability.
Outlook: Without substantial agreements on border terrorism and water issues, tensions will stay latently high, with potential for new escalation risks. ⚠️
Gaza Conflict
Violence escalated again in early June. Israel intensified attacks, killing civilians seeking aid in Gaza City, and at least six people were killed at a distribution point.
Outlook: The humanitarian situation continues to worsen 🚨, and international mediation efforts are urgently needed. However, an immediate ceasefire seems unrealistic. ❌
Russia / Ukraine
In the first week of June, Russia launched one of its largest series of attacks: hundreds of drones and missiles hit Kharkiv and Kyiv, resulting in civilian casualties. Simultaneously, a planned prisoner exchange has stalled.
Outlook: Strategic air attacks will likely continue 💥, and the prisoner exchange remains deadlocked. Without a diplomatic initiative, the conflict will stay entrenched. 🕳️
U.S.–China Trade War
Following talks between Trump and Xi, new negotiation rounds are expected in London. China has opened up rare earth exports, a sign of cautious de-escalation.
Outlook: If dialogue channels open 🗣️, systemic trust could grow, but genuine reforms remain uncertain. 🤔
🌐 Global Trade War
The OECD has lowered its growth outlook to 2.9%, warning of protectionism 🧱 and delayed investments. The ECB is also maintaining synchronization with the FED.
Outlook: Without de-escalation, the world faces a global economic slowdown 🐌 and permanent fragmentation of supply chains. 🔗
🏛 Trump vs. Powell
Trump has again complained about the FOMC's hesitancy, nicknaming Powell “Too Late,” and demanding a full 1% interest rate cut.
Outlook: Pressure is mounting 📣. Whether the Fed yields depends on if inflation and labor data allow for a loose policy. 🎯
💵 U.S. Inflation – May 2025
Forward-looking data shows a weakening services sector and consumer prices rising again as tariffs pass through. Official CPI data for May 2025 will be released on June 11.
Outlook: Higher inflation could halt the Fed's "dereflexion" course — a dilemma ⚖️ between growth 📈 and price stability. 🛑
Technical View 📐
Regarding the major Head and Shoulders (H&S) reversal pattern on the 4H chart I shared previously, I'd like to explain some new developments that are altering its potential outcome.
Since the price has re-entered and fallen below the neckline, I activated my "second brain cell" 🧠 to guess what could be next. This led me to revise the larger 4-hour chart structure with the adjustments shown in the accompanying image.
As you can also see in the updated version below, a reversed H&S pattern remains a possibility, as the proportions still appear valid. 🔄
Potential Scenarios for Gold 🧩
Under this revised idea, Gold could potentially reach the neckline entry at 3397 (+88) from the current price. This is one plausible scenario. ✅
Alternatively, the price could drop further to the "Head" at 3120 (-191 from the current 3309), which would, of course, invalidate this H&S pattern. ❗
While this is speculative 🔮, given that trading often involves psychological movements and their resulting impacts, I believe this is a favorable approach to forecasting.
Another reason to see it as bullish is the formed standard bull flag 🚩🐂.
Please take the time to let me know what you think about this. 💬
-------------------------------------------------------------------------
This is just my personal market idea and not financial advice! 📢 Trading gold and other financial instruments carries risks – only invest what you can afford to lose. Always do your own analysis, use solid risk management, and trade responsibly.
Good luck and safe trading! 🚀📊

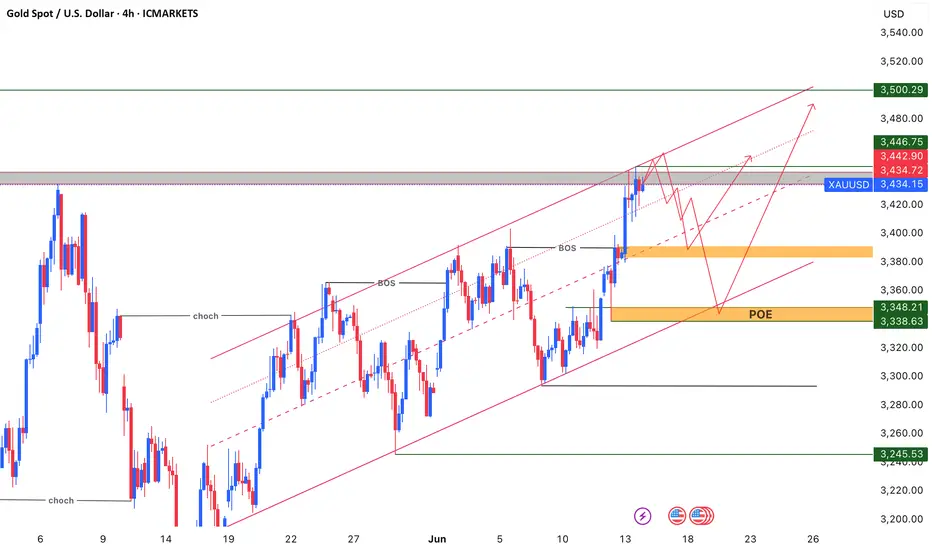
XAUUSDXAUUSD (Gold Spot/USD) based on the provided chart data:
Key Data:
Current Price: 3,434.15 USD (+0.12%)
Recent Range: 3,420–3,440 (consolidation zone)
Critical Levels:
Resistance: 3,440 → 3,442.30 → 3,500+
Support: 3,420 → 3,400 → 3,380
Volume: 32.62K (+1.40% increase)
Trading Plan:
1. Neutral Stance (Wait for Confirmation)
Price is trapped in a tight range. No clear trend → High risk of false breakouts.
2. Buy Signal (If Confirmed)
Trigger: Sustained breakout above 3,440 (close > 3,442.30 reinforces validity).
Target: 3,460 → 3,480 → 3,500.
Stop-Loss: Below 3,430 (or 3,425 for tighter risk).
3. Sell Signal (If Confirmed)
Trigger: Breakdown below 3,420 (close < 3,418.00).
Target: 3,400 → 3,380 → 3,360.
Stop-Loss: Above 3,435 (or 3,440 for aggressive entries).
Critical Risk Notes:
✅ Tight Stops Essential: Use 5-10 point SLs (volatility risk).
✅ Volume Check: Only trade breakouts with rising volume.
✅ POE Alert: The Point of Control (POE) at 3,338.63 hints at deeper downside potential if 3,420 breaks.
❌ Avoid Forced Trades: No trade > low-risk opportunity.
Why This Approach?
Gold is testing mid-range levels after a minor uptick. Without a decisive move above 3,440 (bullish) or below 3,420 (bearish), patience is optimal. Monitor for:
U.S. dollar strength & Fed policy cues.
Geopolitical/news triggers (gold is sensitive to risk sentiment).
Final Call: 🟡 Wait for 3,420 or 3,440 break before acting.
Stay disciplined! 🚦
Hidden Bullish Divergence on Bigger tf.HTL Closed at 44.65 (13-05-2025)
Hidden Bullish Divergence on Bigger tf.
If 41 is not Broken, we may witness
upside towards 46.50 - 47 & then
50 to 55.

Falling towards major support level?NZD/USD is falling towards the support level which is an overlap support that aligns with the 78.6% Fibonacci projection and also slightly above the 127.2% Fibonacci extension and could bounce from this level to our take profit.
Entry: 0.5987
Why we like it:
There is an overlap support level that is slightly above the 127.2% Fibonacci extension and the also lines up with the 78.6% Fibonacci projection.
Stop loss: 0.5951
Why we like it:
There is a pullback support level.
Take profit: 0.6037
Why we like it:
There is a pullback resistance.
Enjoying your TradingView experience? Review us!
Please be advised that the information presented on TradingView is provided to Vantage (‘Vantage Global Limited’, ‘we’) by a third-party provider (‘Everest Fortune Group’). Please be reminded that you are solely responsible for the trading decisions on your account. There is a very high degree of risk involved in trading. Any information and/or content is intended entirely for research, educational and informational purposes only and does not constitute investment or consultation advice or investment strategy. The information is not tailored to the investment needs of any specific person and therefore does not involve a consideration of any of the investment objectives, financial situation or needs of any viewer that may receive it. Kindly also note that past performance is not a reliable indicator of future results. Actual results may differ materially from those anticipated in forward-looking or past performance statements. We assume no liability as to the accuracy or completeness of any of the information and/or content provided herein and the Company cannot be held responsible for any omission, mistake nor for any loss or damage including without limitation to any loss of profit which may arise from reliance on any information supplied by Everest Fortune Group.

Potential bearish drop?AUD/USD has reacted off the resistance level which is a pullback resistance and could drop from this level to our take profit.
Entry: 0.6498
Why we like it:
There is a pullback resistance level.
Stop loss: 0.6519
Why we like it:
There is a pullback resistance level.
Take profit: 0.6468
Why we like it:
There is a pullback support that is slightly above the 61.8% Fibonacci projection.
Enjoying your TradingView experience? Review us!
Please be advised that the information presented on TradingView is provided to Vantage (‘Vantage Global Limited’, ‘we’) by a third-party provider (‘Everest Fortune Group’). Please be reminded that you are solely responsible for the trading decisions on your account. There is a very high degree of risk involved in trading. Any information and/or content is intended entirely for research, educational and informational purposes only and does not constitute investment or consultation advice or investment strategy. The information is not tailored to the investment needs of any specific person and therefore does not involve a consideration of any of the investment objectives, financial situation or needs of any viewer that may receive it. Kindly also note that past performance is not a reliable indicator of future results. Actual results may differ materially from those anticipated in forward-looking or past performance statements. We assume no liability as to the accuracy or completeness of any of the information and/or content provided herein and the Company cannot be held responsible for any omission, mistake nor for any loss or damage including without limitation to any loss of profit which may arise from reliance on any information supplied by Everest Fortune Group.

Bullish bounce off 61.8% Fibonacci support?USD/JPY is falling towards the support level which is a pullback support that aligns with the 61.8% Fibonacci retracement and could bounce from this level to our take profit.
Entry: 143.43
Why we like it:
There is a pullback support level that aligns with the 61.8% Fibonacci retracement.
Stop loss: 142.88
Why we like it
There is a pullback support level that lines up with the 61.8% Fibonacci projection.
Take profit: 144.38
Why we like it:
There is an overlap resistance level.
Enjoying your TradingView experience? Review us!
Please be advised that the information presented on TradingView is provided to Vantage (‘Vantage Global Limited’, ‘we’) by a third-party provider (‘Everest Fortune Group’). Please be reminded that you are solely responsible for the trading decisions on your account. There is a very high degree of risk involved in trading. Any information and/or content is intended entirely for research, educational and informational purposes only and does not constitute investment or consultation advice or investment strategy. The information is not tailored to the investment needs of any specific person and therefore does not involve a consideration of any of the investment objectives, financial situation or needs of any viewer that may receive it. Kindly also note that past performance is not a reliable indicator of future results. Actual results may differ materially from those anticipated in forward-looking or past performance statements. We assume no liability as to the accuracy or completeness of any of the information and/or content provided herein and the Company cannot be held responsible for any omission, mistake nor for any loss or damage including without limitation to any loss of profit which may arise from reliance on any information supplied by Everest Fortune Group.

Extremely Bullish.Closed at 281.50 (05-06-2025)
Extremely Bullish.
But 289 - 290 is an Important Resistance.
Needs to cross & sustain 295 - 308 Zone for
further upside.
as mentioned in yesterday's video, 277 - 279
may act as Support.
Breaking 272 will bring more selling pressure.

#CADJPY:1700+ PIPS Swing Concept On The Way,Three Profit TargetsJPY initiated a bearish trend and anticipates a rapid reversal in all JPY pairs, such as CADJPY. We expect a significant swing move, potentially reaching 2000+ pips in the long term. Additionally, we have set three targets based on our analysis, which can aid in identifying potential trade opportunities. Good luck and trade safely.
Good luck and trade safely.
Thanks for your support! 😊
If you want to help us out, here are a few things you can do:
- Like our ideas
- Comment on our ideas
- Share our ideas
Team Setupsfx_
❤️🚀

Bullish bounce off pullback support?USD/CHF is falling towards the support level which is a pullback support and could bounce from this level to our take profit.
Entry: 0.8066
Why we like it:
There is a pullback support.
Stop loss: 0.8031
Why we like it:
There is a support level at the 61% Fibonacci projection and the 127.2% Fibonacci extension.
Take profit: 0.8157
Why we lik eit:
There is an overlap resistance level.
Enjoying your TradingView experience? Review us!
Please be advised that the information presented on TradingView is provided to Vantage (‘Vantage Global Limited’, ‘we’) by a third-party provider (‘Everest Fortune Group’). Please be reminded that you are solely responsible for the trading decisions on your account. There is a very high degree of risk involved in trading. Any information and/or content is intended entirely for research, educational and informational purposes only and does not constitute investment or consultation advice or investment strategy. The information is not tailored to the investment needs of any specific person and therefore does not involve a consideration of any of the investment objectives, financial situation or needs of any viewer that may receive it. Kindly also note that past performance is not a reliable indicator of future results. Actual results may differ materially from those anticipated in forward-looking or past performance statements. We assume no liability as to the accuracy or completeness of any of the information and/or content provided herein and the Company cannot be held responsible for any omission, mistake nor for any loss or damage including without limitation to any loss of profit which may arise from reliance on any information supplied by Everest Fortune Group.

Bearish continuation?USD/CAD has rejected off the resistance level which is a pullback resistance and could drop from this level to our take profit.
Entry: 1.3595
Why we like it:
There is a pullback resistance level.
Stop loss: 1.3644
Why we like it:
There is an overlap resistance level that aligns with the 50% Fibonacci retracement.
Take profit: 1.3545
Why we like it:
There is a support level at the 100% and the 78.6% Fibonacci projection.
Enjoying your TradingView experience? Review us!
Please be advised that the information presented on TradingView is provided to Vantage (‘Vantage Global Limited’, ‘we’) by a third-party provider (‘Everest Fortune Group’). Please be reminded that you are solely responsible for the trading decisions on your account. There is a very high degree of risk involved in trading. Any information and/or content is intended entirely for research, educational and informational purposes only and does not constitute investment or consultation advice or investment strategy. The information is not tailored to the investment needs of any specific person and therefore does not involve a consideration of any of the investment objectives, financial situation or needs of any viewer that may receive it. Kindly also note that past performance is not a reliable indicator of future results. Actual results may differ materially from those anticipated in forward-looking or past performance statements. We assume no liability as to the accuracy or completeness of any of the information and/or content provided herein and the Company cannot be held responsible for any omission, mistake nor for any loss or damage including without limitation to any loss of profit which may arise from reliance on any information supplied by Everest Fortune Group.

GBPUSD | 2 Long Scenarios | The Empire will strike backGeneral
GBPUSD fell through the first big support zone (Zone 2) unless a reclaim i am not gonna look for longs currently. Personally waiting for price falling deeper into Zone 1. Marked 2 Scenarios that i would want to see to develop.
Be aware that i usually use LTF (such as the 1 hour chart to plan my entries). Meaning the SLs and RR are not completly correct as shown.
1. Long (Green arrow)
Price moves below Zone 1. Reclaim. Enter on reclaim.
Target: Slightly below Zone 3
Stop- Loss: Depending on the LTF entry i wouldnt want to see it going below Zone 1 again
Time duration: Days, weeks, months, years... ;)
2. Long (Orange arrow)
Price pushes into Zone 1, reacts supportive and then generates a Swing. Enter on breaking of the generated swing.
Target: Slightly below Zone 3
Stop- Loss: A bit below of top of the Zone 1
Time duration: Days, weeks, months, years... ;)
Good luck
Disclaimer:
- This information does not constitute as financial advice and is only for educational purposes. I am not your financial advisor.
- You trade entirely at your own risk
- Make your own research
- Finance and trading is evil, capitalism is bad, duh ;)

SOLUSDT Forming Bullish FlagSOLUSDT is currently forming a classic bullish flag pattern on the chart, which is often seen as a continuation pattern indicating the potential for a strong breakout to the upside. The price has consolidated within a tight range following a significant upward move, creating a flag-shaped formation that typically precedes the next wave higher. This structure is being supported by solid volume behavior, which is an essential confirmation for bullish breakouts. Based on historical performance and technical projections, a 50% to 60% gain could be on the horizon if this pattern resolves upward.
Solana (SOL) has remained one of the strongest-performing layer-1 blockchain projects in the market, and current investor sentiment is highly favorable. With recent developments in its ecosystem and increased institutional interest, SOL continues to attract substantial inflows. The bullish flag pattern aligns perfectly with the broader market optimism and technical indicators such as RSI and MACD that are showing early signs of renewed momentum.
Traders should watch closely for a breakout above the flag's resistance line, as this could trigger a new wave of buying pressure. Key levels to monitor include the breakout point and potential price targets around the previous highs and Fibonacci extensions. The market structure remains bullish, and if confirmed by volume and market momentum, SOLUSDT may offer one of the most attractive risk-reward setups in the current crypto landscape.
In summary, SOLUSDT is technically poised for another rally, supported by a bullish flag and growing interest from both retail and institutional investors. With a favorable risk profile and strong fundamentals, this is a setup that many traders will be watching in the coming days.
✅ Show your support by hitting the like button and
✅ Leaving a comment below! (What is You opinion about this Coin)
Your feedback and engagement keep me inspired to share more insightful market analysis with you!

JTOUSDT Forming Bullish WaveJTOUSDT is currently shaping a promising bullish wave pattern, signaling potential continuation of an upward trend in the coming days or weeks. This wave formation is often associated with renewed buying interest and signals that price action is building strong momentum for another leg higher. Coupled with a steady increase in trading volume, the technical structure suggests that the asset may soon experience a substantial breakout. Based on historical wave behavior and key support/resistance levels, an expected gain of 50% to 60% appears realistic.
Market interest around JTO has been growing, with investors closely watching its price behavior as it consolidates above recent lows. This consolidation phase is often a prelude to significant rallies, especially when backed by solid wave structure and volume confirmation. As more liquidity enters the market, JTOUSDT is positioned to attract both swing traders and long-term holders seeking medium-risk, high-reward opportunities.
From a technical perspective, the coin is forming higher lows while testing critical resistance zones. If it manages to clear those levels with conviction, price targets could range between the upper Fibonacci extensions and prior distribution zones. The growing market chatter and improving sentiment around the JTO project further support the bullish thesis.
Keep an eye on upcoming market catalysts and macro trends, as they could amplify the bullish momentum already forming on the JTOUSDT chart. With a disciplined approach, this could become one of the standout performers in the mid-cap altcoin segment in the near term.
✅ Show your support by hitting the like button and
✅ Leaving a comment below! (What is You opinion about this Coin)
Your feedback and engagement keep me inspired to share more insightful market analysis with you!

GBPUSD NEW WEEK OUTLOOK BULLISH TREEND 15/6/2025buy 1.35600 1.35300
tp 1.35800
tp 1.36000
tp 1.36200
sl 1.34800

THEUSDT Forming Falling Wedge BullishTHEUSDT is showcasing a strong technical breakout from a falling wedge pattern, a formation widely regarded as bullish in the world of crypto trading. This structure typically signals the end of a downtrend and the potential start of a strong upward movement. With price action now breaching the wedge’s upper resistance line and confirming bullish momentum, this breakout opens up the possibility for an explosive rally. Current projections point to a potential gain of 90% to 100%+, making it one of the more attractive setups among altcoins.
The volume is also confirming the breakout, suggesting that traders and investors are actively entering positions. This increase in participation often fuels further upward movement, especially when combined with a technically significant chart pattern like this. THEUSDT is not only displaying strength on the technical side, but also showing promising signals from investor sentiment, with more eyes turning toward this project across social platforms.
Price targets for this setup are derived from the height of the wedge and historical resistance zones. As seen in the chart, the upside potential could push THEUSDT toward the $0.50–$0.65 range, where previous liquidity zones may come into play. With altcoins heating up and capital rotating into high-upside plays, THEUSDT’s setup offers an excellent risk-to-reward profile at this stage.
Traders should monitor volume continuation and possible retests of the breakout zone as confirmation. With the broader market recovering and interest returning to promising altcoins, THEUSDT stands out as a potential leader in the next bullish wave.
✅ Show your support by hitting the like button and
✅ Leaving a comment below! (What is You opinion about this Coin)
Your feedback and engagement keep me inspired to share more insightful market analysis with you!

ARPAUSDT Forming Falling WedgeARPAUSDT is currently presenting a classic falling wedge pattern, which is widely recognized as a bullish reversal formation in technical analysis. This setup suggests that the recent downtrend may be losing momentum, with lower highs and lower lows converging toward a breakout point. The narrowing wedge, combined with consistent volume, indicates that a strong move could be imminent once resistance is broken. Based on the structure and historical behavior, traders are eyeing a potential gain in the range of 80% to 90%+ in the upcoming sessions.
The volume profile remains healthy, reflecting strong investor interest and growing participation around these price levels. This is often a precursor to breakout rallies, especially when the broader market sentiment is shifting toward altcoins. The wedge pattern, if confirmed by a breakout above the resistance line with strong bullish candles, could trigger a significant upside momentum as technical traders and algorithms enter long positions.
ARPAUSDT also benefits from strong community backing and increasing mentions across social and trading platforms, signaling that sentiment is tilting positive. With fundamentals aligning and technicals pointing to a breakout, this pair stands out among mid-cap altcoins for traders looking for potential explosive setups. Key levels to watch include the breakout point and subsequent resistance zones, which, if cleared, may lead to a sustained bullish move.
As the pattern develops and market dynamics unfold, ARPAUSDT could become one of the more attractive opportunities in the short term. Be prepared for increased volatility and monitor the breakout closely for confirmation.
✅ Show your support by hitting the like button and
✅ Leaving a comment below! (What is You opinion about this Coin)
Your feedback and engagement keep me inspired to share more insightful market analysis with you!

DUSDT Forming Falling WedgeDUSDT is displaying a well-defined falling wedge pattern, which typically signals a strong bullish reversal once a breakout occurs. The structure of this chart suggests that selling momentum is waning while accumulation is gradually increasing. A breakout above the upper resistance of the wedge can unlock a sharp upside move, with a target gain in the range of 90% to 100%+. This projection is consistent with historical price behavior following similar wedge formations.
Volume remains steady, a critical sign that smart money may be quietly building positions before a potential breakout. Technically, DUSDT is positioned at the final stage of the wedge structure, and traders are watching closely for a confirmation candle that could validate the bullish setup. If momentum carries forward, the next resistance levels could be broken swiftly, leading to a fast rally as short positions unwind and new buyers step in.
Investor sentiment toward this project is showing renewed strength, with increasing chatter on social platforms and consistent mentions in altcoin analysis circles. The asset remains underpriced relative to its potential, attracting speculative interest from traders looking for high upside opportunities in smaller-cap pairs.
With bullish technicals aligning and market conditions favoring risk-on plays, DUSDT is worth watching closely. A confirmed breakout could trigger a substantial trend reversal in the coming sessions.
✅ Show your support by hitting the like button and
✅ Leaving a comment below! (What is You opinion about this Coin)
Your feedback and engagement keep me inspired to share more insightful market analysis with you!

WIF 4H. Make or Break ZoneBINANCE:WIFUSDT The asset is still moving within a defined range and is now brushing against the lower boundary of its structure. This area has historically triggered buyer interest — and if that repeats, we could be looking at a recovery toward $0.97+ in the short term.
However, failure to defend this support could send price cascading down to the $0.58–$0.60 zone.
Given the ongoing uncertainty in global markets, especially due to rising geopolitical tension, any long positions should be executed with tight risk management and a hard stop-loss.
Entry range (EP):
• Market
• $0.8120
• $0.7790
Take-Profit targets (TP):
• $0.8880
• $0.9425
• $0.9765
I’m managing risk carefully and limiting exposure per trade to no more than 2% of my portfolio. This is my personal trading log and not financial advice — always DYOR and trade responsibly.
Let the market decide — I'm prepared either way.
Stay sharp. Stay safe. 🧠📊

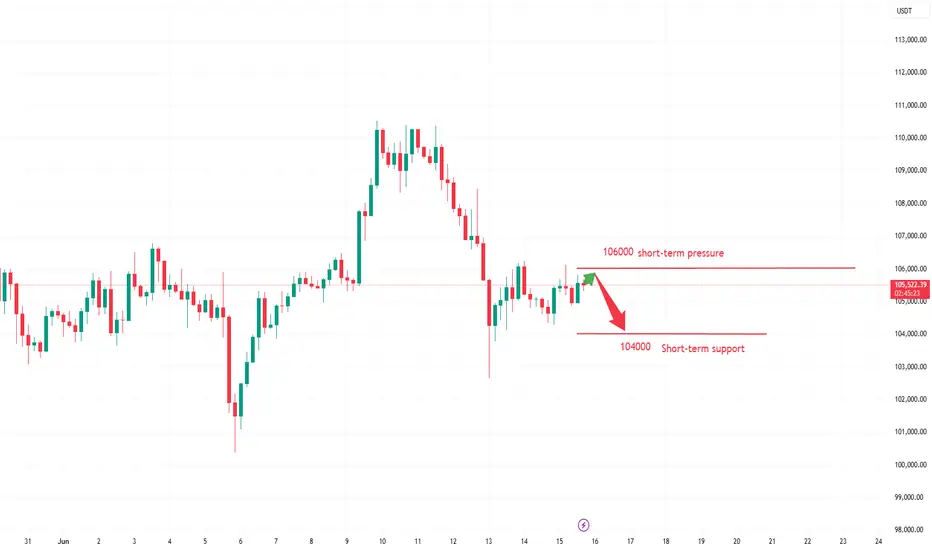
Analysis of Next Week's Market TrendsBitcoin is trading in a narrow range, with an intraday volatility of only 1.7% and trading volume shrinking by 18%, indicating market wait-and-see sentiment after key geopolitical events.
After the Israel-Iran conflict triggered $1 billion in liquidations, market panic has eased. Israel's preemptive strike on Iran on the 13th caused Bitcoin to flash crash to $102,000, but by the 15th, the market had partially digested the risks. The Fear & Greed Index stabilized at 60 (greed zone), showing that funds did not massively flee to safe havens.
Bitcoin is in a critical accumulation phase on the eve of a breakthrough. The digestion of geopolitical risks and institutional buying constitute supporting forces, but short-term attention should be paid to the risk of breakdown in the triangular pattern. It is recommended to strictly guard the defense level of $104,200 and the breakthrough point of $106,300.
Humans need to breathe, and perfect trading is like breathing—maintaining flexibility without needing to trade every market swing. The secret to profitable trading lies in implementing simple rules: repeating simple tasks consistently and enforcing them strictly over the long term.
Trading Strategy:
sell@105900-106000
TP:104000-1045000
EURUSD ||| '' W '' PATTERN IDENTIFIED . ✅ Harmonic Formation (Bearish Potential)
⚠️ Selling Bias forming soon
---
🧩 Pattern Breakdown:
A Bearish Harmonic Pattern (likely Butterfly or Deep Crab) has been identified and is now nearing completion at the D point.
Current price is approaching key resistance / reversal zone, precisely around the 0.786 - 0.886 fib area (highlighted red).
The Risk-to-Reward is clearly mapped:
🔺 Stop Loss: 1.19405
✅ Entry Zone: Around 1.17106
🎯 Target: 1.09588
Potential short setup if price respects the harmonic symmetry and fails to break above resistance.

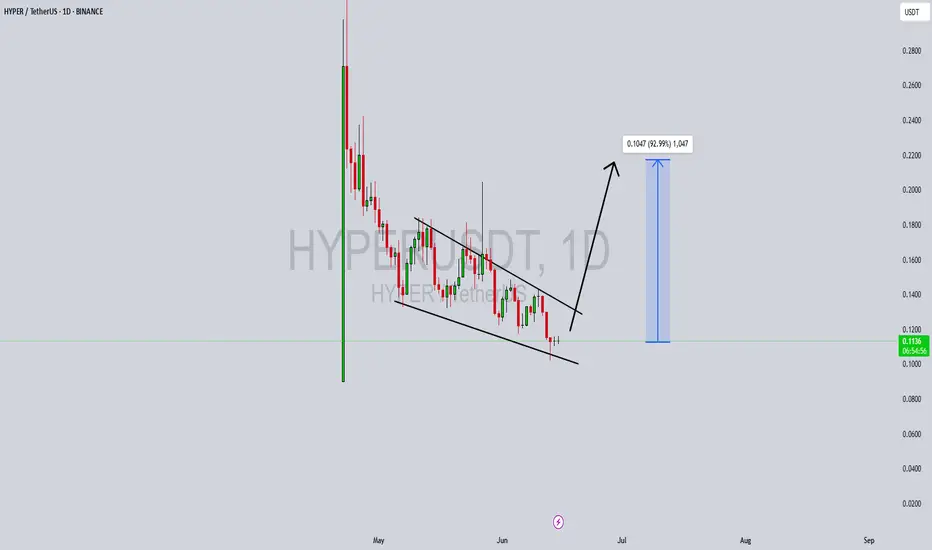
HYPERUSDT Forming Strong Bullish ReversalHYPERUSDT is currently trading within a classic falling wedge pattern — a formation known for signaling strong bullish reversals once a breakout occurs. This structure is typically a sign of seller exhaustion and accumulation by smart money, particularly when accompanied by steady or rising volume, as we see now. With bullish divergence becoming more apparent on momentum indicators, the technical conditions are aligning for a significant price rally.
This setup suggests the potential for an explosive breakout to the upside, with a projected gain range of 80% to 90%+ once the upper resistance of the wedge is decisively breached. The falling wedge is forming at the tail end of a sustained downtrend, which often serves as a base for major upward reversals. A breakout above key resistance could bring a sharp bullish wave, pushing HYPERUSDT back toward previous supply zones and even forming new local highs.
Investor interest in the HYPER project is gaining traction, with increasing mentions across social platforms and a noticeable uptick in trading activity. As new capital flows into smaller-cap altcoins showing promising technicals, HYPER appears to be on many watchlists, especially among swing traders and early-stage investors looking for asymmetric risk/reward setups.
Overall, HYPERUSDT is offering a compelling opportunity based on this pattern. A confirmed breakout from the wedge may trigger strong momentum in the days ahead, particularly as market sentiment leans increasingly risk-on.
✅ Show your support by hitting the like button and
✅ Leaving a comment below! (What is You opinion about this Coin)
Your feedback and engagement keep me inspired to share more insightful market analysis with you!