NIfty SpotVery good resilience shown by Indian Markets amid Global uncertainty.
Iran - Israel war will surely have an impact on opening of the markets tomorrow..
The way the war is continuing all likely hood of opening deep red...tomorrow
Well but i feel taht will be a good opportunity to buy near 24000-23850 Zone... as it is also a previous GAP so all possibility of finding suppport near that level
Have marked important level on chart.
Like... Share... Comment.
Harmonic Patterns

BTCUSD NEW WEEK OUTLOOKS. M30 POSSIBLE TREENDS MARKET BEARISH SISell 106000 106300
take profit 105500
take profit 105000
take profit 105000
stop los 107000

Middle East Tensions Drive Capital Shift: BTC May Test 100K SupCurrently, we can clearly see that BTC is in a downward trend 🔻. Due to the tense situation in the Middle East 😰, a large amount of capital has flowed into gold and crude oil markets. BTCUSD is likely to continue its downward movement on Monday ⬇️. Let's focus on the support level at 100,000. If it breaks below 100,000, it may continue to decline ⚠️.
⚡️⚡️⚡️ BTCUSD ⚡️⚡️⚡️
🚀 Sell@ 106500 - 105500
🚀 TP 102000 - 101000
Accurate signals are updated every day 📈 If you encounter any problems during trading, these signals can serve as your reliable guide 🧭 Feel free to refer to them! I sincerely hope they'll be of great help to you 🌟 👇

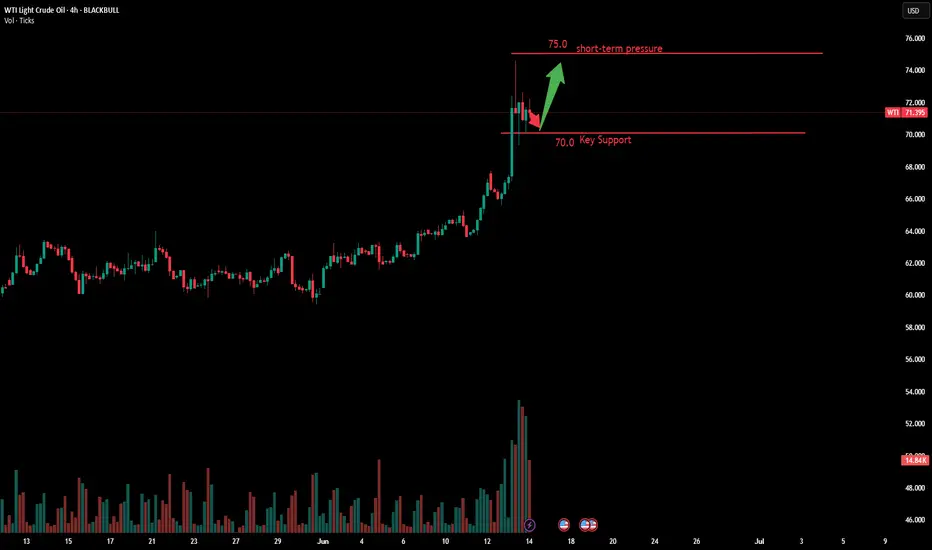
WTI OIL SPOT / Crude Oil SpotCrude has appreciated from 55 odd levels to 73+
In the wake of Iran israel conflict...
Crude is likely to surge higher...
Above 94$ Crude cruising to 102/104 levels in all likelihood.
Have marked important levels on chart for ur perusal
Happy trading
Like...... Share........ and Follow for more updates...

Crude Oil to Continue Breaking Higher HighsMiddle East Tensions Escalate Sharply: Israel Launches Preemptive Strike on Iran, Targeting Nuclear-related Facilities
Iran's state media confirmed that senior Revolutionary Guard leaders were killed in the attack, with nuclear scientists and facilities also suffering heavy damage. In the short term, geopolitical risks will continue to dominate market sentiment. Oil prices are likely to oscillate at high levels or even edge higher. From a daily chart perspective, crude oil's moving average system forms a bullish arrangement, confirming the unchanged short-term objective uptrend. The morning session K-line closes as a large bullish candlestick, aligning with the primary upward trend. The MACD indicator is bullishly diverging above the zero axis, with bullish momentum prevailing. Intraday crude oil is expected to continue breaking higher.
Humans need to breathe, and perfect trading is like breathing—maintaining flexibility without needing to trade every market swing. The secret to profitable trading lies in implementing simple rules: repeating simple tasks consistently and enforcing them strictly over the long term.
Trading Strategy:
buy@70.0-71.0
TP:74.0-75.0
The Critical Resistance of Gold at 3500!
The probability of a higher opening for gold next week is relatively high, but I hold a high degree of skepticism towards its sustainability. After three days of fermentation, relevant parties have exhausted all available measures. If there is a higher opening on Monday, chasing the trend is not recommended. The pressure reference for the market in the early week is at the 3462/72 level. From the perspective of the upward channel trend that started from 3200, as long as it does not gap up directly above 3462/72, even if the price touches this area, it will face certain suppression. If it gaps up strongly above 3472 and has a wave of continuation, the previous high of 3500 will also be difficult to break through - at least from the current technical perspective, an optimistic expectation of breaking through 3500 cannot be formed. The most critical influence next week will still be the Fed's speech on Thursday, and the core time point for whether the market can truly break through 3500 will be at that time.
The key support level next week is viewed at 3400. The current price has broken through and stabilized above 3400, and it is expected to operate above this level for a period of time. When the market first pulls back to test around 3400, buying can be continued. Through cycle operation judgment, a high-level consolidation market in the 3500/3400 range is highly likely to form
Humans need to breathe, and perfect trading is like breathing—maintaining flexibility without needing to trade every market swing. The secret to profitable trading lies in implementing simple rules: repeating simple tasks consistently and enforcing them strictly over the long term.
Trading Strategy:
buy@3410-3420
TP:3460-3470

USDJPY Bearish WeekThis is is USDJPY going into the new week. Last week we saw sharp declination in USD price especially after the inflation news. Price may rise a little to create Weekly highs and continue to fall

BTC Trading in a Range.Support & Resistance Levels:
R1: ~106,300
R2: ~109,000
R3: ~111,600
S1: ~102,800
S2: ~100,000
Bearish RSI Divergence
Price made higher highs earlier (around June 10-11).
RSI made lower highs, indicating bearish divergence.
Price Action
BTC bounced back from below S1 (~102,800) and is now hovering around R1 (~106,300).
If it breaks and sustains above R1, we could see a move toward R2 (109k).
However, failure at R1 can lead to a pullback to S1 or S2 levels.
Strategy Suggestions:
📌 If Bullish:
Wait for a clean breakout above R1 (~106,300) with volume.
Potential targets: R2 (109k) and R3 (111.6k).
📌 If Bearish:
If price fails to hold R1 and rejects, consider short opportunities.
Targets would be: S1 (102.8k) and S2 (100k).
Keep an eye on RSI — if it forms another divergence or crosses down the MA, bearish bias increases.
⚠️ Risk Factors:
BTC is still within a consolidation range between R1 and S1.
No clear breakout yet; be cautious with position sizing.
Watch for macroeconomic news/events, as they can spike volatility.

GBPAUD BearishUpon examining the daily chart for GBPAUD, the outlook appears to be bearish, bolstered by the presence of bearish butterfly harmonics that affirm this trend. As I assess the market conditions for the coming week, I am contemplating entering a short position.
For this trade, I am setting my take-profit levels as follows:
- TP1 at 2.06
- TP2 at 2.05
- TP3 at 2.03
To manage risk, I will place my stop-loss at 2.11. This strategy aims to capitalize on the anticipated downward movement while safeguarding against potential reversals.

Potential Sell Opportunity on GBPCADReasons I think this pair will fall:
-Price printed a lower high on a confirmed trend line on the H4 which is a sign of momentum loss.
- RSI Daily reading below 50 line
- Bearish RSI Divergence on H4
What do you think?

SPX500 BUYGreeting there traders this is my analysis on
📊 S&P 500 – Potential Elliott Wave 3 Formation | Long Setup
The current 4H chart of the S&P 500 suggests a potential bullish continuation based on Elliott Wave Theory. Here's the structured breakdown:
🔹 Wave 1: Initiated after a failed breakout and sharp reversal from a previous resistance zone. This impulsive move marked a key shift in trend structure.
🔹 Wave 2: A corrective phase followed, consolidating near the support area (~5,915), respecting previous demand.
🔹 Current Price Action: Price has broken above the minor resistance at 6,000, indicating the potential beginning of Wave 3, which is typically the strongest and most extended wave in the sequence.
📈 Trade Setup:
Entry: Above 6,000 (confirmation of breakout and wave continuation)
Stop Loss: Below 5,915 (invalidates bullish structure if broken)
Target Zone: 6,167 – 6,170 (aligned with prior resistance and wave projection)
🔍 Additional Notes:
The breakout is supported by a clean structure and rejection from key support.
Ideal scenario would involve increasing volume and continuation with higher highs and higher lows.
📌 Bias: Bullish – targeting Wave 3 extension.
⚠️ Always manage risk accordingly and watch for signs of exhaustion or divergence.
Dear Traders like,comment let me know what do you think?

XAUUSD LONG ITGreetings traders this is my analysis on XAUUSD and it is Long
🧠 Technical Breakdown:
Head & Shoulders Formation:
A clear Head and Shoulders pattern is visible, with:
Left Shoulder forming around April 14–15,
Head peaking on April 18–19,
Right Shoulder forming April 23–24.
This is a classic bearish reversal pattern, which played out as expected.
Elliot Wave Structure:
An Elliot Wave impulse followed by a corrective wave appeared right after the head formation.
The market then entered a downtrend, completing a retracement toward the support zone (3172).
Previous Idea Target Hit:
The price reached the previous target area, confirming the validity of earlier projections (noted in blue rectangle on May 7).
Current Market Structure:
After bouncing from support, the market entered a consolidation phase (early June), signaling indecision.
A short-term dip toward the minor support at 3290 is possible before a projected bullish move.
🔮 Forecast:
Expect a short-term pullback to the support zone around 3290.
If buyers step in at that level, we could see a bullish continuation toward the resistance/target level of 3441.
Confirmation will depend on how price reacts at the minor support and if a breakout from consolidation occurs.
🛠️ Key Levels to Watch:
Support Levels:
🔴 3172 (Major)
🔵 3290 (Minor – Potential bounce zone)
Resistance/Target:
🟢 3441 (Target from consolidation breakout)
✅ Trade Plan (Not Financial Advice):
Bullish Scenario: Look for bullish reversal candlesticks at 3290 for long entries.
Bearish Scenario: A break below 3290 invalidates the idea — watch for potential retest of 3172.
Dear Traders like,comment let me know what do you think?

Chart Breakdown – GOLD (4H) KEY LEVEL TO WHATCH AND WHY Hello traders!
It’s been a while since our last market update — I’ve been tied up working on a few exciting projects behind the scenes. But let’s dive straight into the action with a fresh look at GOLD for this week.
🔍 Chart Breakdown – GOLD (4H)
We’ve been tracking a Double Drive Bullish setup that activated from the Entry Level at 3177.11, and since then, price has unfolded a sequence of high-probability structures:
✅ ABC bullish continuation
✅ Multiple Double Drive formations
✅ A clean 121 Bullish Symmetry Pattern
✅ Rectangular Channel breakout
✅ Local Head & Shoulders bottom
As expected, price found support near the 78.6% retracement at 3308, which was also the final wall of the last 121 structure. From there, GOLD pushed impulsively and is now trading at 3432.
🟩 Key Level to Watch: 3432.50
This is our pivot. If price holds this zone, we may be setting up for an extension move — potentially toward:
🔹 61.8% Extension –
🔹 78.6% Extension –
🔹 100% 121 target – full symmetry alignment and major exhaustion zone
📈 Summary:
We’re in a continuation structure with bullish pressure building. GOLD is respecting all key reversal structures and fib symmetry so far. As long as 3432.50 holds, we’re eyeing new highs — with the potential to challenge ATH zones through the layered completion targets above.
Let’s keep our focus sharp, manage risk like pros, and trade with discipline.
Stay tuned for real-time updates and new pattern alerts throughout the week.
— Trade Chart Patterns Like The Pros

XAUUSD BULLISH OR BEARISH DETAILED ANALYSISGold (XAUUSD) continues to maintain strong bullish momentum, with current price action sitting around 3,430. We have been holding a bullish outlook since the key accumulation zone between 3,150 and 3,200. Price has consistently formed higher highs and higher lows, and recent consolidation has broken out with conviction. Based on technical structure, my immediate upside target is 3,500, where I expect price to react before potentially extending even higher depending on upcoming macro drivers.
Fundamentally, gold is being fueled by a combination of sticky inflation data and a cautious Fed stance. Even though the FOMC held rates steady in June, market expectations are shifting towards policy easing later in the year due to softening labor data and a cooling economic outlook. Additionally, geopolitical uncertainties and continued central bank gold buying remain strong tailwinds for the metal. The U.S. dollar index has shown minor weakness post-CPI, offering further support to gold bulls.
Technically, the daily chart shows a clean bullish flag breakout that aligns with the trendline support and impulsive wave structure. Price broke above 3,400 with strong volume and minimal resistance, indicating clear bullish dominance. As long as price holds above the 3,380–3,400 zone, continuation toward 3,500 remains highly probable. There is also confluence from previous structure highs and minor Fibonacci extension levels around that mark.
Overall, I remain confidently long on XAUUSD. I’ve been tracking this bullish cycle since the 3,150–3,200 region and continue to favor upside moves backed by macroeconomic and technical alignment. I’ll be watching key reaction zones near 3,500 for potential profit-taking, while holding swing positions with dynamic risk management in place.

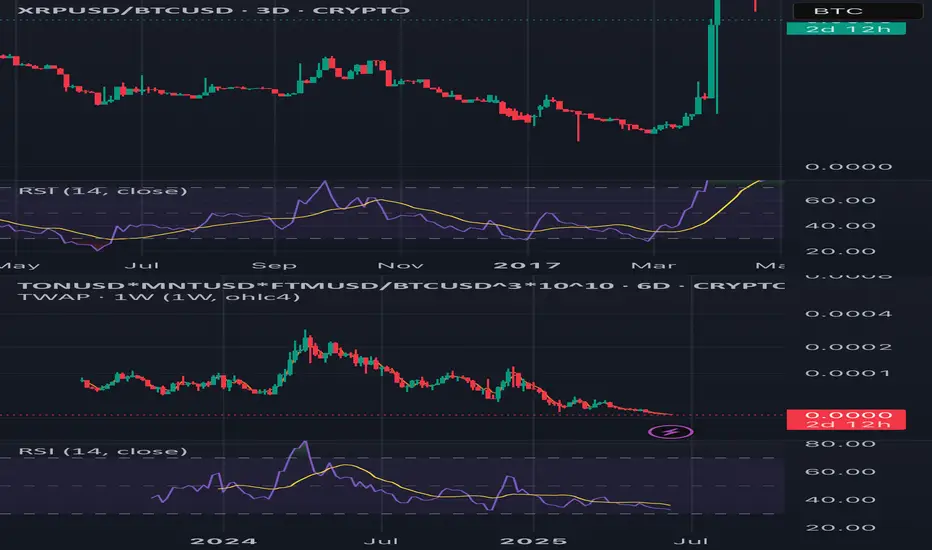
Mantle, Toncoin, Fantom/SonicAn ungodly chart that could outperform market soon as did xrp in 2017. Add to that, chain link and Uniswap.
US100Correlation Between US100 (Nasdaq 100), 10-Year Bond Yield, and Bond Prices
1. Relationship Between 10-Year Treasury Bond Yield and Bond Prices
Inverse Relationship:
Bond prices and yields move inversely. When the 10-year Treasury yield rises, bond prices fall, and vice versa. This is because the fixed coupon payments become less attractive when yields increase, causing existing bond prices to drop to offer comparable yields to new issues.
Current Data (June 13, 2025):
10-Year Treasury yield is around 4.40%, with the bond price near 98.81 (below par), reflecting recent yield increases.
Term Premium:
The term premium on the 10-year Treasury has risen sharply since early April 2025, reaching the highest level in over a decade. This premium compensates investors for risks that short-term yields may not evolve as expected, keeping long-term yields elevated and bond prices suppressed.
2. US100 (Nasdaq 100) and 10-Year Treasury Yield Correlation
Negative Correlation Generally Observed:
The Nasdaq 100 (US100), a tech-heavy equity index, often shows a negative correlation with 10-year Treasury yields. When yields rise, borrowing costs increase, discount rates for future earnings rise, and equities—especially growth stocks—tend to decline. Conversely, falling yields often boost equities.
Recent Trends:
In 2025, rising yields have put pressure on equities, including the Nasdaq 100, as investors demand higher returns from riskier assets. However, periods of yield stabilization or decline can support equity rallies.
Risk Sentiment:
The correlation can vary with market sentiment; during risk-off episodes, both equities and bond yields may fall as investors flock to safety.
3. US100 and Bond Prices
Indirect Relationship via Yields:
Since bond prices move inversely to yields, and yields often move inversely to equities, bond prices and equities like US100 often show a positive correlation in risk-off environments (both falling) and a negative correlation in risk-on environments (equities rising, bond prices falling).
Safe-Haven Demand:
In times of market stress, investors may sell equities and buy bonds, pushing bond prices up and yields down, while equities like US100 decline.
4. Yield Curve and Market Implications
The US yield curve has steepened recently, with the 10-year yield (~4.40%) above the 2-year yield (~3.95%), reflecting expectations of higher long-term inflation and growth risks.
A steepening curve can signal improving growth prospects but also higher financing costs, which can weigh on tech stocks in the US100.
Conclusion
The 10-year Treasury yield and bond prices move inversely, with recent yield increases pushing bond prices below par.
The Nasdaq 100 (US100) typically moves inversely to 10-year yields, as higher yields raise borrowing costs and discount rates, pressuring growth stocks.
The relationship between US100 and bond prices depends on market risk sentiment: in risk-off periods, bond prices rise while equities fall; in risk-on periods, the opposite occurs.
The current steepening yield curve and elevated term premium suggest ongoing volatility and cautious investor positioning affecting both bonds and equities.
#NAS100 #DOLLAR

Falling Wedge Pattern in play.4164 CMP 123.40 (15-06-2025)
Falling Wedge Pattern in play.
Even in worst cases, if 112 is not broken,
we may see upside towards 133, 145 & then
probably around 170+

Stock is in DownTrend but ..4013 CMP 254.20 (15-06-2025)
Stock is in DownTrend but it Beautifully hit Channel
Bottom & Bounced.
Currently at a Good Support level.
Now the Immediate Resistance is around 256 - 257
& then around 270.
Crossing this level & Sustaining on Monthly basis would
lead it towards 283 - 285 initially.
However, should not break 253 - 254.

Top 10 Small-Cap Biotechs with Upcoming Catalysts for 2025Here are 10 small cap biotech stocks with notable upcoming catalysts in 2025—ranging from trial readouts and FDA decisions to pivotal data and corporate milestones:
________________________________________
🔬 Top 10 Small-Cap Biotechs with Upcoming Catalysts for 2025
1. Crinetics Pharmaceuticals (NASDAQ: CRNX)
• Catalyst: FDA PDUFA deadline for paltusotine (oral acromegaly treatment) expected by September 25, 2025.
• Focused on endocrine diseases and advancing pipeline beyond acromegaly (en.wikipedia.org).
Stock market information for Crinetics Pharmaceuticals Inc (CRNX)
• Crinetics Pharmaceuticals Inc is a equity in the USA market.
• The price is 32.33 USD currently with a change of -0.73 USD (-0.02%) from previous close.
• The latest open price was 33.1 USD and the intraday volume is 420639.
• The intraday high is 33.34 USD and the intraday low is 32.32 USD.
• The latest trade time is Wednesday, June 11, 23:45:00 +0300.
________________________________________
2. Viking Therapeutics
• Catalyst: Late-stage trial start for injectable weight-loss drug (GLP 1/GIP); mid-stage data readout for oral candidate due in 2025 (barrons.com).
• Strong analyst sentiment: Jefferies forecasts ~223% upside
________________________________________
3. Insmed (NASDAQ: INSM)
• Catalyst: Phase III/inhalable powder treprostinil palmitil for pulmonary arterial hypertension; recent results exceeded expectations; full Phase III data due in 2025
________________________________________
4. Kymera Therapeutics
• Catalyst: Phase I for KT 621 (oral STAT6 degrader for dermatitis/asthma); next-stage readouts expected late 2025–early 2026
• Shares rose ~50% on initial results; further trials underway
________________________________________
5. Arcutis Biotherapeutics (NASDAQ: ARQT)
• Catalyst: Technical breakout potential near $17.75; continued quarterly readouts with rising sales (33% last quarter)
• Upcoming investor calls/publication strategies may accelerate momentum.
________________________________________
6. Rhythm Pharmaceuticals (NASDAQ: RYTM)
• Catalyst: With FDA-approved Imcivree for genetic obesity, further label expansion or mid-to-late-stage trial results anticipated in 2025
• Institutional buying trends and revenue growth support upcoming readouts .
________________________________________
7. BeOne Medicines (Ticker: ONC)
• Catalyst: Early human data in solid tumor oncology; multiple upcoming trials in 2025 .
• Q1 2025 marked first profit; strong institutional support
________________________________________
8. Mesoblast Ltd & Capricor Therapeutics
• Catalyst: Stem-cell therapies targeting GvHD, heart failure, Duchenne muscular dystrophy—key FDA decisions expected in H2 2025
• Maxim Group flags pivotal year for approvals and stock catalysts (marketwatch.com).
________________________________________
9. Acelyrin (NASDAQ: SLRN)
• Catalyst: Phase III results for lonigutamab in thyroid eye disease; shareholder vote on Alumis merger around May 2025
• Merger closing and clinical readouts may drive volatility .
________________________________________
10. ADC Therapeutics & Foghorn Therapeutics & Pyxis Oncology
• Catalysts: Multiple preclinical/early clinical updates presented at AACR (April 2025)
o ADC Therapeutics (ADCT): Readouts on 6 ADC programs (Claudin 6, NaPi2b, etc.).
o Foghorn (FHTX): Preclinical updates on EP300, FHD609, FHD909.
o Pyxis Oncology (PYXS): Phase I ADC and Siglec 15 antibody data.
________________________________________
🔎 How to Monitor These Catalysts
• FDA PDUFA dates (Crinetics, Mesoblast/Capricor, Viking)
• Trial readouts/ASC presentations (Kymera, Insmed, ADC Therapeutics, Foghorn, Pyxis)
• M&A/news events (BeOne, Acelyrin merger)
________________________________________
📊 Summary Table
Ticker Company Upcoming Catalyst Timeframe
CRNX Crinetics PDUFA paltusotine NDA Sep 25, 2025
Viking Viking Therapeutics Injectable Phase III, oral Phase II data From mid-2025
INSM Insmed PAH inhalable Phase III readout Mid-to-late 2025
Kymera Kymera Therapeutics Dermatitis/asthma Phase I → Phase II Late 2025 – 2026
ARQT Arcutis Biotherapeutics Continued quarterly updates Throughout 2025
RYTM Rhythm Pharmaceuticals Label expansion/trial updates 2025
ONC BeOne Medicines Solid tumor trial data 2025
Mesoblast/Capricor Stem-cell stocks FDA decisions H2 2025
SLRN Acelyrin EMA/merger vote + Phase III readout May–Q3 2025
ADCT/FHTX/PYXS AACR presenters Academic readouts on multiple programs April 2025
________________________________________
⚠️ A Word of Caution
Small-cap biotech involves high volatility—catalyst events often drive sharp price swings, both up and down. Thorough due diligence is essential.

Gold price target of 3500 on Monday?Gold price target of 3500 on Monday?
Middle East is in turmoil again, tense situation
On Thursday and Friday, gold price took the opportunity to rise, forming a sharp upward trend, and is currently hovering around the previous pressure level of 3440;
1: Technical aspect: hovering around 3440 in the short term, but after the fermentation over the weekend, the probability of gold price hitting 3500 or even breaking through next week continues to increase.
2: Fundamentals: This is an important risk event over the weekend and also an important risk event in the near future; the current exchange of fire between Iran and Israel has inevitably intensified the trend of conflict and contradiction; there are too many uncertainties and interference factors in the future development direction of the situation;
1: The latest news is that Iran has sent ballistic missiles to Israel to respond; next week, the gold and crude oil markets may continue to be boosted by risk aversion, forming a strong upward trend;
2: Possible future trends:
A: The incident escalates directly; it has already occurred; proxy war; through the response to the incident, the forces such as Hezbollah in Lebanon and Houthi armed forces in Yemen are reactivated to engage in multi-line confrontations and form a multi-line pincer attack on Israel;
B: The United States intervenes militarily, and neighboring countries indirectly participate in the war, forming two strong confrontations; the forces of all parties Powers are playing games behind the scenes; China and Russia use strategic containment, diplomatic mediation and other means;
Impact on the global market:
1: Breaking the balance of the crude oil market; if the Strait of Hormuz is completely blocked, there is a high possibility that oil prices will soar directly in the future;
2: The impact on the financial market and regional economy is great, and the financial markets of Iran itself and neighboring countries will face risks; at the same time, global risk aversion is further intensifying, and gold, as a natural safe-haven currency, is bound to become a support level;
Summary: On the disk, it is still bullish next week, and the main operation is to follow the trend;
At the same time, the war in the Middle East is still the core of the entire market; the support level on the disk is 3400-3300 points, and the only pressure level above is 3500 points;
The trend line begins to break through and stabilize near 3500, so just follow the trend!

The Middle East fell, and gold took off on Monday?The Middle East fell, and gold took off on Monday?
The closing price of gold on Friday was about 3,433.
So for this week, on Monday and Tuesday, the price of gold also fluctuated at a low level, reaching a low of 3293 points and a high of 3350 points.
Since Wednesday, gold bulls have ushered in a rising trend, and the price of gold has risen from 3315 points to 3446 points before stopping, rising by more than 130 points in three days. In this regard, the explosive power of the bulls is still quite strong.
Of course, although the highest is only 3446 points, due to the influence of the news, the actual result may be more than that.
After all, market participants know that the chaos in the Middle East, especially the chaos in the past two days over the weekend, has not only not subsided, but has further expanded, and the scope of the impact is also spreading.
At this point, if the Middle Eastern forces do not stop, they may face the destruction of the entire region. After all, both sides have assistance.
At present, they even claim that the United States should also join this game. This situation undoubtedly gives gold bulls an absolute upward momentum.
After all, once the war breaks out, gold is valuable. Even if it is only local friction, it can stimulate a sharp rise in gold prices.
Under the current situation, it is not too much for gold prices to open high and break through 3,500 points.
From this point of view, there is no suspense that gold prices will open high next Monday.
The key is that there is still doubt about what kind of fluctuations will occur after the high opening, especially when the fluctuations are too large, operations still need to be avoided. After all, a small stop loss is definitely useless, so everyone should be cautious.
However, for market analysis, I frankly say that it is still a bit unrealistic to rely solely on geopolitical risks to stimulate the blind rise of gold.
First of all, no matter how the Middle East fights, the impact on the currency is limited.
At present, the whole world is paying attention to this matter. Everyone wants to suppress the outbreak of this matter, and this matter itself was caused by Iran's desire to develop nuclear weapons.
After all, this is a suppression implemented by some countries to suppress the occurrence of this matter. Once they can't beat it, they will still compromise.
So I don't expect this situation to last too long. If it lasts too long, no one can stand it.
So the stimulus of geopolitical risks will not be too strong. After all, the United States cannot let Israel destroy itself.
Moreover, the rise in gold will inevitably trigger market flight. After all, the tariff issue has eased, and Trump will not promote it for a long time unless it is profitable. This will also alleviate the outbreak of geopolitical risks to a certain extent.
Of course, there will be the minutes of the Federal Reserve's interest rate meeting and Powell's speech next week, which will also stimulate the unexpectedness of gold fluctuations to a certain extent. Next week is undoubtedly a turbulent period, which will largely lead to the uselessness of analysis, so I can't explain more. I hope everyone understands this.
Summary:
So the operation on Monday next week is likely to open high and go high.
1: If there is a decline after opening high, I think you can go long in the 3424-3417 range, but the position should be light and the stop loss should be set large.
2: If it opens higher and moves higher, you can also try to buy in batches with a small stop loss, but please note that I do not agree that gold will directly break through 3500. If it reaches the 3470-3500 area, I will also suggest trying to short tentatively.
3: If it really breaks through 3500, then look at the 3520-3530 area before shorting.

BTC BITCOIN Bitcoin buy level on the green structure to watch will be on the 100k and my next buy watch zone will be 97-98k .
Growing institutional participation, including the launch and approval of Bitcoin ETFs is increasing liquidity and legitimizing BTC as an investment asset.
Macroeconomic Environment , Persistent low real interest rates by central banks and concerns about inflation support demand for Bitcoin as a store of value.
Geopolitical uncertainties and currency debasement fears boost Bitcoin’s appeal as a digital gold.
Bitcoin’s network security, hash rate, and active addresses remain robust, underpinning confidence in its decentralized infrastructure.
Continued development in scaling solutions and layer-2 technologies enhances usability.
Increasing regulatory clarity worldwide, including clearer frameworks for crypto exchanges and custodians, reduces uncertainty and encourages adoption.
However, regulatory risks remains a factor that can cause short-term volatility.
#bitcoin #btc

Trend Alert – USD/CAD Could Be Preparing for a Major Reversal!🚨 Trend Alert – USD/CAD Could Be Preparing for a Major Reversal! 🚨
Traders, be cautious! The USD/CAD pair appears to be approaching a critical turning point. The market has now reached significant monthly support levels, and we are currently hovering around a marked green zone — a region known for potential bullish reactions.
For quite some time, the market has been in a strong bearish trend, consistently showing Breaks of Structure (BOS) to the downside. If you've been observing closely, you'll notice that the price action has been favoring sellers for weeks, if not months.
However, the dynamics might be changing soon.
There’s a large pool of liquidity building up above the current price levels. This creates the perfect condition for a strong bullish pump. The market could seize this opportunity to shift its direction and initiate a fresh uptrend.
💡 Key Insight: The current setup suggests that the bearish phase might be exhausted, and we could see the start of a bullish rally from this green support zone.
📉 Selling traders – proceed with caution! The risk of a sudden upside move is high, and holding onto short positions without proper risk management could be dangerous.
🧠 As always: Do Your Own Research (DYOR).
📛 This is not financial advice — just a heads-up from a market observer who’s keeping an eye on the charts!
