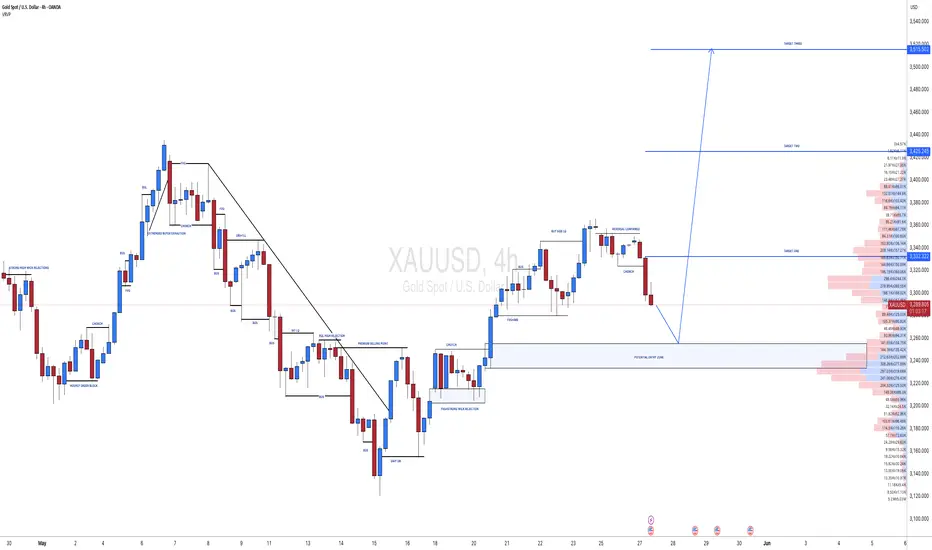
XAUUSD:[GOLD]: First Drop And Then Reverse! Comment Your Views! Gold touched $3350 but was rejected at that level, dropping around 3288. The price shows some minor support at this region, which we’re currently monitoring. If it breaks through, it could touch our buying zone, reversing the trend. You can set three targets based on your own analysis and bias. Please use accurate risk management while trading.
If you’d like to contribute, here are a few ways you can assist us:
- Like our ideas
- Comment on our ideas
- Share our ideas
Team Setupsfx_🚀❤️
Harmonic Patterns
#XAUUSD[GOLD]: Massive Boost For Buyers, Incoming More Volume! Gold has been moving as expected in our previous chart. We anticipate a smooth bull market in the coming days, with a target price region of 3400$. There are three specific targets you can aim for.
If you’d like to contribute, here are a few ways you can help us:
- Like our ideas
- Comment on our ideas
- Share our ideas
Team Setupsfx_🚀❤️

Is BTC in a Wycoff Distribution?BTC has failed to breakout from $110k and hold. I am starting to notice a possible Wycoff distribution pattern on bigger and smaller timeframes. I am a long term bull on BTC so don't meant to sound like a bear but it is starting to show signs of weakness. Anything can happen and the market is always right. Stay safe!

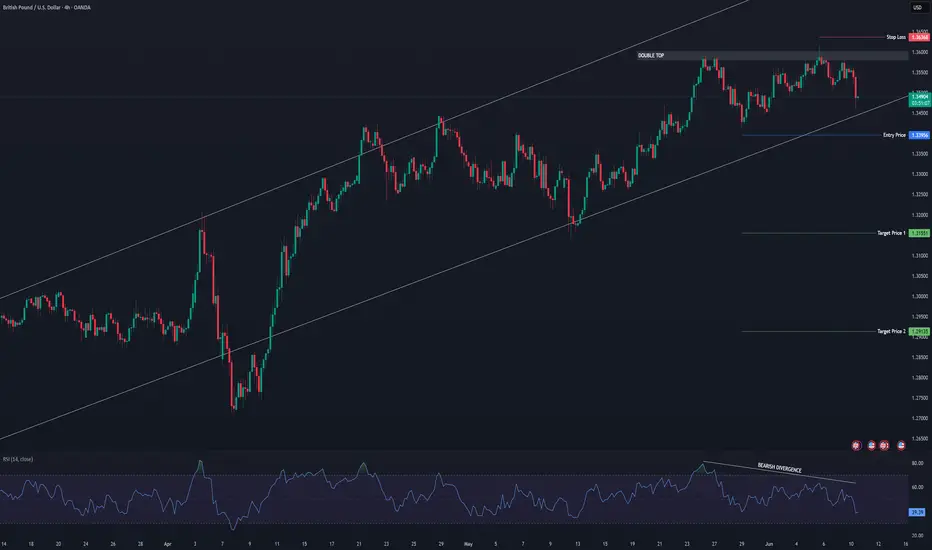
GBP/USD Technical OutlookGBP/USD is exhibiting signs of bearish momentum, with clear bearish divergence observed on the oscillator, signaling potential exhaustion of the recent uptrend. A double top formation is developing near the recent highs, further supporting the bearish bias. Price action is also approaching a key trendline and the lower boundary of an ascending channel. A confirmed break below these technical structures would validate the formation of a new lower high, offering a high-probability short setup.
XAUUSD GOLD NEW WEEK OUTLOOK MOVES BULLISH SIDE 14/6/2025new week new profits
new setup
new goals
new treends
buyers
sellers
investors

XAUUSD: Gold Crossed $3400 For The First, What Next? Gold has crossed the 3400$ region for the first time after a period of consolidation and correction. We are now on the verge of crossing $3450 and potentially touching $3550, which would set a new record for gold. With accurate risk management, you can monitor three potential targets. You can take entry on these ideas based on your own bias.
Good luck and trade safely. If you like our idea, please like, comment, and share.
Team Setupsfx_

ETHEREUM ETHUSDT is on a demand floor ,awaiting buy liquidity ,it could seek liquidity before going long.
if buyers fail to hold strong on demand floor ,it will retest the descending trendline at 1300$ level.

#BITCOIN: Accumulated Volume, Time For $150,000Bitcoin has accumulated nicely, but we don’t expect the price to distribute strongly towards $150k. We have set two targets: 125k and a swing target at 150k. Remember to have a confirmation before entering.
Good luck and trade safely,
Team Setupsfx_

#PEPEUSDT: Major Swing Upcoming! Get Ready! PEPEUSDT is currently in phase two of accumulation and will distribute the price soon. We expect the price to move in a bullish impulse pattern as we anticipate volatility in the coming days. However, we advise having a secondary bias while investing or trading on cryptocurrency, as it is highly risky and lacks the same volume as forex or gold.
Good luck and trade safely!
Team Setupsfx_

BNB Holds $649 Floor, but Momentum FadesBNB is attempting to hold above $649 after a volatile recovery. Despite a solid bounce from sub-$645, price has flattened, indicating consolidation or fading interest at current levels.

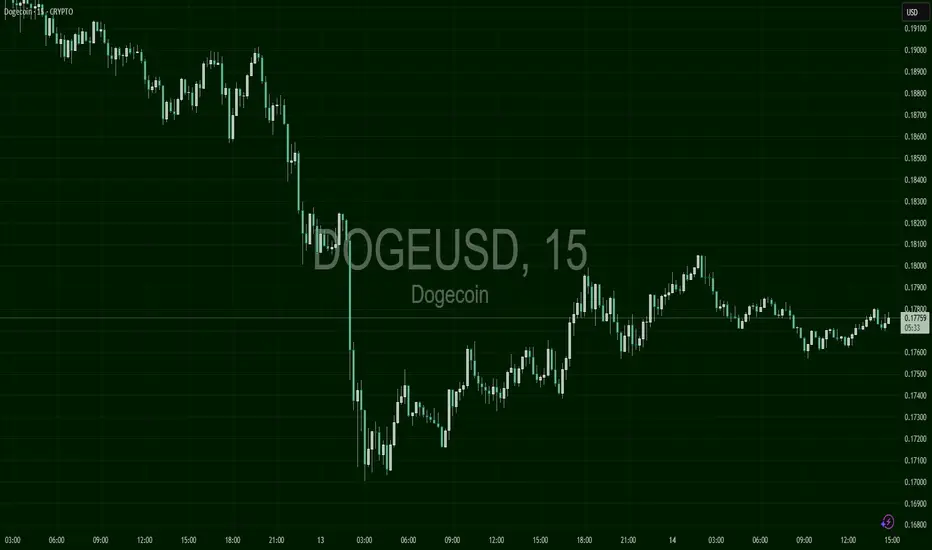
Dogecoin Recovers from Sharp Dip, Faces ResistanceDogecoin (DOGE) plunged hard below $0.17, then bounced back with a steady grind. Price is now consolidating near $0.177 but lacks strong momentum to push higher, forming lower peaks.
TRON Slides into Range-Bound Chop Near $0.27TRON (TRX) is showing a whipsaw pattern with multiple rejections above $0.273 and support near $0.267. The pair is fluctuating with no clear breakout, reflecting indecision and lack of trend direction.

XAGUSD Technical & Order Flow AnalysisOur analysis is based on a multi-timeframe top-down approach and fundamental analysis.
Based on our assessment, the price is expected to return to the monthly level.
DISCLAIMER: This analysis may change at any time without notice and is solely intended to assist traders in making independent investment decisions. Please note that this is a prediction, and I have no obligation to act on it, nor should you.
Please support our analysis with a boost or comment!

#ARB/USDT#ARB
The price is moving within a descending channel on the 1-hour frame and is expected to break and continue upward.
We have a trend to stabilize above the 100 moving average once again.
We have a downtrend on the RSI indicator, which supports the upward move by breaking it upward.
We have a support area at the lower limit of the channel at 0.3382, acting as strong support from which the price can rebound.
Entry price: 0.3408
First target: 0.3466
Second target: 0.3523
Third target: 0.3596

AUDUSD Technical & Order Flow AnalysisOur analysis is based on a multi-timeframe top-down approach and fundamental analysis.
Based on our assessment, the price is expected to return to the monthly level.
DISCLAIMER: This analysis may change at any time without notice and is solely intended to assist traders in making independent investment decisions. Please note that this is a prediction, and I have no obligation to act on it, nor should you.
Please support our analysis with a boost or comment!

SHORT BTC✅ Short Setup Summary – BTCUSDT (15m chart)
🧭 1. Context
Volume Profile shows clear value area and Point of Control (POC) between ~104,000–106,000
Price is expected to retrace to supply at 106,400 (previous HVN & resistance)
Trade plan: Short from 106,400 → down to 100,600 zone
📌 Trade Idea Breakdown
🔄 Trade Direction: Short
🟩 Short Entry Zone: ~106,400
🟥 Stop Loss: Above the recent swing high (~107,000+)
🎯 Take Profit (TP): 100,600–100,300 (previous demand/liquidity zone)
📏 Checklist-Based Analysis
✅ 1. Market Structure
Current short-term structure is bearish (lower highs, lower lows)
Plan to enter at pullback into resistance, in-line with the trend
📘 Rule: Always trade with MS unless you have a trap or reversal
✔️ Structure: Bearish → short pullback is valid
⚠️ 2. Key Level (106,400)
Acts as supply zone / resistance
Also lines up with previous POC / volume cluster
High probability reaction area
📘 Rule: Trade from areas where volume or liquidity previously reacted
🔻 3. Entry Confirmation
Watch for:
Trap wick (SFP) or
Bearish engulfing / 3-bar reversal
On M15 or M5 before entry
📘 Rule: Do not enter blindly — wait for confirmation
📊 4. Volume Check
Monitor if volume increases during the test of 106,400
Preferably with aggressive sellers stepping in
📘 Rule: Volume spike + rejection wick = institutional activity
🛡 5. Risk Management
Component Value / Zone
Entry ~106,400
SL Above 107,000 (last clean high)
TP 100,600 – 100,300
R:R Target at least 1:3
📋 Execution Rules Summary
Step Status
Market structure bearish ✅
Supply zone identified ✅
Entry confirmation seen? 🔲 Wait
Volume reaction checked? 🔲 Wait
SL/TP based on structure ✅
🧠 Final Thoughts
This is a solid short setup plan with the trend.
You’re selling from a liquidity cluster + resistance + supply area — a confluence zone.
Just ensure you:
Wait for trap confirmation or bearish price action
Don’t jump in early — let price show weakness first
Watch for volume spike confirming rejection at 106,400

LONG BTC✅ Long Setup Summary (BTCUSDT)
🧭 1. Daily Timeframe Context (D1)
Price is approaching a key low zone at 100,300 – 100,600
This is a previous liquidity area, often where large players hunt stop-losses
Expecting a trap or reversal if price sweeps below and quickly recovers
📌 Rule: Always check the Daily chart to:
Understand current trend bias
Identify if price is at support/resistance
Spot any trap or reversal signals (e.g., engulfing, pin bar, 3-bar reversal)
📐 2. Market Structure (M15–H1)
Short-term structure is currently bearish (lower highs, lower lows)
Trade idea is a counter-trend long, so confirmation is critical
📌 Rule:
Confirm market structure on M15/H1 before entry
Counter-trend trades must have trap confirmation to reduce risk
🔻 3. Trap / SFP Confirmation (Key Entry Condition)
Watch for price to break below 100,300 (previous low) and reject sharply
Look for a swing failure pattern (SFP) or false breakout wick
Entry is valid only if price closes back above the trap zone
📌 Rule:
Never enter just because price is at support
Only enter after trap wick + bullish candle confirmation
📊 4. Volume Confirmation
Look for a spike in volume at the trap wick
Confirms real interest and activity from institutional participants
📌 Rule:
A proper reversal setup includes price trap + volume confirmation
Avoid setups with low or flat volume during the move
🎯 5. Entry Plan
Component Details
Buy Zone 100,300 – 100,600
Entry After confirmation: trap wick + bullish candle
Stop Loss Below the trap wick (example: 99,800)
Take Profit 106,400 (prior resistance / supply zone)
R:R Ratio Minimum 1:3, depending on execution
📌 Rule:
SL must be based on trap invalidation, not random distance
TP should be at the next key structure, not a fixed pip target
✅ Execution Checklist
Step Check
Daily bias aligns or neutral? ✅
Market Structure reviewed? ✅
Trap / SFP occurred? 🔲
Volume spike confirmed? 🔲
Bullish PA confirmation? 🔲
SL placed correctly? ✅
TP set at logical structure? ✅
📌 Summary
This is a high-probability counter-trend long setup from a key liquidity zone.
Success depends entirely on:
A clean trap/SFP wick
Volume spike at the low
Bullish price action confirmation
Without these, avoid entering.
Stick to the rules, and let the market come to you — don’t force the trade.

BTC - FRACTAL!!!!I found a fractal, the price should rise to the range of 110888, and then there will be a sharp decline, a squeeze will form, with the price supposedly rising and crossing over, but in reality, the price will be pushed down sharply to a range below $90k. I have an idea related to this, I called it the dragon's wings pattern. At one point, I simply realized that the chart repeats what has already happened, and this is exactly what needs to be analyzed. I think the price will go exactly as I have drawn it. All the best and stay disciplined!

USDCADBank of Canada (BoC) June 2025 Interest Rate Decision
The BoC held its key interest rate steady at 2.75% on June 4, 2025, marking the second consecutive hold after a series of cuts totaling 225 basis points since mid-2024.
The Bank Rate remains at 3.00%, and the deposit rate at 2.70%.
The decision reflects ongoing uncertainty from U.S. trade policies and tariffs, which continue to pose risks to Canada’s economic growth and inflation outlook.
The BoC emphasized the need to monitor the effects of trade tensions and inflation pressures before making further moves.
The next BoC rate announcement is scheduled for July 30, 2025.
Federal Reserve (Fed) June 2025 Interest Rate Decision
The Fed held its target federal funds rate at 4.25–4.50% in its June 2025 meeting, maintaining a cautious, data-dependent stance amid mixed inflation and labor market signals.
Recent data showed inflation moderating but still above target, and the labor market softening but resilient, leading the Fed to pause rate changes while assessing incoming economic information.
Market pricing indicates a growing probability of a rate cut later in 2025, possibly starting in September, contingent on sustained disinflation and labor market trends.
The Fed continues to monitor risks from tariffs and global economic uncertainties.
JUNE 18th economic data will be watched by BOC Gov Macklem Speaks and BOC Summary of Deliberations
Federal Reserve will update Federal Funds Rate 4.50% 4.50%,FOMC Economic Projections,FOMC Statement and FOMC Press Conference
In summary: Both the BoC and Fed paused rate changes in June 2025, reflecting a cautious approach amid economic uncertainties—trade tensions for Canada and inflation/labor market data for the US. Markets expect potential easing later in the year if conditions deteriorate
1. USD/CAD and Oil Price Correlation
Strong Negative Correlation:
USD/CAD and oil prices exhibit a strong inverse correlation. When oil prices rise, the Canadian dollar (CAD) tends to appreciate against the US dollar (USD), causing USD/CAD to fall, and vice versa.
Reason: Canada is a major oil exporter (over 3 million barrels/day), so oil revenues significantly impact Canada’s trade balance and economic health. Higher oil prices improve Canada’s terms of trade and strengthen CAD.
Recent Trends:
Although this correlation remains strong, its intensity has somewhat weakened recently due to other factors like global risk sentiment and trade dynamics. Still, oil remains a key driver of CAD strength.
2. USD/CAD and 10-Year Bond Yields
Interest Rate Differentials Influence:
The difference between US and Canadian 10-year government bond yields affects USD/CAD. A higher US yield relative to Canada tends to strengthen USD versus CAD, pushing USD/CAD higher. Conversely, if Canadian yields rise relative to US yields, CAD strengthens, lowering USD/CAD.
Risk Sentiment and Yield Movements:
Bond yields reflect economic growth expectations and monetary policy outlooks. Diverging economic conditions or central bank actions between the US and Canada influence these yields and thus USD/CAD.
Example: If US yields rise due to Fed tightening while Canadian yields stay stable, USD/CAD may rise.
3. Central Bank Interest Rate Decisions
Monetary Policy Impact:
The Federal Reserve (Fed) and Bank of Canada (BoC) interest rate decisions are crucial drivers of USD/CAD.
Rate Hikes: If the Fed raises rates or signals hawkishness while BoC holds or cuts, USD tends to strengthen against CAD, pushing USD/CAD higher.
Rate Cuts: Conversely, if BoC hikes or signals hawkishness and Fed eases, CAD strengthens, lowering USD/CAD.
Policy Divergence: Market expectations around these decisions create volatility in USD/CAD.
4. Carry Trade Advantage
Carry Trade Basics:
Carry trade involves borrowing in a currency with low interest rates and investing in a currency with higher rates to earn the interest differential.
USD/CAD Context:
If Canadian interest rates are higher than US rates, investors may borrow USD to invest in CAD assets, supporting CAD and lowering USD/CAD.
Interest Rate Differentials: The attractiveness of carry trades depends on the interest rate spread between the two countries and market risk appetite.
Risk Considerations: Carry trades can unwind quickly during market stress, causing sharp USD/CAD moves.
5. Uncovered Interest Rate Parity (UIP)
UIP Theory:
Uncovered Interest Rate Parity (UIP) is an economic and financial theory that explains the relationship between interest rates and exchange rates between two countries.
Key Points of UIP:
Definition: UIP states that the difference in nominal interest rates between two countries equals the expected change in exchange rates between their currencies over the same period. In other words, if one country has a higher interest rate, its currency is expected to depreciate relative to the currency of the country with the lower interest rate.
Implication: This means investors should expect no arbitrage opportunities from interest rate differentials alone because any potential gains from higher interest rates in one country will be offset by losses from currency depreciation.
Example:
Suppose the US has a 6% interest rate and India has a 14% interest rate. According to UIP, the Indian rupee is expected to depreciate against the US dollar by approximately 8% (the difference in interest rates) over the investment period. So, although an investor might earn higher interest in India, the currency depreciation offsets the gain.
Relation to Law of One Price: UIP is similar to the "Law of One Price," which states that identical goods or securities should have the same price globally when adjusted for exchange rates.
Difference from Covered Interest Rate Parity (CIP):
UIP does not involve hedging exchange rate risk with forward contracts; it uses expected future spot rates.
CIP involves using forward contracts to lock in exchange rates, eliminating currency risk.
Formula:
The expected change in exchange rate ≈ difference in interest rates between two countries.
USD/CAD Implication:
Traders watch interest rate differentials and expectations to forecast USD/CAD moves, but must consider that other factors (oil prices, risk sentiment) also influence the pair.
Summary Table
Factor Impact on USD/CAD Explanation
Oil Prices Higher oil → CAD strengthens → USD/CAD ↓ Canada’s oil exports support CAD
10-Year Bond Yield Differential Higher US yields → USD strengthens → USD/CAD ↑ Reflects monetary policy and growth outlooks
Central Bank Rate Decisions Fed hike > BoC hike → USD/CAD ↑ Interest rate differentials drive flows
Carry Trade Higher CAD rates → carry trade inflows → USD/CAD ↓ Investors seek higher yields in CAD
Uncovered Interest Rate Parity Interest rate gap ≈ expected exchange rate change Theoretical equilibrium, often imperfect
Conclusion
The USD/CAD pair is heavily influenced by oil prices, with a strong negative correlation due to Canada’s oil export dependence.
Interest rate differentials and central bank policies between the US and Canada also play a critical role, affecting bond yields and carry trade flows.
While carry trade strategies can amplify movements, they carry risk during market volatility.
Uncovered Interest Rate Parity provides a theoretical framework for exchange rate expectations but is often influenced by other market factors, including commodity prices and risk sentiment.
#USDCAD

UPDATE ON VVV SELL , Anything above $3.73 is a good short (SELL)UPDATE ON VVV SELL
Anything above $3.73 is a good short (SELL)
Adding shorts in parts with low risk
Expecting a downside move soon
from these areas $3.75-$3.80
Area to target for further short entries from $3.85
Target $3.18 or Down
Not a Financial advice

VVV PERPETUAL TRADE , Sold From $3.19VVV PERPETUAL TRADE
VVV SELL SETUP
Currently $3.19
Sold From $3.19
(Trading plan If VVV go up to $3.30
will add more shorts)
Expecting target $3.10 OR DOWN
In the event of an early exit,
this analysis will be updated.
Its not a Financial advice

CAPRI GLOBAL CAPITAL LIMITED 1DCapri Global Capital Limited is currently trading around ₹176. The stock has recently broken a key resistance level with significant volume, indicating strong upward momentum. This development suggests potential for further gains, with a possibility of testing or surpassing its all-time high.
Disclaimer: The information provided is for educational and informational purposes only and should not be considered as financial advice. Investing in the stock market involves risk, and past performance is not indicative of future results. Please consult with a certified financial advisor or conduct your own research before making any investment decisions. We are not responsible for any losses incurred as a result of using this information. Stock market investments are subject to market risks; read all related documents carefully.

$BTC Bounced from $103K – Hedge Short Still Active
Bitcoin was supposed to break out, but fear of war changed the plan. Instead of pumping, BTC dropped to retest support around $102,700 — and bounced strongly.
🔸 Key Support Zone: $100K – $99K
This area is holding well for now. But if BTC loses $99K, we could see a deeper drop.
🔸 Short from $108,500 is still open
We’re using it as a hedge in case the market crashes. If the price drops more, we’ll take profit on the short. If BTC goes back up to $108K+, the short will be closed on entry. That’s the best-case scenario.
🔸 What’s Next?
Everything depends on global news. If war fears grow, BTC may drop fast. If things calm down, we could see a strong recovery.
✅ We’re in a strong position — low risk, high reward. No panic. We’re ready for both outcomes.
