BUY XAUUSDI believe we may see the bullish rally we have all been anticipating. Current structure seems to be a bullish flag on H1 and and inverse head and shoulder on M15 was used as confirmation
Harmonic Patterns

LDOUSDT 4D Analysis LDO ~ 4D Analysis
#LDO Buy gradually from here if you still have confidence in this coin with a short term target of at least 20%++

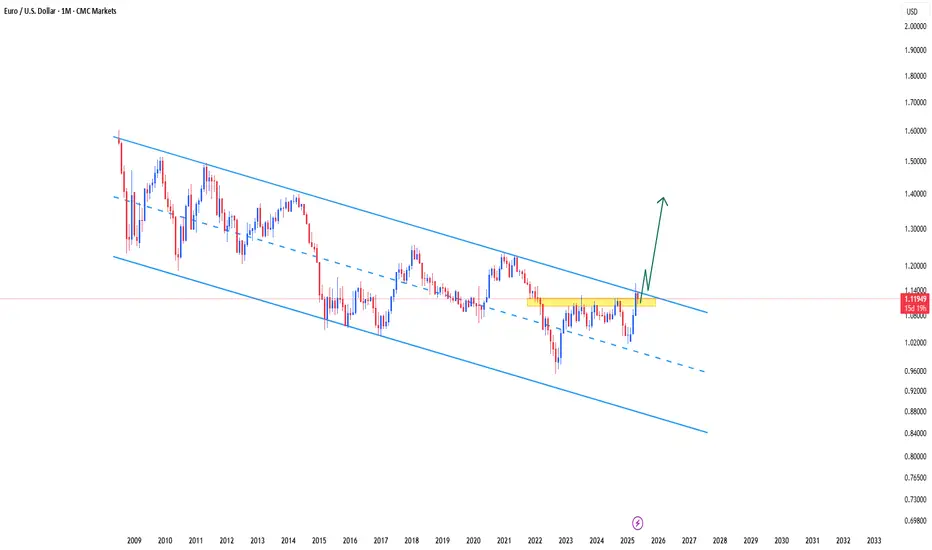
EURUSD Buy breakoutBuy gradually from here or wait for breaking through this resistance line with a short-term target of at least 10%+.
The Possible Flight of Gold Prices: Could It Soar Beyond $3,145?"Gold prices might take flight like a BAT soaring past $3.14k!
🌟💰 What are your thoughts on this potential move?

NZDJPY - Buy IdeaNZDJPY has been in a bearish trend on the 1-day timeframe but recently broke and retested a descending trendline, indicating a potential reversal. Consider a buy opportunity at the current price. Set a stop loss below 83.900 to manage risk. Take profit targets are as follows: TP1 at 86.880, TP2 at 88.500, and TP3 at 90.900.

$SOL Breakout & Retest SetupCRYPTOCAP:SOL Breakout & Retest Setup
SOL has broken out of a long-term descending trendline (red) and is currently trading at $171.49. The price has also reclaimed the ascending support trendline (blue), suggesting strong bullish momentum.
🔸 Key Support Zone at $150–$160:
This area aligns with a potential retest of the broken trendline and ascending support confluence. A successful retest here would confirm the breakout and offer a strong entry zone.
🔸 Upside Target: $250+
Once the retest confirms support and buyers step in, SOL could begin a strong upward move toward $200, with $250+ as a mid-term target.
🔸 Risk Level at $140:
A daily close below $140 would invalidate this bullish structure and shift the bias to bearish.
🔸 Action Plan:
Monitor for a pullback toward $150–$160
Look for bullish confirmation (wicks, volume, bullish engulfing) before entering
First major resistance around $200, followed by $225–$250

AUDUSD bullish sideways consolidation supported at 0.6355AUDUSD maintains a bullish bias, supported by the prevailing upward trend. Recent intraday movement indicates a corrective pullback toward a key consolidation zone, offering a potential setup for trend continuation.
Key Support Level: 0.6355 – previous consolidation range and pivotal support
Upside Targets:
0.6470 – initial resistance
0.6500 and 0.6550 – extended bullish targets on higher timeframes
A bullish breakout from 0.6355 would suggest continuation of the uptrend, confirming buying momentum.
However, a decisive reversal and daily close below 0.6355 would invalidate the bullish structure, opening the door for further retracement toward 0.6310, with additional support at 0.6235 and 0.6195.
Conclusion
AUDUSD remains bullish above 0.6355. A bounce from this level supports further gains. Traders should watch for confirmation signals before positioning for the next move.
This communication is for informational purposes only and should not be viewed as any form of recommendation as to a particular course of action or as investment advice. It is not intended as an offer or solicitation for the purchase or sale of any financial instrument or as an official confirmation of any transaction. Opinions, estimates and assumptions expressed herein are made as of the date of this communication and are subject to change without notice. This communication has been prepared based upon information, including market prices, data and other information, believed to be reliable; however, Trade Nation does not warrant its completeness or accuracy. All market prices and market data contained in or attached to this communication are indicative and subject to change without notice.

MAGICUSDT 1D AnalysisMAGIC ~ 1D Analysis
#MAGIC Buy gradually after successfully breaking through the resistance line of this pattern with a short-term target of at least 10%++

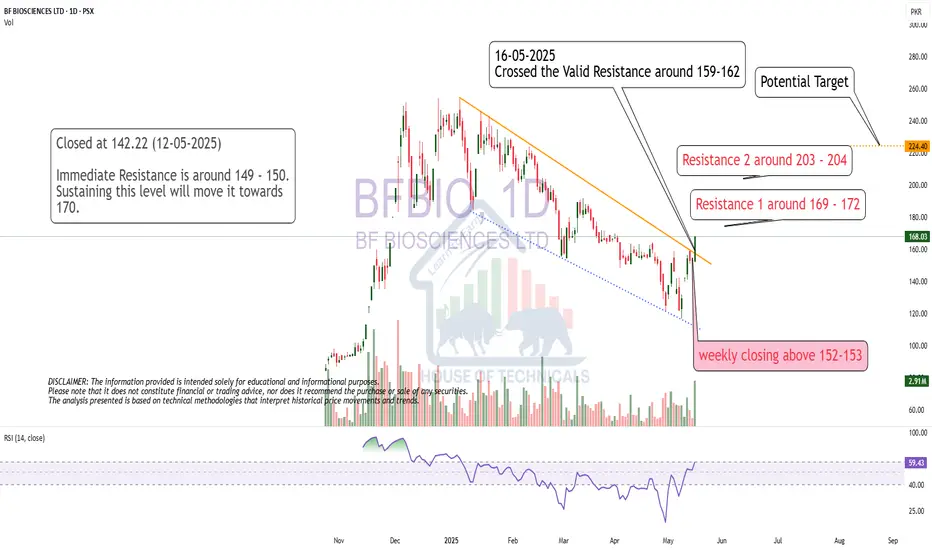
Breakout
Crossed the Valid Resistance around 159-162
Potential target is 220+
However mid resistances are there also.
Harmonic Shark Pattern and Palantir's Stock CorrectionBased on harmonic analysis, specifically the Shark pattern, the price of Palantir (PLTR) stock may face a potential decline from the $129 mark.
This projection hinges on the identification of a completed Shark pattern, indicating a possible reversal zone.
Within this framework, the Fibonacci ratios of 0.88 and 1.138 are critical levels to observe.
The 0.88 retracement level suggests a potential area for a first retest and possible bounce, while the 1.138 level represents the pattern's leading edge, indicating a possible reversal point after a more significant extension.

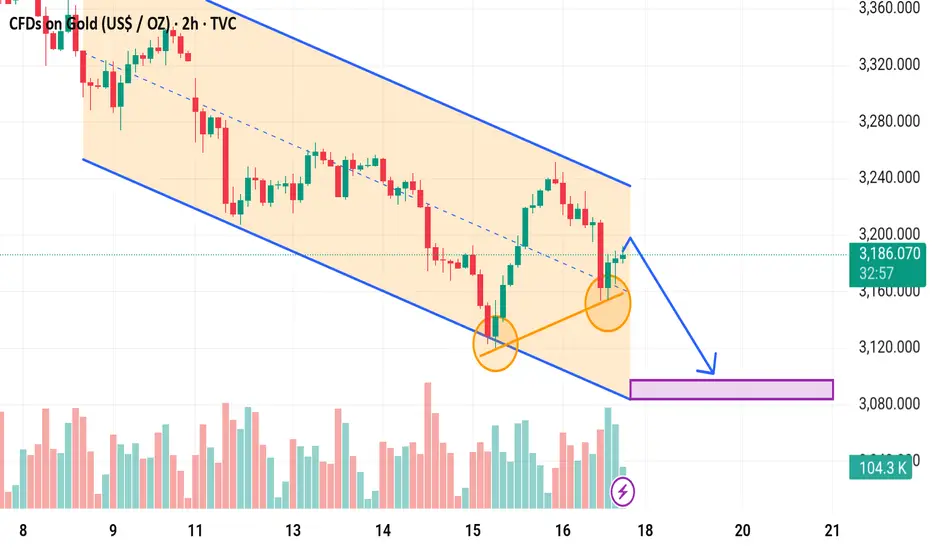
GOLD SHORT SETUP🟡 Harmonic Pattern + Support Break = Bearish Confirmation 🐻
📉 #XAU/USD Analysis | 4H Timeframe
#Gold has temporarily shifted into a bearish trend, and here's why I'm eyeing a short setup at current levels:
✅ Harmonic Pattern Completion spotted on the 4H chart
✅ Clear break below key support zone, now acting as resistance
✅ Lower highs and lower lows forming – confirming short-term bearish structure
📌 Entry: Current Market Price (CMP)
📌 SL: 3353.751
📌 TP Zones: 2974.632
⚠️ Important Note:
If bullish divergence forms on the 1H or 4H timeframe, I will consider closing the trade early at CMP.
💬 What’s your view on this #GOLD setup?
Would you short here or wait for a pullback?
🔁 Like, share, and follow for more clean setups!
📲 Comment below with your thoughts or questions – let's discuss!
#GOLD #XAUUSD #BearishTrend #HarmonicPattern #PriceAction #SupportResistance #Forex #TradingSetup #TechnicalAnalysis #ShortTrade #RiskManagement #Divergence

xauusd 1hThe chart you’ve shared is a technical analysis of the Gold Spot (XAU/USD) on the 1-hour timeframe. Here's a breakdown of the key elements shown:
1. Downtrend Break:
A red trendline indicates a previous downtrend that has recently been broken to the upside, suggesting a potential reversal.
2. Buy Zone:
The chart labels a "buy zone" around the area where price has pulled back to retest the broken trendline—this is a common entry point for traders anticipating a bounce.
3. Levels & Target:
Level 1: Around 3,240
Level 2: Around 3,280
Target Successful: Around 3,330+
These are likely resistance levels or profit-taking points

XAUUSD now buy signal Gold kept up its bullish momentum on Thursday, climbing to fresh daily highs above the key $3,200 mark per troy ounce. The move is getting a boost from a softer Greenback and a generally cautious mood in global markets, while the initial excitement around the US–China trade deal continues to fade.
XAUUSD now buy 3224
Support 3250
Support 3270
Target 3300

Why Echelon Prime will hit $200 and potentially $400 in 2025Echelon Prime (PRIME) is at the forefront of a transformative movement in Web3 gaming and AI-driven virtual economies. With its innovative ecosystem and upcoming flagship game, Parallel Colony, Echelon Prime is poised for significant growth.
The Echelon Ecosystem: Merging AI and Gaming
Echelon Prime is a blockchain-focused organization supporting a decentralized gaming ecosystem. It provides the PRIME token and Web3 tools for game developers, facilitating resource allocation and governance within a community-led environment.
The ecosystem's cornerstone is the PRIME token, which serves as the native currency across its platforms. PRIME enables players to access exclusive content, participate in governance, and engage in various in-game activities.
Parallel Colony: A Revolutionary AI-Driven Game
Parallel Colony is an upcoming simulation game where players partner with AI avatars to navigate a mining colony. Each avatar controls a wallet, allowing them to own digital possessions and interact with other semi-autonomous agents.
This "1.5 player" game design introduces a new paradigm in gaming, where AI agents operate alongside human players, creating a dynamic and immersive experience. The game's integration of AI and blockchain technology exemplifies the innovative direction of the Echelon ecosystem.
Market Potential and Price Outlook
As of now, Echelon Prime (PRIME) is trading at approximately $4.24, with a market capitalization of around $151 million. Given the ecosystem's innovative approach and the anticipated release of Parallel Colony, there is substantial growth potential.
A projected market cap of $15 billion would correspond to a PRIME token price of approximately $204, representing a 50x increase from current levels. This projection is based on the expected adoption of the Echelon ecosystem and the success of its flagship game. This could very well be a $30 billion market cap by end of 2025 as well, depending on other game title releases and new updates to other ambitious projects.
Conclusion: A Promising Investment in Web3 Gaming
Echelon Prime stands at the intersection of gaming and AI, offering a unique and forward-thinking ecosystem. With the upcoming release of Parallel Colony and the continued development of its platforms, Echelon Prime presents a compelling opportunity for investors interested in the future of Web3 gaming.

Gold - Long SetupGold broke a very strong trendline and came back for a retracement to test it. A strong bullish momentum could be observed. Therefore going long on XAUUSD

ATTACKING TREND short set uplooking at this pair it is in correction phase so we anticipate futher reduction on price

NASDAQ100 (US100) Testing Key Supply Zone – Big Move Loading?The NASDAQ100 (US100) is currently testing a major supply zone around 21,380 – 21,400, marked clearly by repeated price rejection and visible range resistance from LuxAlgo’s Supply & Demand indicator.
After a strong bullish move from the 20,688.51 demand zone, price is consolidating just below resistance, forming what looks like a potential distribution range. If bulls fail to break this level cleanly, we could see a sharp drop toward the next key supports:
First target: 21,044.29 (Minor support / previous resistance)
Second target: 20,688.51 (Major demand zone, confirmed by volume)
Why this setup matters:
The supply zone has already rejected price multiple times – showing seller strength.
RSI is flattening out, showing momentum loss.
U.S. economic events are coming up (marked on the chart) – these could trigger volatility and confirm direction.
Trading Plan:
Watch for a clean rejection or breakout from the blue zone.
A confirmed rejection + bearish candle pattern = short entry with stops above the zone.
A breakout with volume = bullish continuation above 21,400.
Comment below:
Are you buying the breakout or selling the rejection?
Follow for more clean NASDAQ setups every week!
#US100 #NASDAQ #TradingSetup #SupplyAndDemand #LuxAlgo #PriceAction #TechnicalAnalysis #DayTrading #Forex #Indices #RejectionTrade #Breakout

SNXUSDT 1D Analysis SNX ~ 1D Analysis
#SNX Buy after successfully breaking this resistance line with a short term target of at least 15%+ from here.

GASUSDT 1D Analysis GAS ~ 1D Analysis
#GAS Buy gradually after successfully breaking through this resistance line with a short-term target of at least 10%+.

RSP Spiral cycle peak 5/16 EXIT The chart posted is the RSP SP 500 EQUAL WEIGHTED the two high based on spirals are due to peak on Friday late . We should have a short term top and the begin a pullback for wave 4 . Best of trades WAVETIMER

COINBASE and ALTS going hand in hand! Massive break-out expectedCoinbase (COIN) and the Crypto Total Market Cap (excluding top 10) are going hand in hand in this Cycle as their patterns since the November 08 2021 High have been virtually identical.
Right now we are on a strong rebound which was initiated on both after breaching below the 1W MA200 (orange trend-line). That is basically a Double Bottom, aiming at a break-out above their respective Resistance levels, which is expected to be massive.
Notice how even their 1W RSI patterns are similar, both Falling Wedges. Also their Bull Cycles both started on an Inverse Head and Shoulders pattern, so there is every reason to expect that the two will continue hand in had until their very peaks of the Cycles.
-------------------------------------------------------------------------------
** Please LIKE 👍, FOLLOW ✅, SHARE 🙌 and COMMENT ✍ if you enjoy this idea! Also share your ideas and charts in the comments section below! This is best way to keep it relevant, support us, keep the content here free and allow the idea to reach as many people as possible. **
-------------------------------------------------------------------------------
💸💸💸💸💸💸
👇 👇 👇 👇 👇 👇

SPX500 Hits Major Supply Zone – Will the Bears Take Over?The S&P 500 (SPX500) just tapped a significant supply zone between 5945–5952, a key level where previous selling pressure led to strong bearish moves. Price is currently showing signs of exhaustion at the top of this zone on the 4H timeframe, and we may be witnessing a potential reversal setup.
Key Levels:
Supply Zone (Resistance): 5945 – 5952
Mid-Support: 5478
Demand Zone (Strong Support): 4916 – 4920
Possible Scenarios:
1. Rejection from the supply zone could trigger a pullback to 5478, and if that breaks, the next bearish target would be the demand zone at 4916.
2. If the bulls break and close above 5952 with strong momentum, we might see new highs, but volume confirmation is needed.
Watch for:
Bearish candlestick patterns in the supply zone
Reversal confirmation with RSI or MACD divergence
Volume drop on the breakout attempt
Red Arrows Mark: High-probability downside targets in case of reversal.
With key economic events marked on the chart (highlighted on May 22), volatility is expected. A fakeout or whipsaw move could be in play—stay cautious!
Are you bullish or bearish on SPX500? Drop your thoughts below and don’t forget to like and follow for more institutional-level analysis!
#SPX500 #S&P500 #LuxAlgo #SupplyDemand #TradingView #Forex #Stocks #PriceAction #SmartMoney #TechnicalAnalysis #SP500Analysis

Theres some edge to this hedge shortit pixeled vwap
theres RSI and CVD hidden bear divergence
in 30 minutes you also have regular bear divergence and ES1 is signaling absorption.
im bullish on smci but i have to take this

XAUUSD SELL TARGET Guys, this is today's target and you know that the market will close tonight, so this is next week's target, follow it.