CHECK US100 SIGNAL READ CAPTAINus100 sell now ✅
entry point (21650) (21620)
TAKE PROFIT 1: (21550)
TAKE PROFIT 2: (21400)
LAST TARGET (21300)
STOP LOSS (21750)
Harmonic Patterns

CHECK BTCUSD SIGNAL READ CAPTAINbtcusd sell now ✅
entry point (105.250) (105.150)
TAKE PROFIT 1: (104.750)
TAKE PROFIT 2: (104.200)
LAST TARGET (103.700)
STOP LOSS (105.800)

LUNC/USDT is in Reversal LUNC/USDT is showing good trend line reversal with the divergence on the 4hr time frame looks good for buy at current price or it can be go for some small retracement on 1hr time frame

SHIB/USDT is in Bullish TrendSHIB/USDT is looking good to go up side it is showing good retracement on daily chart and also showing bullish divergence on daily chart it can be buy current price or if some one want to be more sure then buy after new HH

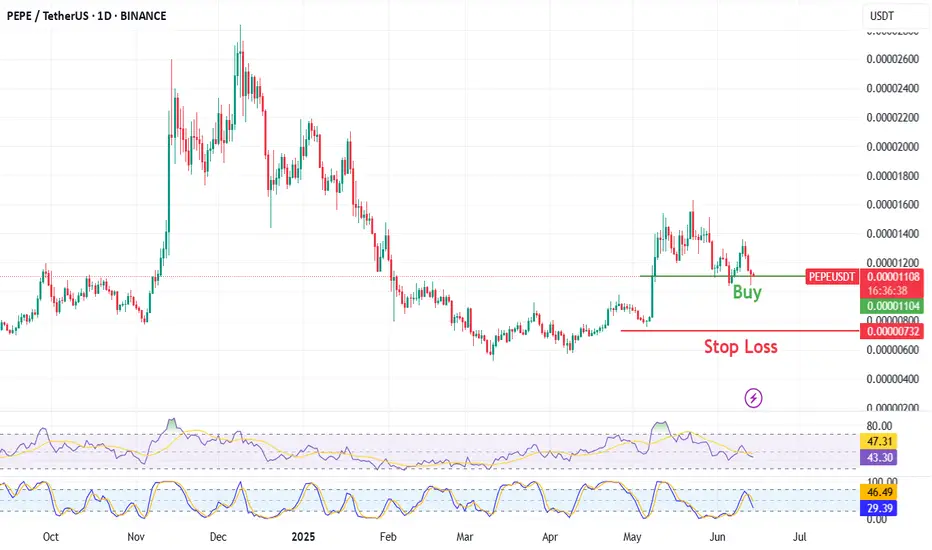
PEPE/USDTPEPE/USDT is looks good for buy it is showing retracement on daily chart and the 4hr chart also showing a good bullish divergence
Key pressure range of gold price: 3440-3450Key pressure range of gold price: 3440-3450
At the weekend, let's analyze the macro trend of gold.
As shown in Figure 4h.
The orange channel clearly and accurately presents the macro trend of gold price in the past year.
It is a very interesting price. The current gold price is running around 3450, which is close to the top pressure range of the macro trend.
For this reason, we did not hesitate to short in the 3440-3445 range on Friday, and then took profits in the 3430-3425 range. This is the first opportunity to touch the pressure level of the annual trend channel, which is a perfect intraday strategy.
Therefore, now we extend the expectation of gold price next week through trend extension and point extension:
Expected increase: 3600
Expected decrease: 3250
Current price: 3432
It is very interesting that: (3600+3250)/2=3425
That is to say, the performance of gold price next week will fluctuate in the range of 3420-3430.
As geopolitical tensions in the Middle East intensify over the weekend, gold prices may continue to benefit from risk aversion next week. It is expected that gold prices will target $3,500/ounce at the beginning of next week. Factors such as the Fed's decision and Powell's speech during the week will also have an impact on gold prices. In addition, US President Trump will visit Canada from June 15 to 17 to attend the G7 summit. His speech at that time may also affect gold price fluctuations, which is worth paying attention to.
Intraday operation suggestions: mainly long on dips, supplemented by short at highs;
Support level focuses on the 3395-3400 area;
Pressure level focuses on the 3440-3450 area.
1: As long as the gold price is above $3,400, the gold price will adopt a low-price long strategy, and the stop loss is set at 3390.
2: As long as the gold price is below 3,450, the gold price will adopt a short strategy, and the stop loss is set at 3,460.
Steady operation suggestions: give up shorting and only focus on long opportunities.
Radical suggestion: intraday trading, with a profit target of 10 points, both long and short positions can be tried, strictly follow the above 12 strategies

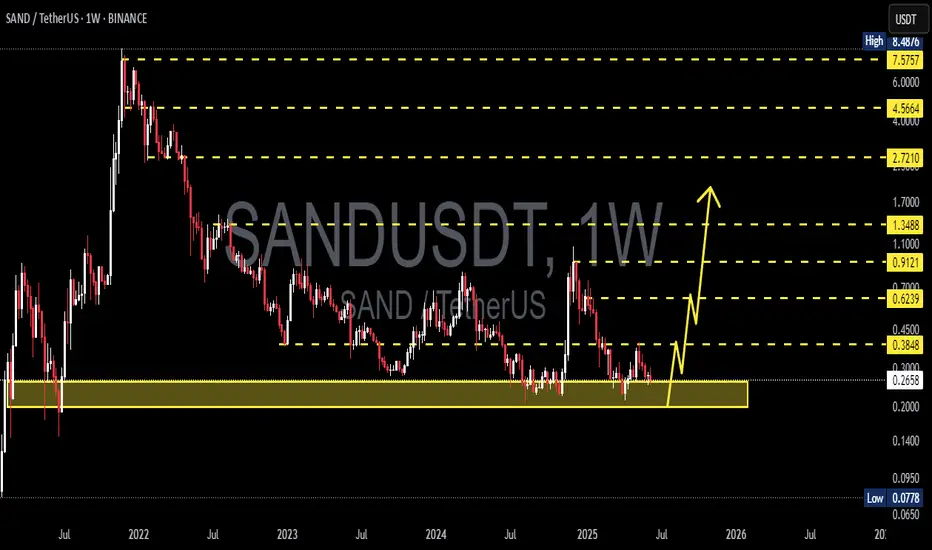
SANDUSDT 1W AnalysisSAND ~ 1W Analysis
#SAND Buy back gradually from here if you still have confidence in this coin with a short term target of at least 20%+ from this support.
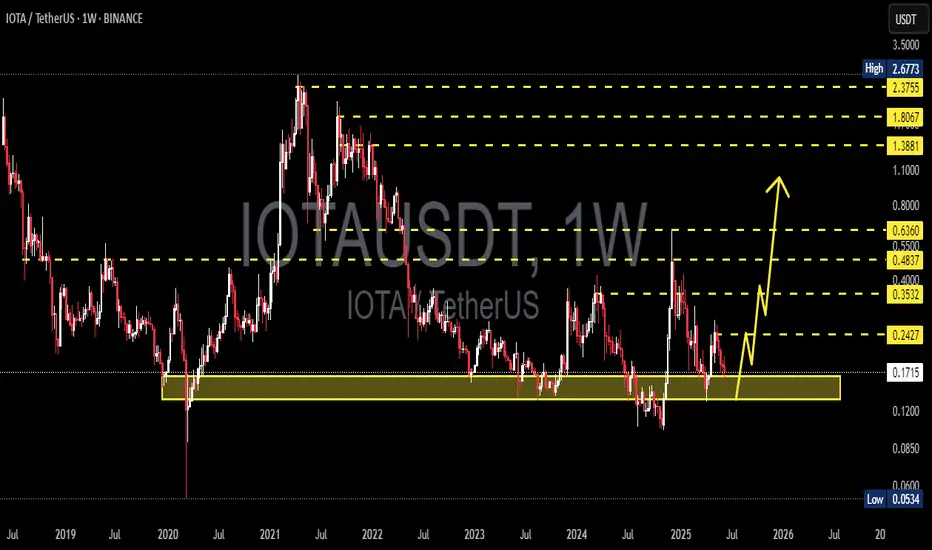
IOTAUSDT 1W AnalysisIOTA ~ 1W Analysis
#IOTA Buy back gradually from here if you still have confidence in this coin with a short term target of at least 20%+ from here.

ONEUSDT 5D AnalysisONE ~ 5D Analysis
#ONE Buy back gradually from here if you still have confidence in this coin with a short term target of at least 20%+ from this support.

ERNUSDT / EPICUSDT 5D Analysis ERN / EPIC ~ 5D Analysis
#ERN / #EPIC This is the lowest support for now. Buy if you still have confidence in this coin with a short term target of at least 20%+ from this support.

FARTCOIN - The air is heavy and not smellyFartCoin moves are to be there when fall is done at bottom and moves from there at top, but moves are very to be seen soon!

LUNCUSDT - A Move again?LUNC moves are marked by red and purple, purple is something to be really best to buy, red is just a forced move!

SXPUSDT 1W AnalysisSXP ~ 1W Analysis
#SXP This trade is very high risk. Buy if you still have confidence in this coin with a short term target of at least 20%+ from this support.

SoL for SOUL - A small scalp!!Scalps are always the best to take easy money, as precendted this is the thing to lookout for!

Is USTC going to just die again?The moves of USTC really moved in a swift motion, however I would like to say in this manner where as shown and is shown in red as given

BTC - Where it is heading to? Owing to the recent war scenario's the market has taken a slump, seeing pattern its a bearish stance where a pull back down is emminent (means to fall down as drawn in blue) but as its retracing all the move after its fall, expecting a sweep moves to the top as mentioned. till 108k

Solana bottom and mid range pullback before new highs?SPX likely to go for new highs, BTC and crypto will follow, Solana is ready to outperform

WULF / 2hAs well anticipated, NASDAQ:WULF continued to decline by 6.9% today and closed the week with a 14.6% market sell-off. Now, a decline of 14.4% would lie ahead to complete the structure of the thorough correction in wave b(circled) in a three-wave sequence >> (a)(b)(c) flat formation.
The Retracement Targets >> 3.45 >> 3.20
#CryptoStocks #WULF #BTCMining #Bitcoin #BTC

CLSK / 2hAs anticipated, NASDAQ:CLSK continued to sell off >> 6% today and closed the week with an 11% decline in total. Now 16% is left to complete the structure of the entire correction in wave ii(circled) in a three-wave sequence >> (w)(x)(y).
The Retracement Targets >> 7.93 >> 7.84
#CryptoStocks #CLSK #BTCMining #Bitcoin #BTC

RIOT / 2hAccording to the prior analysis, NASDAQ:RIOT continued to sell off 6.8% today and closed the week with an 11% decline in total.
Wave Analysis >> The rising leading diagonal in wave (1) ended with a diagonal as its 5th wave inside at 10.86. Its correction in the same-degree wave (2) has started its way down toward the origin of the ending diagonal >> 7.93.
Trend Analysis >> The trend has turned to correcting down. It might be a relatively deep retracement that will take a few weeks to develop.
The retracement targets >> 8.20 >> 7.93 >> 7.67
#CryptoStocks #RIOT #BTCMining #Bitcoin #BTC

BITCOINThe Federal Reserve is likely to interpret the June 2025 University of Michigan (UoM) consumer sentiment and inflation expectations data as mixed but cautiously encouraging, with implications for monetary policy:
Key Data Points
Consumer Sentiment: 60.5 (vs. 53.5 forecast, prior 52.2) – a sharp rebound to the highest level since mid-2023.
1-Year Inflation Expectations: 5.1% (vs. 6.6% prior) – a significant decline, nearing pre-tariff levels.
Fed Interpretation
Improved Consumer Sentiment:
The jump to 60.5 signals renewed optimism about the economy, likely driven by reduced trade tensions (e.g., tariff pauses) and stable labor markets. This aligns with recent upward revisions to April and May sentiment data.
The Fed will view this as a sign of economic resilience, reducing urgency for near-term rate cuts to stimulate growth.
Sharply Lower Inflation Expectations:
The drop to 5.1% (from 6.6%) aligns with the New York Fed’s May 2025 survey showing declining inflation expectations across all horizons.
This suggests consumers are growing more confident that the Fed’s policies (and tariff adjustments) are curbing price pressures, easing fears of a wage-price spiral.
Policy Implications:
Dovish Tilt Supported: Lower inflation expectations reduce the risk of entrenched price pressures, giving the Fed flexibility to cut rates later in 2025 if growth slows.
No Immediate Cuts Likely: Strong sentiment and a resilient labor market (unemployment at 4.2%) justify maintaining rates at 4.25–4.50% in July.
Focus on Tariff Risks: The Fed will remain cautious about potential inflation rebounds from Trump’s tariffs, which could add 1.5% to prices by late 2025.
Market Reactions
DXY (Dollar Index): Likely to dip modestly as lower inflation expectations boost rate-cut bets, but sentiment-driven growth optimism may limit losses. Key support at 98.00–98.20.
Bonds: 10-year yields may edge lower (toward 4.00%) on reduced inflation fears, though strong sentiment could cap declines.
Equities: Stocks (especially consumer-discretionary sectors) may rally on improved economic outlook.
Conclusion
The Fed will likely view this data as validating its cautious stance: inflation expectations are cooling, but strong sentiment and labor markets argue against premature easing. A September rate cut remains the base case, contingent on continued disinflation and no tariff-driven price spikes. Traders should watch for June CPI (July 11) and Q2 GDP to confirm trends.
#bitcoin #dollar

The FVG above isn’t the target. It’s the bait.This is a classic Smart Money sequence. Most are watching the imbalance at 106.5k–108.7k and expecting immediate delivery. But that’s not how this game works.
The setup:
Price broke down violently, then reversed with momentum — stopping right beneath the daily FVG block. That alone tells me it’s not ready. It’s gathering.
Below? Multiple fib levels that haven’t been tested — 104.4k (0.236), 102.6k (0.0), and a volume-backed rejection wick that still holds weight.
The market is likely to dip again — pull into deeper discount, reset the low timeframe narrative — and only then attack the FVG and upper sweep zones.
What I expect:
Sweep of 102.6k (final liquidity run)
Reaction → reclaim 104.4k
Push into the FVG toward 106.5k (0.5) and possibly 107.4k (0.618)
No emotional reaction to the red candles — this is structure playing out, not weakness unfolding.
Plan:
Ideal Entry: 102.8k–103.2k range
SL: Below 102.6k
TP1: 105.6k
TP2: 107.4k
Final: 108.7k clean inefficiency fill
Let it dip. Let it breathe. That’s where conviction is built.
Final thought:
“The real move starts when they convince you it’s done.”
