Gold Prices Pull Back Amid Profit-Taking and Unchanged Fed ratesMacro approach:
- Gold prices have recently pulled back as investors took profits at elevated levels to offset losses elsewhere amid rising geopolitical tensions in the Middle East and steady Fed holding rates.
- Speculation is mounting that the US may involve into the Middle East conflicts, raising fears of a broader regional tensions.
- Meanwhile, a dovish Fed outlook signaling two potential rate cuts this year and concerns over growing US debt continues to provide underlying support for gold prices.
Technical approach:
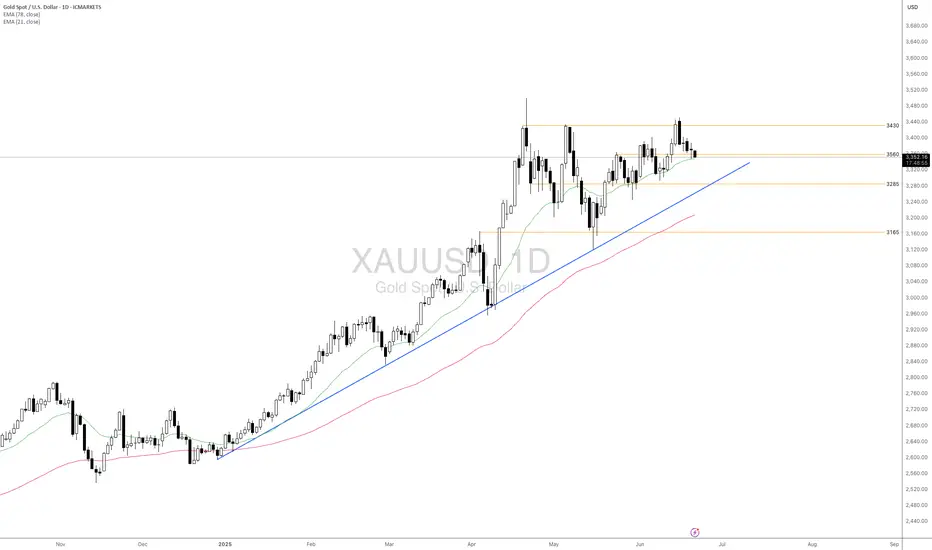
- XAUUSD is retesting EMA21, and the support level is around 3560. The price is above both EMAs, indicating that the upward momentum is intact.
- If XAUUSD closes below EMA21, it may continue to plunge and retest the following support at 3285, which is the confluence with the ascending trendline.
- On the contrary, remaining above 3560 may prompt a potential retest of the key resistance at around 3430.
Analysis by: Dat Tong, Senior Financial Markets Strategist at Exness
Harmonic Patterns
$COIN 30% Pullback Confirms if we Fakeout Recent 15%+ Rally 🧨 COIN SHORT TRADE IDEA — FAKEOUT TRAP IN PLAY
Ticker: NASDAQ:COIN
Date: June 20, 2025
Thesis: Breakout trap setup — expecting a rug pull / red reversal tomorrow to confirm.
🔍 Context
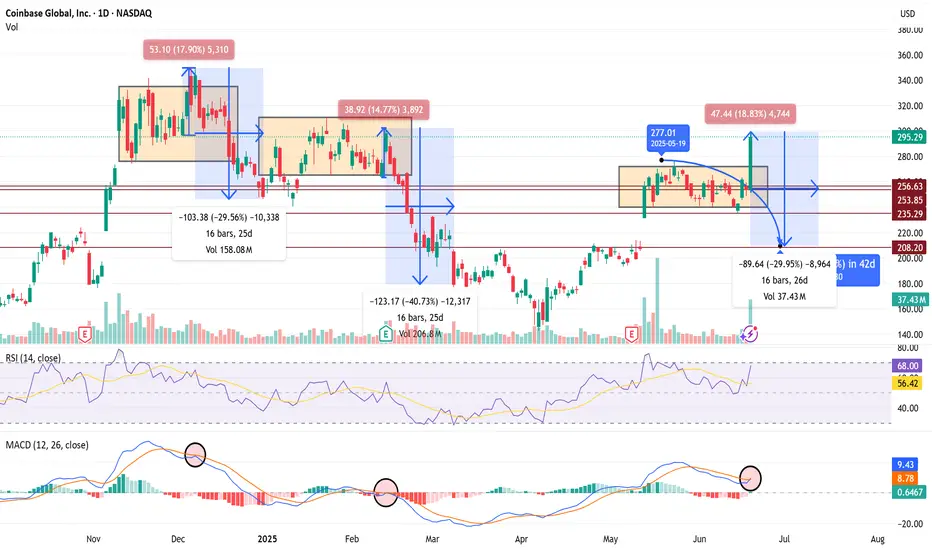
Price broke above range today with a big +18.8% candle to $295 — but...
Volume spike may signal exhaustion, not strength.
RSI = 68 → near overbought
MACD curling into a bearish cross — same signal preceded the last -30% and -40% drawdowns.
History: Same range-break setups in Dec and Feb collapsed hard (-30 to -40%) over 16–25 days.
💣 Trade Plan (Short Setup)
Entry Trigger:
🔻 Enter short if price closes below $277 tomorrow — confirms breakout trap.
Targets:
🎯 Target 1: $253 (top of old range)
🎯 Target 2: $235 (mid-range support)
🎯 Target 3: $208 (full breakdown move, matches last 2 cycles)
Stop Loss:
🛑 Above $297 (breakout highs)
Timeframe:
1–3 weeks (16–26 bars historically)
🧠 Bias
Bearish unless bulls hold $280+. If we get a big red daily candle tomorrow, fakeout confirmed — high-probability follow-through expected.
Xauusd Still on bearish mode towards 3330H4 Timeframe Analysis
Gold is currently holding the falling wedge pattern on H4 and Range of 3330-3380 .im still expecting one more Drop then Upside move.Last sell trade is successfully 280 pips TP Hit
if gold sustained with this falling wedge pattern with drop of Accumulation behaviour if market remains bearish my 1st target is 3330 then 3320 on intraday.i
3325-3320 is the optimal structural support below area and potential buyying area ,if The H4 & H1 candle closes above 3330-3332 I will took buy and my Targets will be 3350 then 3365.
#XAUUSD

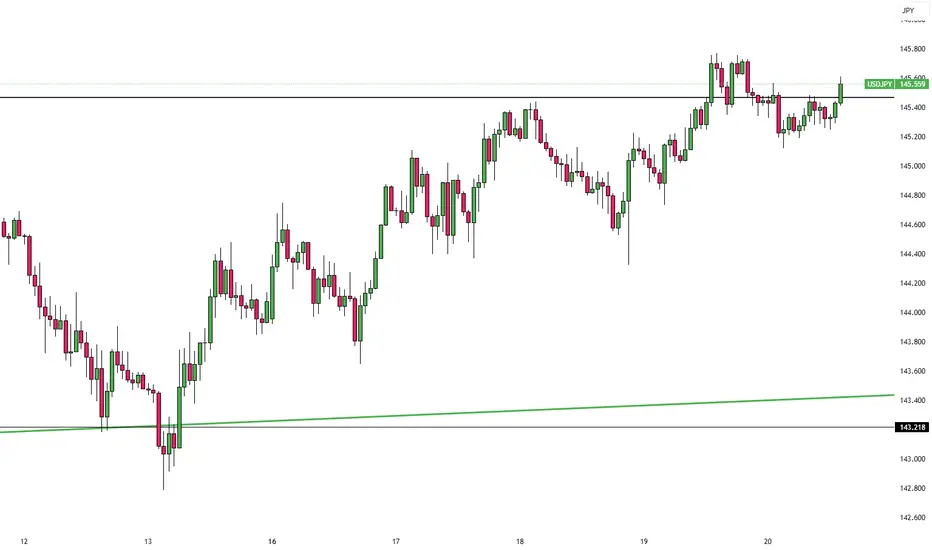
Yen Edges Higher as Inflation SurgesThe Japanese yen traded stronger near 145 per dollar, rebounding as Japan’s core inflation rose for the third straight month to 3.7%, its highest since January 2023. The data strengthens expectations that the Bank of Japan may continue policy tightening.
Earlier in the week, the BOJ held rates at 0.5% but highlighted how rising wages are being passed on to consumers, keeping inflation elevated. Governor Kazuo Ueda emphasized a data-driven path forward, keeping the door open for more hikes if needed.
The key resistance is at $145.30, while the major support is located at $142.50.
CHECK BTCUSD SIGNAL READ CAPTAINbtcusd buy now ✅
entry point (106.000) (105.900)
TAKE PROFIT 1: (106.300)
TAKE PROFIT 2: (106.800)
LAST TARGET (107.200)
STOP LOSS (105.550)


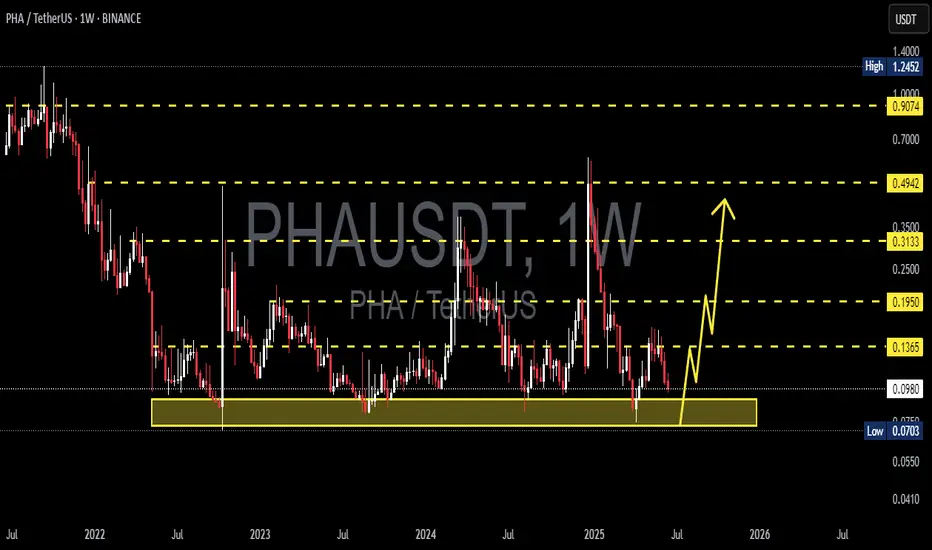
PHAUSDT 1W AnalysisPHA ~ 1W Analysis
#PHA Buy back on retest of this support block with short term target of at least 20%+ from this support.
SEIUSDT.P LONGI think we got manipulated to make the rounding support.
The price is recovering nicely to enter in the rounded support.
We can long it now.
The market is very volatile due to geopolitical issues.
Only risk 1 or 2% of the capital.
The setups with the tps are mentioned
DYOR

Today's crude oil trading strategy, I hope it will be helpful to Crude Oil Trend Analysis
(1) Geopolitics: Tensions Propel Oil Price Expectations
The Middle East has long been a "powder keg" for the crude oil market, and recent developments have intensified tensions. Military conflicts between Iran and Israel continue to escalate—Iran’s latest attacks injured approximately 50 people in Israel. Controlling the Strait of Hormuz, through which 30% of global seaborne crude oil passes, Iran’s strategic position is pivotal. After the conflict escalated, Iran threatened to block the strait, instantly igniting international oil prices. Brent crude surged to around $79 per barrel. As long as the conflict persists, market fears of crude supply disruptions—like an invisible hand—will continue to underpin price gains.
(2) Supply Side: Interplay of Production Increases and Geopolitical Risks
OPEC+ previously announced plans to increase production by 411,000 barrels per day, but actual output growth has fallen short of market expectations. With current Middle East tensions, the feasibility of this plan remains uncertain. If Iran’s crude production and exports are constrained by the conflict, global supply could tighten. In the U.S., shale oil production remains unstable, affected by technical, cost, and policy factors. Thus, the supply side is fraught with uncertainty: production increase expectations may exert downward pressure on prices, while geopolitical risks could tighten supply outlooks and push prices higher.
(3) Demand Side: Battle Between Seasonality and Economic Prospects
From a seasonal perspective, the northern hemisphere’s summer travel peak has boosted demand for petroleum products like gasoline and jet fuel. Data from the U.S. Energy Information Administration (EIA) shows U.S. crude oil inventories have declined for several consecutive weeks, indicating rising market demand. However, the global economic environment remains bleak: trade protectionism, tariff policies, and other factors have slowed global growth, constraining crude demand. Major economies like China and Europe have failed to meet oil demand projections. Thus, the demand side is torn: seasonal factors provide support, but economic headwinds act as a drag.
Today's crude oil trading strategy, I hope it will be helpful to you
USOIL BUY@72.5~73
SL:71.5
TP:74~75

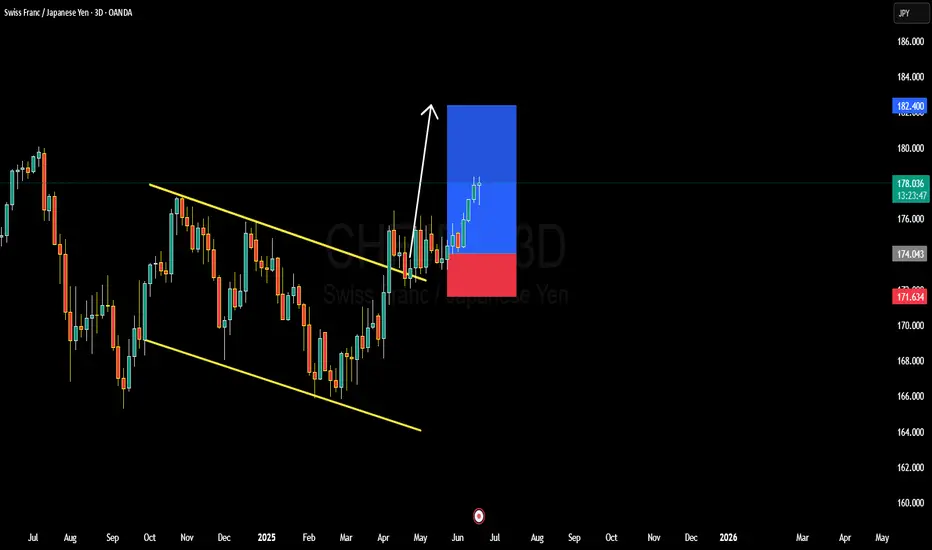
CHFJPY BULLISH OR BEARISH DETAILED ANALYSISCHFJPY has continued to play out exactly as forecasted, breaking out cleanly from the descending channel on the 3D timeframe and rallying strongly above key structure. Price is currently trading around 178.00, already delivering solid upside from the breakout zone. The bullish breakout was confirmed by consecutive impulsive candles with minimal retracement, a clear sign of institutional strength behind this move. As long as this momentum holds, the next major target is 182.00 – a psychological level and previous structure high, now acting as a magnetic zone for price.
On the fundamental side, the Swiss Franc continues to enjoy safe-haven flows as global macro uncertainty persists. The Swiss National Bank has maintained a relatively tight stance, with inflation staying stable and CHF demand picking up. On the flip side, the Japanese Yen remains broadly weak due to ultra-loose monetary policy from the Bank of Japan. BOJ’s reluctance to shift away from yield curve control and negative interest rates makes JPY one of the most attractive funding currencies, driving consistent CHFJPY upside.
Technically, this move is supported by a textbook breakout from a falling wedge pattern, which historically has a high probability of bullish continuation. The volume and momentum on the breakout were strong, and we have a clean higher high and higher low structure forming. This confirms the end of the correction phase and a transition into a trending bullish cycle. With the current risk sentiment leaning toward CHF strength and JPY weakness, I’m confident in further upside toward my 182.000 target.
I’ll continue to trail stops below 174.00 to lock in profit while giving the trade room to breathe. If price consolidates near 179.50–180.00 with low volume, I may look for re-entry setups on pullbacks. As of now, CHFJPY remains one of the strongest trending pairs on the board, and I’ll stay long as long as the structure holds.
Today's BTC trading strategy, I hope it will be helpful to youBitcoin prices have fluctuated frequently in recent days, presenting a complex landscape. Looking at price data from the past week, Bitcoin has seen significant volatility. On June 13, triggered by Israel's airstrikes on Iran that escalated tensions in the Middle East, Bitcoin hit a low of $102,614 per coin—edging close to the $100,000 threshold. As of June 20, Bitcoin hovered around $104,500. While this represents a rebound from the recent low, prices remain relatively unstable, reflecting intense battles between bulls and bears with no clear trend established.
Reviewing this year's price trajectory, Bitcoin fell below $40,000 per coin at the start of 2025 before launching a robust rally. In less than a year, prices more than doubled, briefly hitting $99,000 per coin to set a new all-time high. Recent volatility can be seen as a correction after the prior surge—a common occurrence in crypto markets, typically a process where the market digests earlier gains and seeks a new price equilibrium.
Global macroeconomic conditions and shifts in crypto regulatory policies significantly impact Bitcoin prices. Continuously monitor the Federal Reserve's monetary policy stance: if the Fed signals rate cuts or implements easing, increased market liquidity may fuel Bitcoin's rally, warranting appropriate long position additions. Conversely, if the Fed hikes rates or maintains a hawkish stance, exercise caution and consider reducing positions. Meanwhile, track global crypto regulatory dynamics: positive policies from more countries can strengthen long positions, while signals of regulatory tightening require prompt strategy adjustments and position reductions to mitigate risks. Additionally, stay attuned to market sentiment and investor psychology to avoid herd behavior.
In Bitcoin's complex and volatile environment, long strategies must be flexibly adjusted. Investors should align with their risk tolerance and investment objectives, strictly implement strategies, and strive to maximize returns while minimizing risks.
Today's BTC trading strategy, I hope it will be helpful to you
BTCUSDT BUY@103000~104000
SL:102000
TP:105000~106000

EURUSD H1 I Bearish Reversal Based on the H1 chart, the price is rising toward our sell entry level at 1.1548, a pullback resistance that aligns with the 50% Fib retracement and the 127.25 Fib extension, providing a significant level for a potential bearish reversal.
Our take profit is set at 1.1487, a pullback support.
The stop loss is set at 1.1602, a swing high resistance.
High Risk Investment Warning
Trading Forex/CFDs on margin carries a high level of risk and may not be suitable for all investors. Leverage can work against you.
Stratos Markets Limited (tradu.com ):
CFDs are complex instruments and come with a high risk of losing money rapidly due to leverage. 63% of retail investor accounts lose money when trading CFDs with this provider. You should consider whether you understand how CFDs work and whether you can afford to take the high risk of losing your money.
Stratos Europe Ltd (tradu.com ):
CFDs are complex instruments and come with a high risk of losing money rapidly due to leverage. 63% of retail investor accounts lose money when trading CFDs with this provider. You should consider whether you understand how CFDs work and whether you can afford to take the high risk of losing your money.
Stratos Global LLC (tradu.com ):
Losses can exceed deposits.
Please be advised that the information presented on TradingView is provided to Tradu (‘Company’, ‘we’) by a third-party provider (‘TFA Global Pte Ltd’). Please be reminded that you are solely responsible for the trading decisions on your account. There is a very high degree of risk involved in trading. Any information and/or content is intended entirely for research, educational and informational purposes only and does not constitute investment or consultation advice or investment strategy. The information is not tailored to the investment needs of any specific person and therefore does not involve a consideration of any of the investment objectives, financial situation or needs of any viewer that may receive it. Kindly also note that past performance is not a reliable indicator of future results. Actual results may differ materially from those anticipated in forward-looking or past performance statements. We assume no liability as to the accuracy or completeness of any of the information and/or content provided herein and the Company cannot be held responsible for any omission, mistake nor for any loss or damage including without limitation to any loss of profit which may arise from reliance on any information supplied by TFA Global Pte Ltd.
The speaker(s) is neither an employee, agent nor representative of Tradu and is therefore acting independently. The opinions given are their own, constitute general market commentary, and do not constitute the opinion or advice of Tradu or any form of personal or investment advice. Tradu neither endorses nor guarantees offerings of third-party speakers, nor is Tradu responsible for the content, veracity or opinions of third-party speakers, presenters or participants.

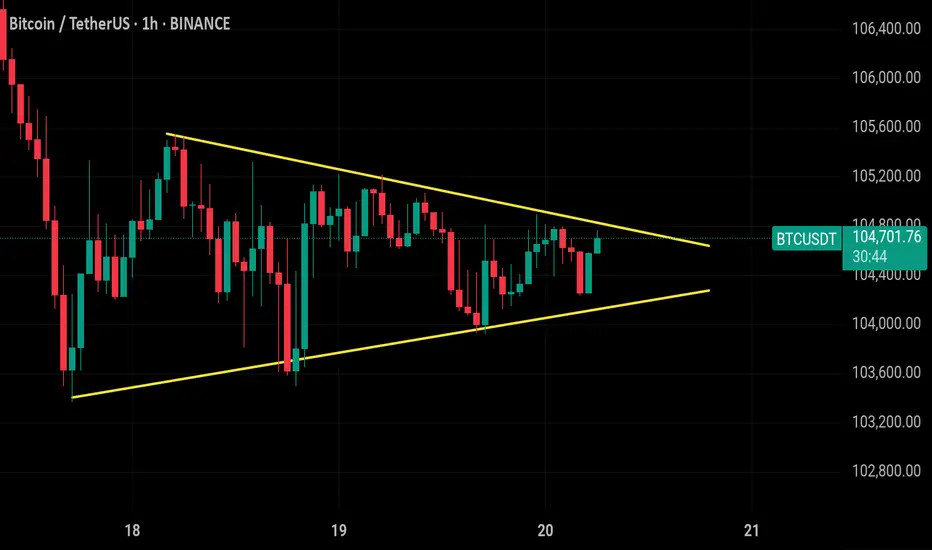
#Bitcoin ( $BTC/USDT ) is forming a symmetrical triangle on the #Bitcoin ( $BTC/USDT ) is forming a symmetrical triangle on the 1H chart, with strong support near 103,800 and resistance around 105,100. Price is consolidating tightly, indicating a breakout is near. A bullish breakout above 105,500 could target 110,000, while a breakdown below 103,500 may lead to a drop toward 102,000. Key invalidation lies at 103,500. Wait for volume confirmation before entering —
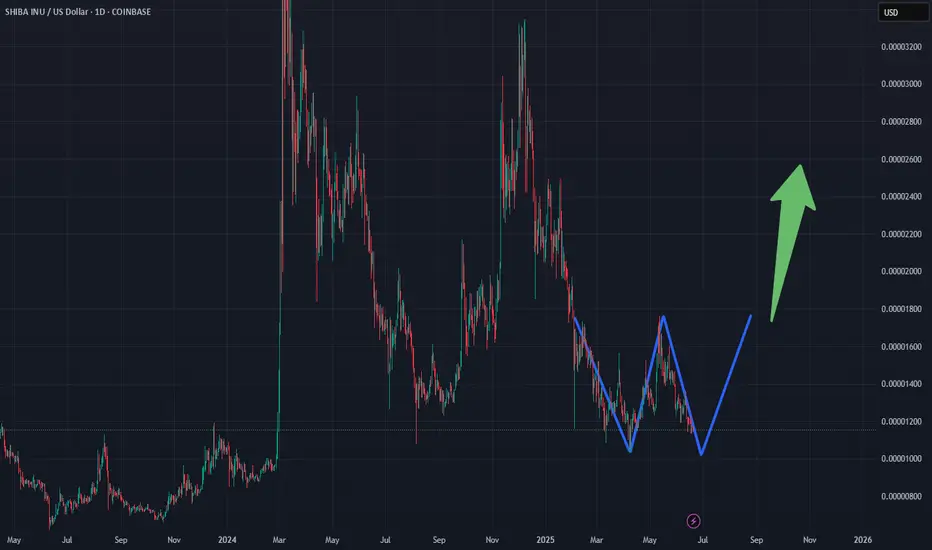
WATCH SHIBThis could be setting up for a
nice rounded double bottom
pattern. Keep watch on SHIB
and I would strongly DCA in at
this key level. We could be
forming a very powerful W pattern
long term...So stay vigilant and
watch for the dips. Even if we went
to all time LOWS you would only be
down 48%...so suck it up and DCA
in at these levels. Trust me...you'll
thank me later when SHIB does an
800x buy end of this bull cycle. BAM!
********** HAPPY SHIB HUNTING **********
Gold hits bottom again and is waiting to reboundAs of today, Friday, gold is still fluctuating and adjusting in the lower range, but from the 4-hour market trend, the gold trend is still dominated by bulls. In the short term, gold fluctuates at a low level. Today, Friday, we will first focus on the support level of 3347-53 below, which is also the starting point of the rebound yesterday. If this position is not broken today, Friday, we will mainly focus on the rebound and bullish closing. From the 4-hour analysis, the support below focuses on 3347-53, and the short-term resistance above focuses on the 3380-83 level. Focus on the suppression of 3408-3415. Continue to rely on this range to maintain the main tone of high-altitude low-multiple cycle participation. In the middle position, watch more and move less and be cautious in chasing orders, and wait patiently for key points to enter the market.
Gold operation strategy:
Go long on gold when it falls back to 3347-53, stop loss 3338, target 3380-3383, and look at 3408-15 if it breaks;

ABC Bullish Hello awesome traders, hope you're having a great week!
We’ve got a clean ABC bullish setup unfolding beautifully on EURUSD 4H:
🔶 Pattern: ABC Bullish
🕓 Timeframe: 4H
⚡️ Structure: AB=CD completion at 61.8% with PRZ confluence
📍 Entry Level: 1.15058 (confirmed breakout + retest)
🎯 Target 1: 1.16006 (AB=CD)
🎯 Target 2: 1.16561 (extended projection)
🛑 Invalidation: Below 1.13717 (D-point)
Technical Highlights:
✅ 61.8% retracement support at D
✅ 78.6% BC retracement
✅ Price bounced cleanly and is consolidating above EL
✅ Momentum build above structure, higher lows in play
📊 Watching for continuation toward 1.1600 and beyond if structure holds.
Trade smart, protect capital, and let the pattern do the work!

Xauusd market update This chart shows the Gold Spot vs. U.S. Dollar (XAU/USD) on the 2-hour timeframe, and it's suggesting a potential bullish breakout setup based on the following elements:
---
📊 Chart Analysis Summary:
🔷 Pattern Formed:
A falling wedge pattern has developed (highlighted in the final descending channel).
Falling wedges are typically bullish reversal patterns, especially when formed after a downtrend.
🔽 Prior Movement:
The price initially rose in an upward channel until around June 16.
After that, a corrective downtrend began, forming the wedge.
📈 Current Action:
The wedge is narrowing, and the price appears to be consolidating near support, with the potential to break out upward soon.
The upward arrow and shaded box indicate the projected target zone if a breakout occurs.
🎯 Target Levels:
If a breakout happens, the target range is marked between ~3,466.83 and ~3,537.17.
This is in line with the height of the wedge projected from the breakout point.
---
🧭 Key Support & Resistance:
Support levels: 3,327.707 → 3,304.348 → 3,264.135
Resistance levels: 3,466.831 → 3,511.496 → 3,537.167
---
🔔 Indicators & Signals:
The purple lightning bolt and U.S. flag icons likely denote upcoming economic events/news, which could act as catalysts for volatility and breakout confirmation.
---
📌 Conclusion:
This setup suggests bullish momentum could be building, especially if price breaks above the wedge’s upper trendline with volume. If confirmed, it may rally toward the 3,466–3,537 resistance area.
---
Would you like a detailed trade plan (entry, stop-loss, take-profit), or are you analyzing this setup for educational purposes?

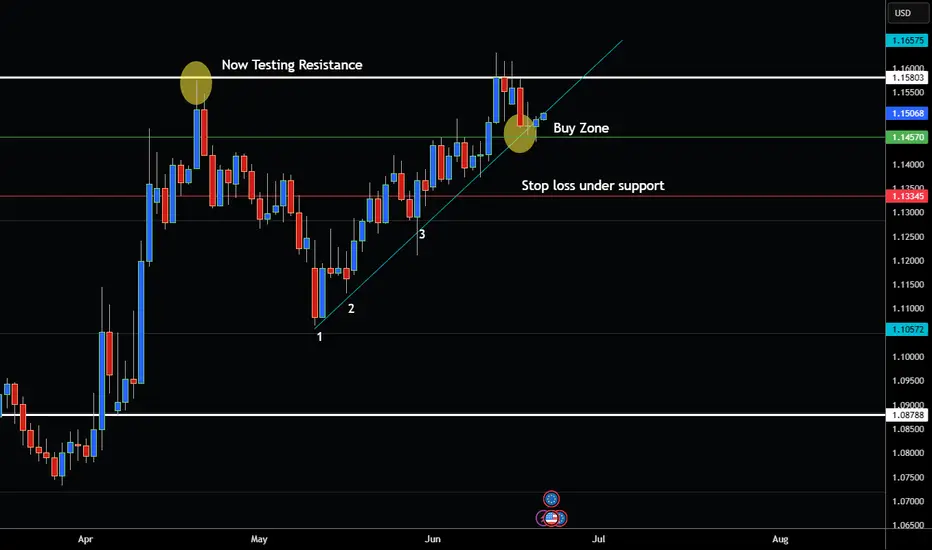
EUR/USD NOW IN BUY ZONE!Looking very bullish Plus bounced off support recently at 1.457.
However watch out for resistance at 1.158 it could pause, reverse or break through.
Of course daily close above resistance would be a very strong bullish trend continuation sign.
Always use Risk Management!
(Just in case your wrong in your analysis most experts recommend never to risk more than 2% of your account equity on any given trade.)
Hope This Helps Your Trading 😃
Clifford
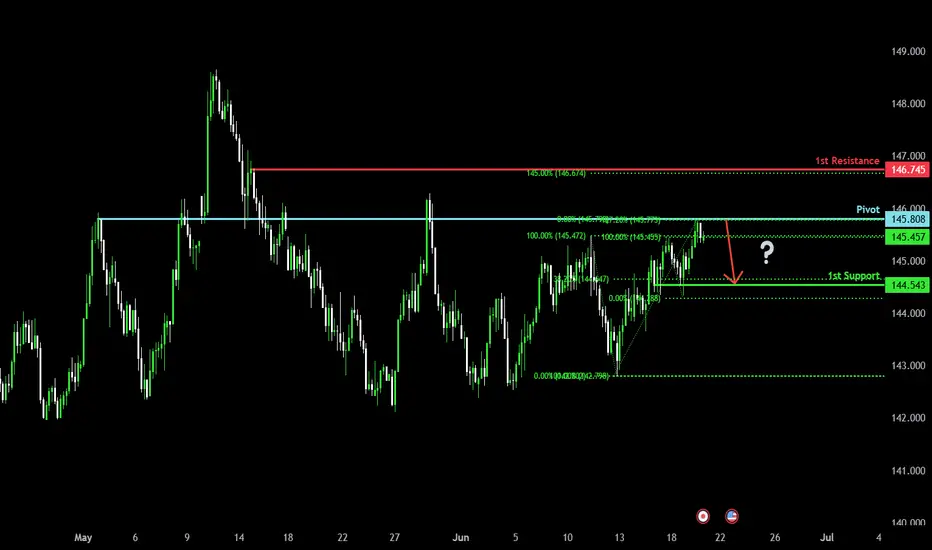
Bearish reversal?USD/JPY has reacted off the pivot and could drop to the 1st support which is a pullback support.
Pivot: 145.80
1st Support: 144.54
1st Resistance: 146.74
Risk Warning:
Trading Forex and CFDs carries a high level of risk to your capital and you should only trade with money you can afford to lose. Trading Forex and CFDs may not be suitable for all investors, so please ensure that you fully understand the risks involved and seek independent advice if necessary.
Disclaimer:
The above opinions given constitute general market commentary, and do not constitute the opinion or advice of IC Markets or any form of personal or investment advice.
Any opinions, news, research, analyses, prices, other information, or links to third-party sites contained on this website are provided on an "as-is" basis, are intended only to be informative, is not an advice nor a recommendation, nor research, or a record of our trading prices, or an offer of, or solicitation for a transaction in any financial instrument and thus should not be treated as such. The information provided does not involve any specific investment objectives, financial situation and needs of any specific person who may receive it. Please be aware, that past performance is not a reliable indicator of future performance and/or results. Past Performance or Forward-looking scenarios based upon the reasonable beliefs of the third-party provider are not a guarantee of future performance. Actual results may differ materially from those anticipated in forward-looking or past performance statements. IC Markets makes no representation or warranty and assumes no liability as to the accuracy or completeness of the information provided, nor any loss arising from any investment based on a recommendation, forecast or any information supplied by any third-party.
GOLD Sell Setup – Bearish Reversal from Supply ZoneGold (XAUUSD) is trading within a well-defined supply zone around the 3369 – 3370 area. After multiple failed attempts to break above this resistance, price is showing signs of reversal. The structure indicates a bearish move is likely, especially if the market sustains below the sell zone.
---
🔍 Technical Analysis:
Sell Zone: 3369 – 3370
The price has entered a strong resistance zone and is currently rejecting this level, indicating selling pressure.
Stop Loss: 3428.42
A break above this level would invalidate the bearish bias.
Take Profit Levels:
TP1: 3324.81
TP2: 3246.26
TP3: 3167.64
Target Zone: Around 3120, which aligns with a previous demand area on the chart.
Market Behavior:
The lower highs and resistance rejection pattern on the 4H chart suggests weakness in bullish momentum. If price breaks below the most recent support, it may trigger acceleration toward lower targets.
---
📌 Trade Plan:
Enter short positions around 3369
Set SL above 3428
Aim for stepwise profit-taking on each support break
Risk-to-reward ratio remains favorable with proper lot size
---
Conclusion:
Gold is respecting a critical resistance zone, and a bearish continuation is expected if price holds below it. Patience and confirmation on lower timeframes will strengthen the setup. Ideal for swing traders targeting medium-term downside.

Potential bullish rise?The Cable (GBP/USD) has bounced off the pivot which is an overlap support and could rise to the 1st resistance.
Pivot: 1.3403
1st Support: 1.3319
1st Resistance: 1.3517
Risk Warning:
Trading Forex and CFDs carries a high level of risk to your capital and you should only trade with money you can afford to lose. Trading Forex and CFDs may not be suitable for all investors, so please ensure that you fully understand the risks involved and seek independent advice if necessary.
Disclaimer:
The above opinions given constitute general market commentary, and do not constitute the opinion or advice of IC Markets or any form of personal or investment advice.
Any opinions, news, research, analyses, prices, other information, or links to third-party sites contained on this website are provided on an "as-is" basis, are intended only to be informative, is not an advice nor a recommendation, nor research, or a record of our trading prices, or an offer of, or solicitation for a transaction in any financial instrument and thus should not be treated as such. The information provided does not involve any specific investment objectives, financial situation and needs of any specific person who may receive it. Please be aware, that past performance is not a reliable indicator of future performance and/or results. Past Performance or Forward-looking scenarios based upon the reasonable beliefs of the third-party provider are not a guarantee of future performance. Actual results may differ materially from those anticipated in forward-looking or past performance statements. IC Markets makes no representation or warranty and assumes no liability as to the accuracy or completeness of the information provided, nor any loss arising from any investment based on a recommendation, forecast or any information supplied by any third-party.

Bullish bounce off pullback support?The Fiber (EUR/USD) has bounced off the pivot and could rise to the 1st resistance.
Pivot: 1.1444
1st Support: 1.1369
1st Resistance: 1.1587
Risk Warning:
Trading Forex and CFDs carries a high level of risk to your capital and you should only trade with money you can afford to lose. Trading Forex and CFDs may not be suitable for all investors, so please ensure that you fully understand the risks involved and seek independent advice if necessary.
Disclaimer:
The above opinions given constitute general market commentary, and do not constitute the opinion or advice of IC Markets or any form of personal or investment advice.
Any opinions, news, research, analyses, prices, other information, or links to third-party sites contained on this website are provided on an "as-is" basis, are intended only to be informative, is not an advice nor a recommendation, nor research, or a record of our trading prices, or an offer of, or solicitation for a transaction in any financial instrument and thus should not be treated as such. The information provided does not involve any specific investment objectives, financial situation and needs of any specific person who may receive it. Please be aware, that past performance is not a reliable indicator of future performance and/or results. Past Performance or Forward-looking scenarios based upon the reasonable beliefs of the third-party provider are not a guarantee of future performance. Actual results may differ materially from those anticipated in forward-looking or past performance statements. IC Markets makes no representation or warranty and assumes no liability as to the accuracy or completeness of the information provided, nor any loss arising from any investment based on a recommendation, forecast or any information supplied by any third-party.

Bullish bounce?US Dollar Index (DXY) is falling towards the pivot and could bounce to the 1st resistance.
Pivot: 98.48
1st Support: 97.62
1st Resistance: 99.47
Risk Warning:
Trading Forex and CFDs carries a high level of risk to your capital and you should only trade with money you can afford to lose. Trading Forex and CFDs may not be suitable for all investors, so please ensure that you fully understand the risks involved and seek independent advice if necessary.
Disclaimer:
The above opinions given constitute general market commentary, and do not constitute the opinion or advice of IC Markets or any form of personal or investment advice.
Any opinions, news, research, analyses, prices, other information, or links to third-party sites contained on this website are provided on an "as-is" basis, are intended only to be informative, is not an advice nor a recommendation, nor research, or a record of our trading prices, or an offer of, or solicitation for a transaction in any financial instrument and thus should not be treated as such. The information provided does not involve any specific investment objectives, financial situation and needs of any specific person who may receive it. Please be aware, that past performance is not a reliable indicator of future performance and/or results. Past Performance or Forward-looking scenarios based upon the reasonable beliefs of the third-party provider are not a guarantee of future performance. Actual results may differ materially from those anticipated in forward-looking or past performance statements. IC Markets makes no representation or warranty and assumes no liability as to the accuracy or completeness of the information provided, nor any loss arising from any investment based on a recommendation, forecast or any information supplied by any third-party.
