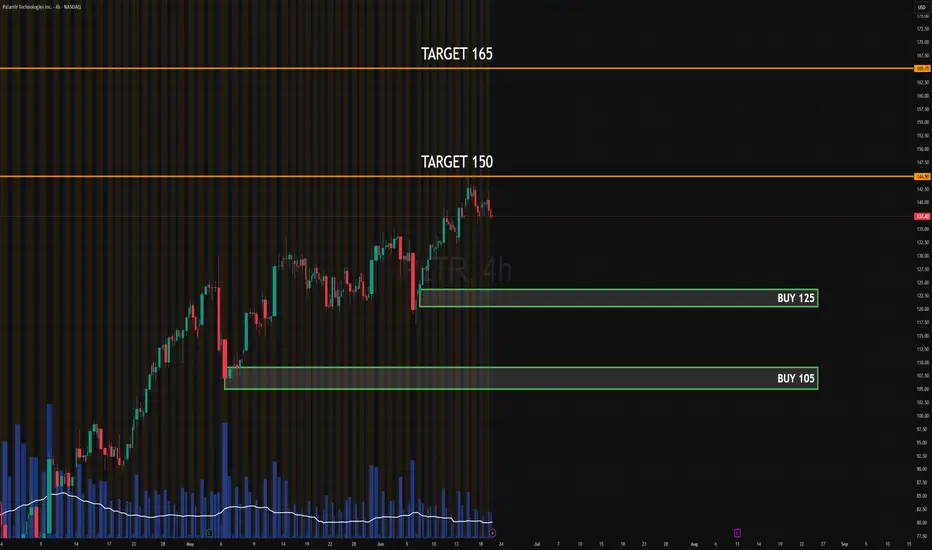
PLTR JUN - JUL 2025 EARNINGSLong from $125 or $105 with confirmation.
📤 Short if $125 breaks and no absorption is seen.
Key resistance: $150 / $165
Key support: $125 / $105
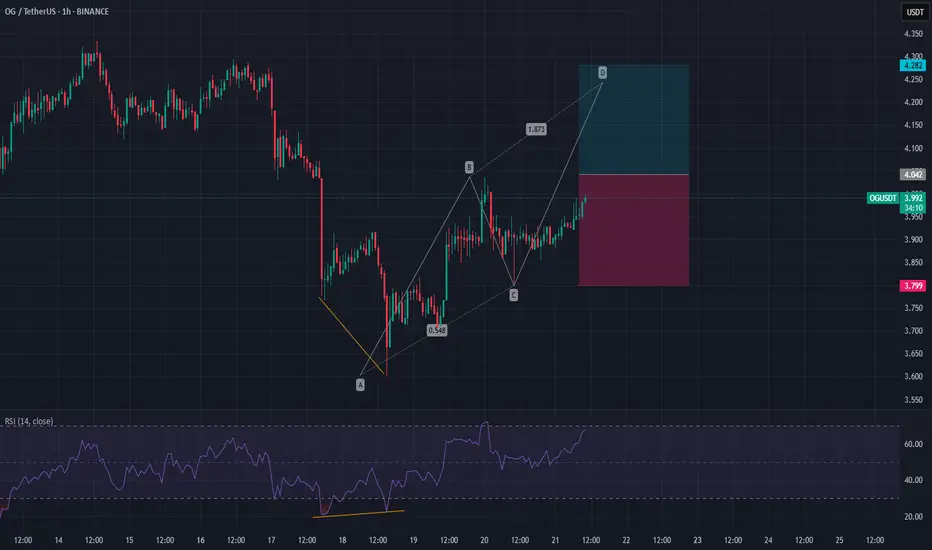
Harmonic Patterns
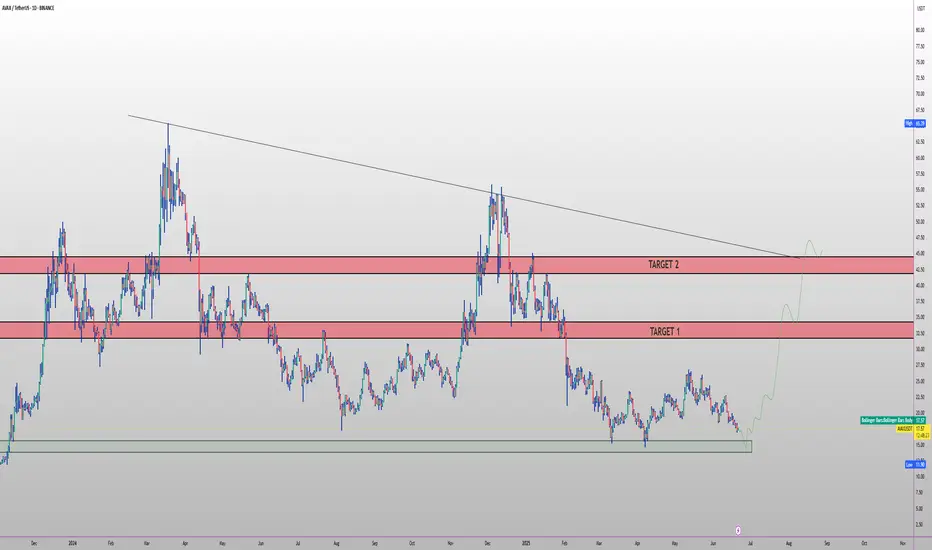
AVAX PLAN FOR 2025 H2 🔥 CRYPTOCAP:AVAX long setup (1D) 🚀
✅ Entry Zone: $14.50 – $16.50 (macro support)
🎯 Targets
• TP-1: $34.00 (’24 supply block)
• TP-2: $46.00 (descending-trend tap)
⛔ Stop-Loss
Daily close < $13.00
📊 Thesis
HyperSDK mainnet → 100 K+ TPS subnets ⚡
Durango Warp Messaging brings native cross-subnet calls 🔀
$50 M Vista fund kick-starts RWA tokenisation 💰
Evergreen subnets land Tier-1 institutions 🏦
Web3 gaming boom (Shrapnel, Off The Grid) 🎮
$BTC 50 EMA Analysis – Daily Timeframe Price is currently hoverCRYPTOCAP:BTC 50 EMA Analysis – Daily Timeframe
Price is currently hovering just above the 50 EMA (blue line), which sits around $103,164, while BTC trades slightly higher at $103,774. Historically, as shown by the chart, BTC has respected the 50 EMA as dynamic support in uptrends and resistance in downtrends. Recent touches on the 50 EMA have triggered bounces, indicating it's a strong technical level.
🔸 Key Support Zone at $103,000 – $102,000:
If BTC holds above this zone, continuation toward previous highs is likely.
🔸 Upside Target: $108,000 – $110,000
Should the 50 EMA act as a springboard again, BTC could retest recent highs.
🔸 Risk Level at $101,500:
A daily close below this level may invalidate the bullish structure and trigger a deeper correction.
🔸 Outlook:
Watch for confirmation of a bounce above the 50 EMA. Bullish entries can be considered on strong daily candles above the moving average with tight risk management.

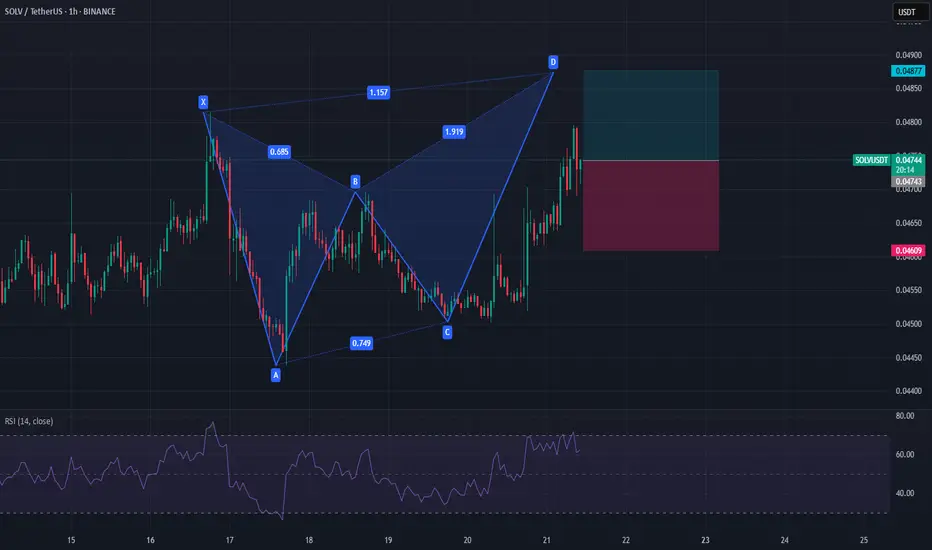
SOLVUSDTBullish Trend continuation expectation as there is no bearish divergence till now.
buying instantly
sl last ll


CHECK BTCUSD SIGNAL READ CAPTAINbtcusd buy now ✅
entry point (103500.00) (103300.00)
TAKE PROFIT 1: (104000.00)
TAKE PROFIT 2: (104800.00)
LAST TARGET(105600.00)
STOP LOSS (102700.00)

CHECK XAUUSD SIGNAL READ CAPTAINxauusd buy now ✅
entry point (3369) (3367)
TAKE PROFIT 1: (3375)
TAKE PROFIT 2: (3386)
LAST TARGET(3395)
STOP LOSS (3360)

TONUSDT: Short the Rejection,Buy the Capitulation – A Dual-Level
📉 TONUSDT Technical Analysis – Trending in a Long-Term Descending Channel, Is the Ideal Short Entry Coming?
TONUSDT is currently trading inside a long-term descending channel, with clear bearish momentum dominating the structure.
🔻 Scenario 1 (Early & Risky Entry):
Traders may consider opening a short position from the current level, but this setup carries higher risk, as the price could still push upward toward the upper boundary of the channel.
Stop-loss level is clearly marked on the chart.
🧭 Scenario 2 (Smarter, Low-Risk Entry):
A more calculated approach is to wait for the price to revisit the upper resistance zone of the descending channel (marked as Entry 1 on the chart).
This zone offers a clean low-risk, high-reward short opportunity, with a tight stop-loss and excellent setup.
🎯 Defined Targets in This Analysis:
Target 1: The midline of the descending channel
Target 2: The bottom of the long-term descending channel
💎 Important Insight:
If this bearish scenario completes and the price reaches the bottom of the descending channel, that zone could be a prime buying opportunity for long-term holders.
Technically, it's a major support level and psychologically, it's where smart money often steps in.
⚠️ Disclaimer:
This is not financial advice. This analysis is for educational purposes only. Always wait for confirmation and apply strict risk management when trading.
📩 What’s your opinion on this setup? Do you agree with the short plan, or see another scenario unfolding? 👇

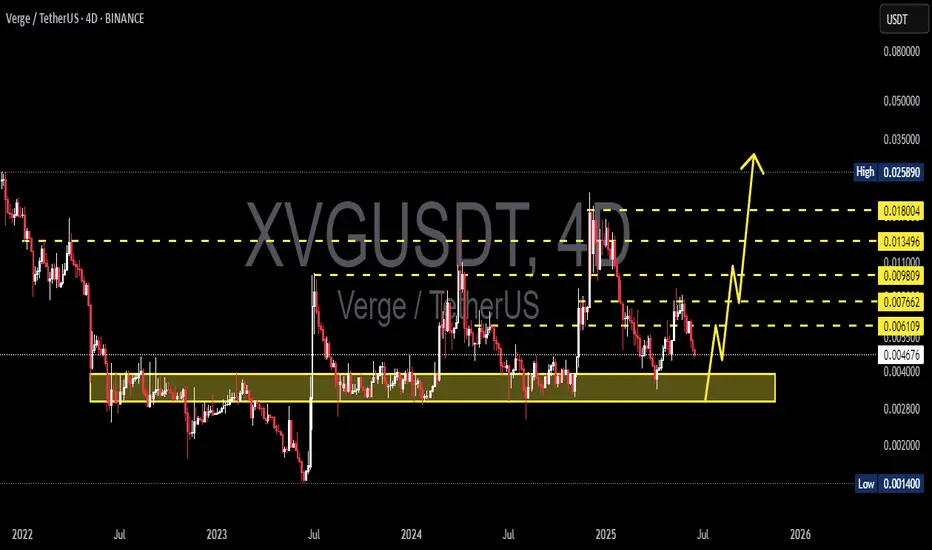
XVGUSDT 4D AnalysisXVG ~ 4D Analysis
#XVG Buy back on retest of this support block with short term target of at least 20%+ from this support.
MYROUSDT 2D AnalysisMYRO ~ 2D Analysis
#MYRO Buy back on retest of this support block with short term target of at least 20%+ from this support.

STXUSDT 1W Analysis STX ~ 1W Analysis
#STX Buy back gradually from here with a short-term target of at least 20%++.

METISUSDT 1W AnalysisMETIS ~ 1W Analysis
#METIS Buy back gradually from here if you still have confidence in this coin with a short term target of at least 20%+ from here.

ARUSDT 5D AnalysisAR ~ 5D Analysis
#AR This is the lowest support for now. Buy back from here with a short term target of at least 15%++ from this support.

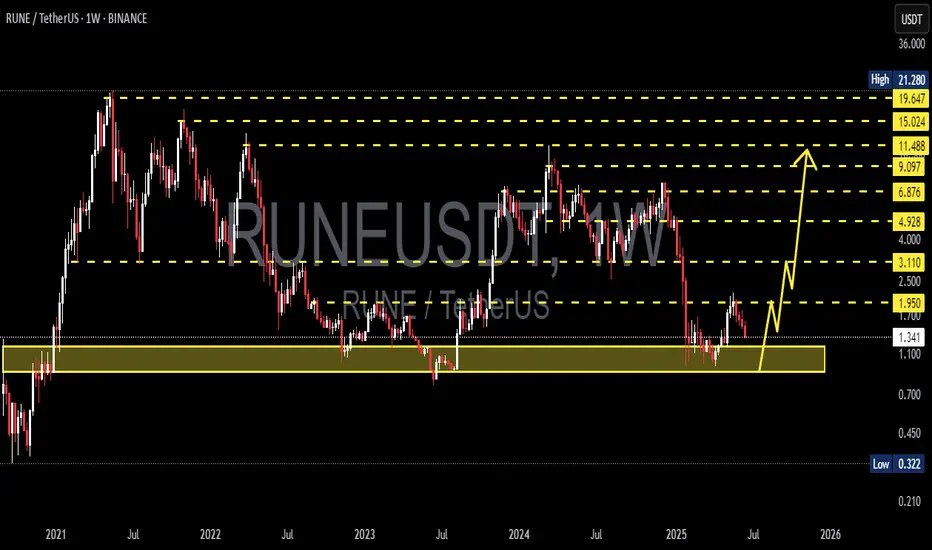
RUNEUSDT 1W AnalysisRUNE ~ 1W Analysis
#RUNE Buy back gradually from here with a short term target of at least 20%+ from this support block.
Litecoin:Is the main climb coming?hello friends👋
As you can see, the price, after falling in the support area specified by the buyers, has been supported and returned, forming an upward pattern.
Now we don't enter into a transaction with just one pattern, we also check the entry of buyers and the amount of currency and other factors and draw conclusions.
According to the points we have said, we have identified very important support points for you to buy step by step with capital and risk management and move to the specified goals.
🔥Follow us for more signals 🔥
*Trade with us safely*

Solana:Daily free signalhello friends👋
As you can see, after the drop that we had, insider buyers showed and were able to support the price well.
But it was not enough, and as you can see, a noisy pattern has formed, which can indicate a further decrease in the price.
Now we can take advantage of this opportunity and make step-by-step purchases with risk and capital management in the support areas that we have obtained for you and move to the specified goals.
🔥Follow us for more signals🔥
*Trade safely with us*

BTC Squeezed to the Edge – Will $102K Support Hold or Crack?Bitcoin is pressing into the apex of a descending triangle, anchored at $102K. Volume is drying up, EMAs are compressing, and liquidity pools sit just below. This structure rarely resolves quietly — a volatile breakout is imminent.
🔻 Bearish Case (Primary Bias):
Breakdown below $102K = short trigger
Targets: $98K → $94K
Stop: Above $106K
Confluence: Bearish pattern + volume dry-up + liquidity below
🟢 Bullish Reversal (Alternate):
Breakout above $107.5K = short squeeze likely
Flip bias only if trendline is reclaimed on volume
🎯 Final Take:
BTC is at a decision point. Don’t trade the bias — trade the breakout. Volatility is coming. Be ready.
📣 What’s your setup? Breakdown or fakeout rally? Share below!

BTCUSD Sell Setup – 4H Chart AnalysisEntry Zone: 103,061
🔹 Stop Loss: 105,120 – 105,095
🎯 Targets:
• TP1: 100,913
• TP2: 98,886
• TP3: 96,967
🔻 Analysis Summary:
Price recently broke a key support zone and is currently retesting it. A clean bearish rejection from this level provides a high-probability short setup. With clear risk-to-reward levels defined, this trade targets the next key supports.
🛑 Risk Management: Always use stop loss and proper lot sizing.

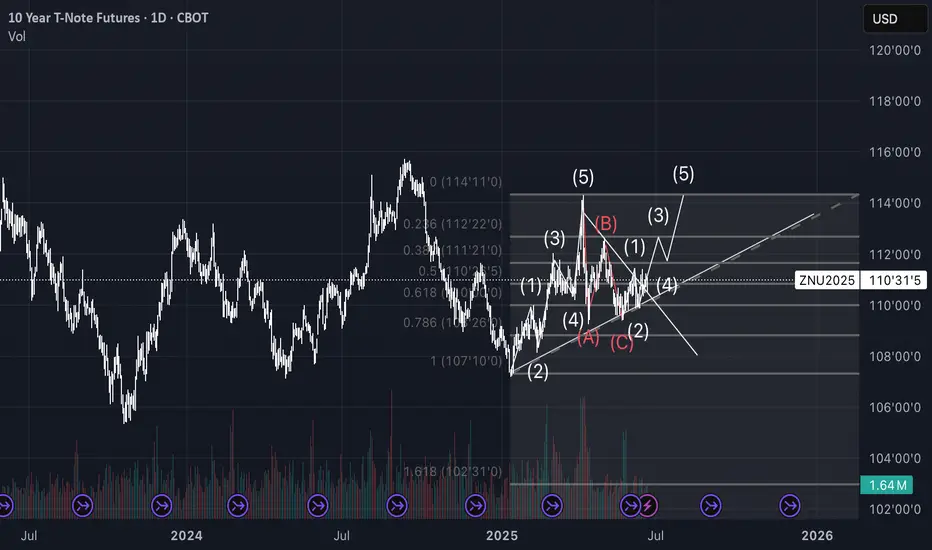
10 - Notes CallTechnical analysis of 10Y T-Note Futures (ZN1!) on 4H timeframe
Elliott Wave count with Fibonacci retracements and completed A-B-C corrective structure. Currently observing potential start of new impulsive wave (1)-(2). Breakout from descending triangle confirmed above dynamic support. Monitoring for further bullish continuation or validation of larger corrective structure.
CLSK / 2hAs illustrated on the chart above, NASDAQ:CLSK revealed that wave a of (y) in an expanding leading diagonal, which highly confirms that a relatively deep correction in wave ii (circled) is well underway, as anticipated.
Wave Analysis >> The retracement of wave b should have completed its second subdivision down, and the last one in 5% >> retrace up is now expected. The retracement target >> 9.51
The anticipated decline by 17% as the last subdivision >> wave c of (y) would follow very soon and finally will conclude the entire correction in Minute degree wave ii(circled).
The Retracement Targets >> 7.93 >> 7.84
Trend Analysis >> After the completion of the entire correction in the Intermediate degree wave (2), the trend will turn upward to an impulsive third wave in the same degree.
#CryptoStocks #CLSK #BTCMining #Bitcoin #BTC

RIOT / 2hAs anticipated in the prior NASDAQ:RIOT 's analysis, the expected decline of the diagonal's 5th wave has begun its way down, with just 8% lies ahead.
Wave Analysis >> The leading expanding diagonal in Minor degree wave A, as the first subdivision of the ongoing correction in wave (2), quite well indicates that a relatively deep correction in wave (2) might be thoroughly developed.
Trend Analysis >> The trend is correcting down in the Intermediate degree wave (2), which will take a few weeks to develop.
The retracement targets >> 8.76 >> 8.20 >> 7.93 >> 7.67
#CryptoStocks #RIOT #BTCMining #Bitcoin #BTC
