Trade Signal | Bitcoin (BTC) completed a setup for the next pumpHi dear members , hope you are well and welcome to the new trade setup of Bitcoin (BTC)
Recently we caught a nice trade of Bitcoin as below:
Now on a daily time frame, BTC has almost completed a bullish Butterfly move for the next pump.
Buy between: $102600 to $100426
Sell between: $105651 to $108877
Stop loss: Below $100426
Possible profit ratio:
As per above targets there is a profit possibility of upt 8% and a loss possibility is upto 2.50%.
Note: Above idea is for educational purpose only. It is advised to diversify and strictly follow the stop loss, and don't get stuck with trade.
Harmonic Patterns

CHECK XAUJPY SIGNAL READ CAPTAINxaujpy sell now ✅
entry point (491800) (491200)
TAKE PROFIT 1: (489000)
TAKE PROFIT 2: (486100)
LAST TARGET(483600)
STOP LOSS (494100)

CHECK EURUSD SIGNAL READ CAPTAIONEntry: around1.15400 1.15350)✅
Take Profit1.15150 ✅
Take Profit 2: 1.14800✅
Last Target:1.14500 ✅
Stop Loss: 1.15700❌

BUY AUDCHFSwing buys on AUDCHF as price begins to reject at the support. Price should aim for the recently created highs 0,53700 and possibly higher.

a new pullback before going upa new pullback before going up.
1.14 could be a good spot to place longs

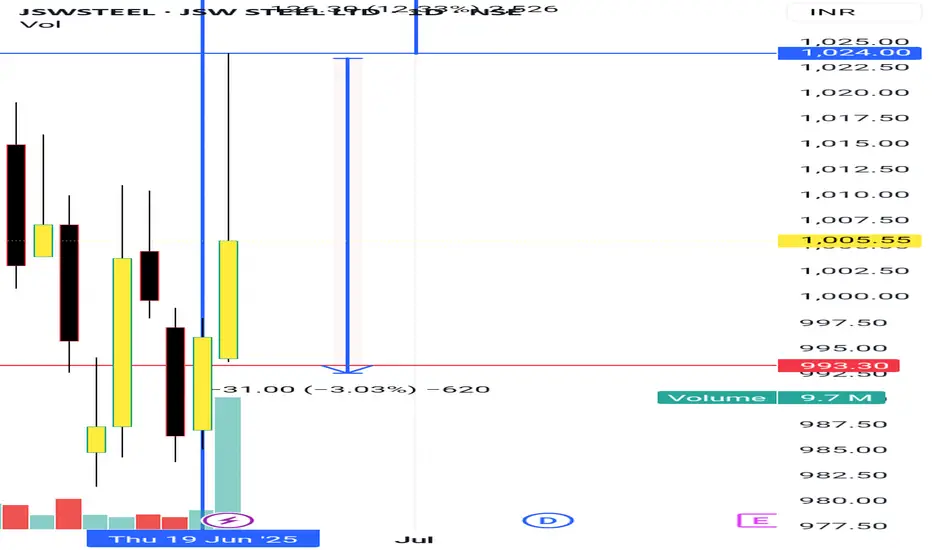
JSW steel
I'm not a SEBI REGISTERED ANYLISIS
just for learning purpose
above the blue line close in D chart candle i will buy and put strictly SL to below red line...once candle close below Red line in D chart...i will close the Trade...
target check the chart
WAIT FOR ENTRY......then after
WAIT FOR TARGET...... or
WAIT FOR STOPLOSS
educational purpose only
oits simple ORB WITH VOLUME BREAKOUT STRATEGY...with small condition apply for selecting the stocks
owt not response for your profit and loss
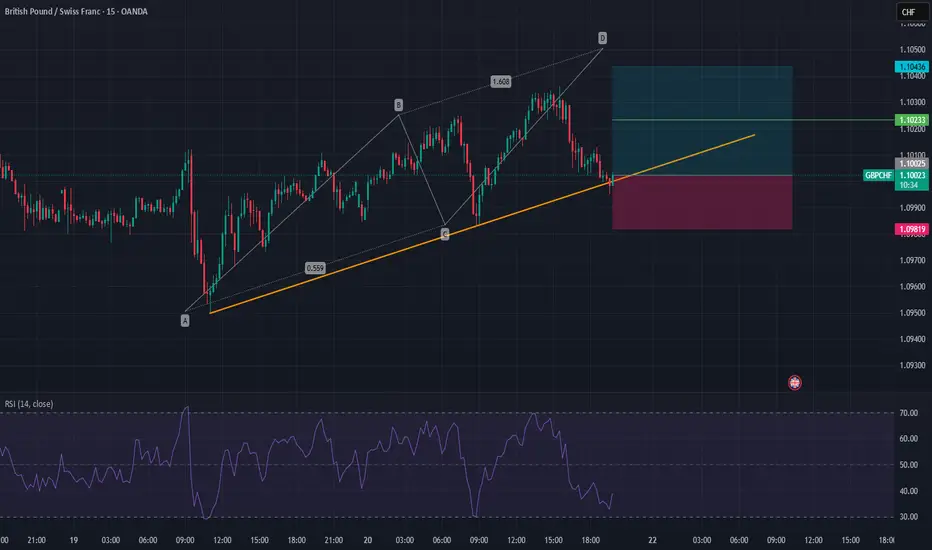
EURCHF -bias long Bullish indications:
Daily Fib level 0.618 respected.
4 hr: Hammer candle from support.
Major support respected at 0.93130
Morning star candle in 1 hr
15 min: formation of head and shoulder in 15 min.
trend line support respected.
AB=CD is complete indicates reversal.
Bearish indications:
Daily :Lower low and lower highs
MA 21 respected the candle indicates possible fall.
Trade plan bias long @ 0.93240
SL:0.93116
TP1:0.93375
TP2:0.93490

US500,DXY, EURUSD & XAGUSD Daily Trade SetupsIn this update we review the recent price action in the SP500, Euro, Dollar & SIlver and identify the next high-probability trade setups and price objectives to target. To review today's video analysis, click here!

Quo Vadis - "Where we have come to"Here is is a daily bar chart of the MES1! showing where we have come made up from TV Community scripts. (No coding required.) But the question of course is where do we go from here in light of all the current circumstances: Middle East War, Tariff, Interest Rates, etc Will we see a new All Time High in the S & P 500? This chart does not show a reversal yet. I am staying LONG until the market and the chart says something different.

Buy XAUUSDBuy XAUUSD here around 3347 considering the formation of this inverted head and shoulders pattern. Price should range between 3350 and 3360 for the next few hours

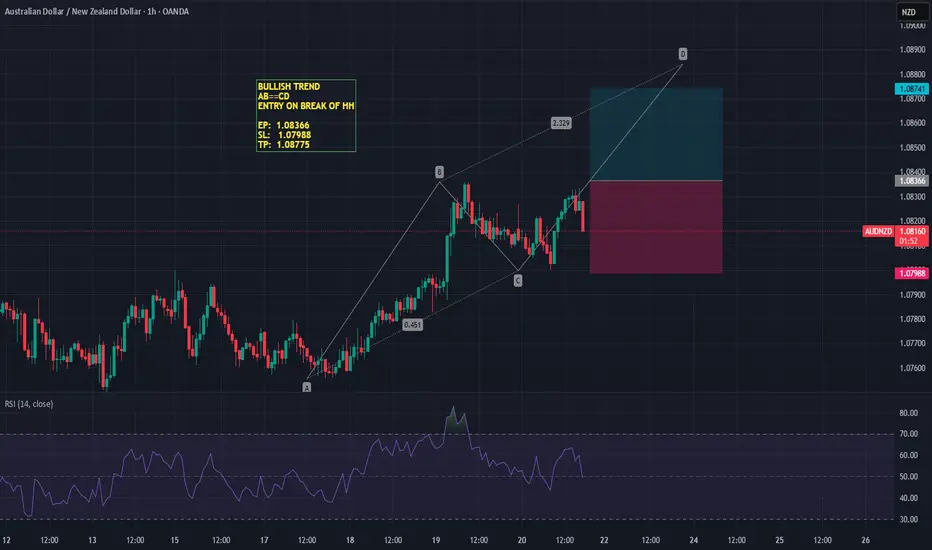
GBPUSD (Daily + H4) – Bullish Symmetry with Shark Execution & El
Hello awesome traders!
I hope your trading week has been phenomenal. Let’s close out the week strong with this GBPUSD analysis combining Daily structure with lower-timeframe execution.
Main Chart: SYMMETRY (Daily) – Bullish Setup
Price has completed a perfect AB=CD symmetry structure with clear legs from the May rally. We now sit inside a strong PCZ (Potential Completion Zone) between the 78.6% and 100% projections, near a prior breakout zone. This type of measured pullback often sets the base for continuation when confirmed by lower timeframes.
Execution Chart: SHARK (H4) – Entry Strategy
On the 4H, we have a clean SHARK pattern terminating deep within the same PCZ as the daily symmetry. Price tagged 161.8% then immediately bounced, printing a bullish engulfing structure above the 127.2% fib. That’s our signal to focus long.
We define the entry above the minor high / 200 SMA retest — at 1.34450, with stops just below 1.33800 (under the wick and invalidation zone). Targets are aligned with fib retracement and extension zones, 61.8% first, 127% for the extended leg.
Elliot Context (H4 + Daily Overview)
On the H4, price completed a 5-leg Elliott drive with wedge structure and a sharp exhaustion push down to PRZ.
On the Daily, the Elliott overview shows price respecting impulsive wave alignment and now positioning for a corrective rally that aligns with our symmetry leg expectation.
Next Steps:
Execution: Enter long above 1.34450 only on confirmation.
First target: 1.34920 zone (61.8% fib).
Extended target: 1.36083 (127.2% fib).
Invalidation: Below 1.33800 — if price closes below the PRZ, setup is void.
Risk Management:
Clear stop placement and PRZ-based entry. Confluence from Daily + H4 structure + Elliott logic supports the long idea. No FOMO — only execute on confirmation. Let the market come to you.
Hope you all have a great weekend!
Let’s stay disciplined, trust the structure, and trade like the pros.
—Constantino DeLa
Tradechartpatternslikethepros.

Gold Eyes Breakout from Ascending Channel Toward $3,500📈 Chart Analysis
1. Rising Channel Structure
Gold (XAU/USD) has been trading within an upward-sloping channel, marked by the blue trendlines connecting interior lows and highs, culminating at point C (~$3,497). The latest bounce off the lower channel near “B” reinforces bullish bias – if this trendline holds, another leg higher toward resistance around $3,497–$3,500 is likely.
2. Support & Resistance Confluence
The purple trendline and the dotted horizontal green level (~$3,498) converge near the projected breakout point. This synergy provides a strong pivot zone — a successful breakout would validate targets near channel highs.
3. Harmonic Pattern in Play
The chart displays a bullish harmonic structure (likely a Bat or Gartley formation), with retracement ratios (0.719, 1.627) anchoring reversal areas. These reinforce the bounce at B and the potential move toward point C.
4. Trade Scenarios
Bullish Scenario (primary): A bounce off the trendline triggers a rally to the channel top and resistance zone ($3,497–$3,500).
Bearish Caution: A drop below the trendline invalidates the pattern, potentially bringing prices back to horizontal support around $3,296 or even $3,120, as indicated at point A.
🛠️ Technical & Market Context
Technicals: Daily trend remains bullish as long as price holds above ~$3,340–$3,350, with resistance forming in the $3,380–$3,400 range
Fundamentals: Geopolitical tension (e.g., Middle East conflict) and safe-haven inflows continue to underpin gold — though Citi expects prices to eventually correct toward $3,300–$3,500 mid‑term
.
Sentiment: Some analysts advocate “selling the rallies,” especially into the $3,450–$3,500 zone . But central banks’ ongoing buying and potential Fed rate cuts support a stronger floor
.
✅ Trade Strategy
Scenario Entry Zone Target Stop Loss Placement
Play the Bounce ~$3,350–$3,360 $3,497–$3,500 Below trendline near B zone (~$3,320)
Breakout Trade On momentum above $3,400 $3,497–$3,550 Below breakout (sub-$3,380)
Bearish Trigger Break & close below trendline Back to $3,296 / 3,120 Just above trendline ($3,360)
🔍 Summary
Gold remains in a structurally bullish setup inside an ascending channel. The confluence of harmonic reversal, strong trendline support, and pending fundamental catalysts presents a high-probability opportunity to push toward the $3,500 area—provided the trendline and $3,340–$3,350 support hold. A drop below would invalidate the bullish outlook and favor deeper retracement.

SHORT ETH🔷 Setup Summary: SFP + Key Volume Combo
1. Context:
Pattern: Double Top + SFP (Swing Failure Pattern)
Timeframe: Likely M15–H1 (possibly during Asian/European session)
Background: Price breaks previous high slightly (liquidity grab), then sharply reverses — a clear trap.
2. Confirmation:
A clear Key Volume candle appears at the top — signaling market maker action.
A strong rejection candle (pinbar or engulfing) confirms the SFP.
Price fails to hold above the new high — trap confirmed.
3. Entry Strategy:
Entry: After the SFP confirmation candle closes.
Stop Loss: Above the SFP high or Key Volume wick (a “valid” SL, not necessarily tight).
Take Profit:
Short-term: 3R (if trading intra-session).
Long-term: Target demand zone or Daily support if trend supports it.
4. Risk Management (per system guidelines):
Max risk per trade: 1–2% of account.
If setup invalidates: cut the loss immediately, don’t widen SL or overtrade.

Bullish continuation?WTI Oil (XTI/USD) is falling towards the pivot which has been identified as a pullback support and could bounce to the 1st resistance.
Pivot: 73.41
1st Support: 70.19
1st Resistance: 77.67
Risk Warning:
Trading Forex and CFDs carries a high level of risk to your capital and you should only trade with money you can afford to lose. Trading Forex and CFDs may not be suitable for all investors, so please ensure that you fully understand the risks involved and seek independent advice if necessary.
Disclaimer:
The above opinions given constitute general market commentary, and do not constitute the opinion or advice of IC Markets or any form of personal or investment advice.
Any opinions, news, research, analyses, prices, other information, or links to third-party sites contained on this website are provided on an "as-is" basis, are intended only to be informative, is not an advice nor a recommendation, nor research, or a record of our trading prices, or an offer of, or solicitation for a transaction in any financial instrument and thus should not be treated as such. The information provided does not involve any specific investment objectives, financial situation and needs of any specific person who may receive it. Please be aware, that past performance is not a reliable indicator of future performance and/or results. Past Performance or Forward-looking scenarios based upon the reasonable beliefs of the third-party provider are not a guarantee of future performance. Actual results may differ materially from those anticipated in forward-looking or past performance statements. IC Markets makes no representation or warranty and assumes no liability as to the accuracy or completeness of the information provided, nor any loss arising from any investment based on a recommendation, forecast or any information supplied by any third-party.

XAUUSD M15 I Bearish Reversal Based on the M15chart, the price is approaching our sell entry level at 3361.93, a pullback resistance that aligns with the 50% Fib retracement.
Our take profit is set at 3342.62, an overlap support.
The stop loss is set at 3379.02, a swing high resistance.
High Risk Investment Warning
Trading Forex/CFDs on margin carries a high level of risk and may not be suitable for all investors. Leverage can work against you.
Stratos Markets Limited (tradu.com ):
CFDs are complex instruments and come with a high risk of losing money rapidly due to leverage. 63% of retail investor accounts lose money when trading CFDs with this provider. You should consider whether you understand how CFDs work and whether you can afford to take the high risk of losing your money.
Stratos Europe Ltd (tradu.com ):
CFDs are complex instruments and come with a high risk of losing money rapidly due to leverage. 63% of retail investor accounts lose money when trading CFDs with this provider. You should consider whether you understand how CFDs work and whether you can afford to take the high risk of losing your money.
Stratos Global LLC (tradu.com ):
Losses can exceed deposits.
Please be advised that the information presented on TradingView is provided to Tradu (‘Company’, ‘we’) by a third-party provider (‘TFA Global Pte Ltd’). Please be reminded that you are solely responsible for the trading decisions on your account. There is a very high degree of risk involved in trading. Any information and/or content is intended entirely for research, educational and informational purposes only and does not constitute investment or consultation advice or investment strategy. The information is not tailored to the investment needs of any specific person and therefore does not involve a consideration of any of the investment objectives, financial situation or needs of any viewer that may receive it. Kindly also note that past performance is not a reliable indicator of future results. Actual results may differ materially from those anticipated in forward-looking or past performance statements. We assume no liability as to the accuracy or completeness of any of the information and/or content provided herein and the Company cannot be held responsible for any omission, mistake nor for any loss or damage including without limitation to any loss of profit which may arise from reliance on any information supplied by TFA Global Pte Ltd.
The speaker(s) is neither an employee, agent nor representative of Tradu and is therefore acting independently. The opinions given are their own, constitute general market commentary, and do not constitute the opinion or advice of Tradu or any form of personal or investment advice. Tradu neither endorses nor guarantees offerings of third-party speakers, nor is Tradu responsible for the content, veracity or opinions of third-party speakers, presenters or participants.

USDCHF H4 I Bullish Bounce Off the 50% FibBased on the H4 chart analysis, we can see that the price is falling toward our buy entry at 0.8145, which is an overlap support that aligns closely with the 38.2% Fib retracement.
Our take profit will be at 0.8208, an overlap resistance level.
The stop loss will be placed at 0.8088, which is a swing high low level.
High Risk Investment Warning
Trading Forex/CFDs on margin carries a high level of risk and may not be suitable for all investors. Leverage can work against you.
Stratos Markets Limited (tradu.com ):
CFDs are complex instruments and come with a high risk of losing money rapidly due to leverage. 63% of retail investor accounts lose money when trading CFDs with this provider. You should consider whether you understand how CFDs work and whether you can afford to take the high risk of losing your money.
Stratos Europe Ltd (tradu.com ):
CFDs are complex instruments and come with a high risk of losing money rapidly due to leverage. 63% of retail investor accounts lose money when trading CFDs with this provider. You should consider whether you understand how CFDs work and whether you can afford to take the high risk of losing your money.
Stratos Global LLC (tradu.com ):
Losses can exceed deposits.
Please be advised that the information presented on TradingView is provided to Tradu (‘Company’, ‘we’) by a third-party provider (‘TFA Global Pte Ltd’). Please be reminded that you are solely responsible for the trading decisions on your account. There is a very high degree of risk involved in trading. Any information and/or content is intended entirely for research, educational and informational purposes only and does not constitute investment or consultation advice or investment strategy. The information is not tailored to the investment needs of any specific person and therefore does not involve a consideration of any of the investment objectives, financial situation or needs of any viewer that may receive it. Kindly also note that past performance is not a reliable indicator of future results. Actual results may differ materially from those anticipated in forward-looking or past performance statements. We assume no liability as to the accuracy or completeness of any of the information and/or content provided herein and the Company cannot be held responsible for any omission, mistake nor for any loss or damage including without limitation to any loss of profit which may arise from reliance on any information supplied by TFA Global Pte Ltd.
The speaker(s) is neither an employee, agent nor representative of Tradu and is therefore acting independently. The opinions given are their own, constitute general market commentary, and do not constitute the opinion or advice of Tradu or any form of personal or investment advice. Tradu neither endorses nor guarantees offerings of third-party speakers, nor is Tradu responsible for the content, veracity or opinions of third-party speakers, presenters or participants.

YGGUSDT 5D AnalysisYGG ~ 5D Analysis
#YGG This is the lowest support for now. Buy if you still have faith in this coin with a short term target of at least 15%+ from here.

Call an Ambulance - But for Shorters - WIF WIFWIF is in such a position that all orders(sell) has been observed by the buyers, on accumulation on darvas box and soon to slice of the sellers! wait and watch!

WTI Oil H1 | Overlap resistance at 61.8% Fibonacci retracementWTI oil (USOIL) is rising towards an overlap resistance and could potentially reverse off this level to drop lower.
Sell entry is at 76.02 which is an overlap resistance that aligns closely with the 61.8% Fibonacci retracement.
Stop loss is at 78.00 which is a level that sits above a multi-swing-high resistance.
Take profit is at 71.40 which is a swing-low support that aligns closely with the 78.6% Fibonacci retracement.
High Risk Investment Warning
Trading Forex/CFDs on margin carries a high level of risk and may not be suitable for all investors. Leverage can work against you.
Stratos Markets Limited (tradu.com ):
CFDs are complex instruments and come with a high risk of losing money rapidly due to leverage. 63% of retail investor accounts lose money when trading CFDs with this provider. You should consider whether you understand how CFDs work and whether you can afford to take the high risk of losing your money.
Stratos Europe Ltd (tradu.com ):
CFDs are complex instruments and come with a high risk of losing money rapidly due to leverage. 63% of retail investor accounts lose money when trading CFDs with this provider. You should consider whether you understand how CFDs work and whether you can afford to take the high risk of losing your money.
Stratos Global LLC (tradu.com ):
Losses can exceed deposits.
Please be advised that the information presented on TradingView is provided to Tradu (‘Company’, ‘we’) by a third-party provider (‘TFA Global Pte Ltd’). Please be reminded that you are solely responsible for the trading decisions on your account. There is a very high degree of risk involved in trading. Any information and/or content is intended entirely for research, educational and informational purposes only and does not constitute investment or consultation advice or investment strategy. The information is not tailored to the investment needs of any specific person and therefore does not involve a consideration of any of the investment objectives, financial situation or needs of any viewer that may receive it. Kindly also note that past performance is not a reliable indicator of future results. Actual results may differ materially from those anticipated in forward-looking or past performance statements. We assume no liability as to the accuracy or completeness of any of the information and/or content provided herein and the Company cannot be held responsible for any omission, mistake nor for any loss or damage including without limitation to any loss of profit which may arise from reliance on any information supplied by TFA Global Pte Ltd.
The speaker(s) is neither an employee, agent nor representative of Tradu and is therefore acting independently. The opinions given are their own, constitute general market commentary, and do not constitute the opinion or advice of Tradu or any form of personal or investment advice. Tradu neither endorses nor guarantees offerings of third-party speakers, nor is Tradu responsible for the content, veracity or opinions of third-party speakers, presenters or participants.

USD/CAD H1 | Potential bounce off an overlap supportUSD/CAD is falling towards an overlap support and could potentially bounce off this level to climb higher.
Buy entry is at 1.3686 which is an overlap support that aligns with the 50% Fibonacci retracement.
Stop loss is at 1.3633 which is a level that lies underneath anoverlap support and the 50% Fibonacci retracement.
Take profit is at 1.3738 which is a swing-high resistance.
High Risk Investment Warning
Trading Forex/CFDs on margin carries a high level of risk and may not be suitable for all investors. Leverage can work against you.
Stratos Markets Limited (tradu.com ):
CFDs are complex instruments and come with a high risk of losing money rapidly due to leverage. 63% of retail investor accounts lose money when trading CFDs with this provider. You should consider whether you understand how CFDs work and whether you can afford to take the high risk of losing your money.
Stratos Europe Ltd (tradu.com ):
CFDs are complex instruments and come with a high risk of losing money rapidly due to leverage. 63% of retail investor accounts lose money when trading CFDs with this provider. You should consider whether you understand how CFDs work and whether you can afford to take the high risk of losing your money.
Stratos Global LLC (tradu.com ):
Losses can exceed deposits.
Please be advised that the information presented on TradingView is provided to Tradu (‘Company’, ‘we’) by a third-party provider (‘TFA Global Pte Ltd’). Please be reminded that you are solely responsible for the trading decisions on your account. There is a very high degree of risk involved in trading. Any information and/or content is intended entirely for research, educational and informational purposes only and does not constitute investment or consultation advice or investment strategy. The information is not tailored to the investment needs of any specific person and therefore does not involve a consideration of any of the investment objectives, financial situation or needs of any viewer that may receive it. Kindly also note that past performance is not a reliable indicator of future results. Actual results may differ materially from those anticipated in forward-looking or past performance statements. We assume no liability as to the accuracy or completeness of any of the information and/or content provided herein and the Company cannot be held responsible for any omission, mistake nor for any loss or damage including without limitation to any loss of profit which may arise from reliance on any information supplied by TFA Global Pte Ltd.
The speaker(s) is neither an employee, agent nor representative of Tradu and is therefore acting independently. The opinions given are their own, constitute general market commentary, and do not constitute the opinion or advice of Tradu or any form of personal or investment advice. Tradu neither endorses nor guarantees offerings of third-party speakers, nor is Tradu responsible for the content, veracity or opinions of third-party speakers, presenters or participants.

DAX H1 | Downtrend to extend deeper?The DAX (GER30) is rising towards a swing-high resistance and could potentially reverse off this level to drop lower.
Sell entry is at 22,230.41 which is a swing-high resistance that aligns closely with the 23.6% Fibonacci retracement.
Stop loss is at 23,460.00 which is a level that sits above the 50% Fibonacci retracement and a swing-high resistance.
Take profit is at 22,913.31 which is a swing-low support.
High Risk Investment Warning
Trading Forex/CFDs on margin carries a high level of risk and may not be suitable for all investors. Leverage can work against you.
Stratos Markets Limited (tradu.com ):
CFDs are complex instruments and come with a high risk of losing money rapidly due to leverage. 63% of retail investor accounts lose money when trading CFDs with this provider. You should consider whether you understand how CFDs work and whether you can afford to take the high risk of losing your money.
Stratos Europe Ltd (tradu.com ):
CFDs are complex instruments and come with a high risk of losing money rapidly due to leverage. 63% of retail investor accounts lose money when trading CFDs with this provider. You should consider whether you understand how CFDs work and whether you can afford to take the high risk of losing your money.
Stratos Global LLC (tradu.com ):
Losses can exceed deposits.
Please be advised that the information presented on TradingView is provided to Tradu (‘Company’, ‘we’) by a third-party provider (‘TFA Global Pte Ltd’). Please be reminded that you are solely responsible for the trading decisions on your account. There is a very high degree of risk involved in trading. Any information and/or content is intended entirely for research, educational and informational purposes only and does not constitute investment or consultation advice or investment strategy. The information is not tailored to the investment needs of any specific person and therefore does not involve a consideration of any of the investment objectives, financial situation or needs of any viewer that may receive it. Kindly also note that past performance is not a reliable indicator of future results. Actual results may differ materially from those anticipated in forward-looking or past performance statements. We assume no liability as to the accuracy or completeness of any of the information and/or content provided herein and the Company cannot be held responsible for any omission, mistake nor for any loss or damage including without limitation to any loss of profit which may arise from reliance on any information supplied by TFA Global Pte Ltd.
The speaker(s) is neither an employee, agent nor representative of Tradu and is therefore acting independently. The opinions given are their own, constitute general market commentary, and do not constitute the opinion or advice of Tradu or any form of personal or investment advice. Tradu neither endorses nor guarantees offerings of third-party speakers, nor is Tradu responsible for the content, veracity or opinions of third-party speakers, presenters or participants.
