Bitcoin is about to enter a bull market!Got a Butterfly and a Gartely shaping up here, looking for this last dump before continuation of the Bull market
Harmonic Patterns

XAUUSD - WAVE 5 BULLISH TO $3,622Like I said on the last update, Gold is currently going through a strong 'accumulation' phase for buyers, hence why we're seeing these choppy price actions, trying to liquidate buyers.
As long as Gold is ABOVE THE WAVE 2 LOW, market structure still favours buyers. Breaking below this low, will invalidate bullish structure.
Wave 2 Invalidation Level - $3,245

PBTC vs ETHA visual comparison of Purple Bitcoin (PBTC) and Ethereum (ETH) trends, powered by the Purple Bitcoin Compare Bot.

Us30 Key Levels on the Daily Timeframe – Quick Analysis:
🔴 Resistance Zones:
1. 42800 – 42950 🔺
• This area marked a strong top and rejected price multiple times
• If price returns to this zone, a strong rejection is likely
2. 42250 – 42400
• Previous correction area, may act as short-term resistance
• Useful zone to exit partial long positions if price bounces back
⸻
🟢 Support Zones:
1. 41700 – 41750 🧱
• Nearest support zone, price is currently close
• A break below this could trigger further downside
2. 41480 – 41550 🔻
• Medium support from a previous low (May)
• Breaking this opens downside toward 41000
3. 40700 – 40800
• Strong support from a major bottom
• A break here could open the way to 390 00–38000
⸻
📉 Chart Notes:
• Currently forming a potential double top near 42900
• The downtrend seems active as long as price stays below 42250–42400

Fartcoin BullishCup and Handle formation showing on Fartcoin.
Bitcoin once it goes will lift a bunch of alt coins. I believe bitcoin is en route towards $130k next. Alt coins will likely move after.

Where Most See Resistance, Smart Money Sees OpportunityDOGE is currently hovering around the 0.382–0.5 Fibonacci retracement zone after a reactive bounce from 0.618 (0.16784) — a critical discount level. Most traders panic at these levels, but experienced participants know this is the zone where price builds intention.
Here's the breakdown of the structure:
Price tapped into the 0.618 Fibonacci level (0.16784) and began showing signs of recovery — a typical Smart Money accumulation zone.
The next target is 0.17042, aligning with the 0.236 retracement level, followed by 0.17151, where previous supply might get mitigated.
Potential retracements are possible, but as long as price holds above 0.16670 (0.786), the bullish structure remains intact.
Execution strategy:
Entry (Accumulation Zone): Between 0.16784 and 0.16864
Invalidation: Break below 0.16600 would weaken the bullish case
Upside targets:
• TP1 → 0.17042
• TP2 → 0.17151
• Extension possibility beyond 0.17204
This move appears to be a classic premium-delivery setup — a structural reset, not a collapse. Smart Money steps in quietly when retail panic takes over. If you're trading DOGE like a pro, focus on levels, not emotions.
Let me know if you'd like this converted into a tweet format or turned into a technical newsletter paragraph.

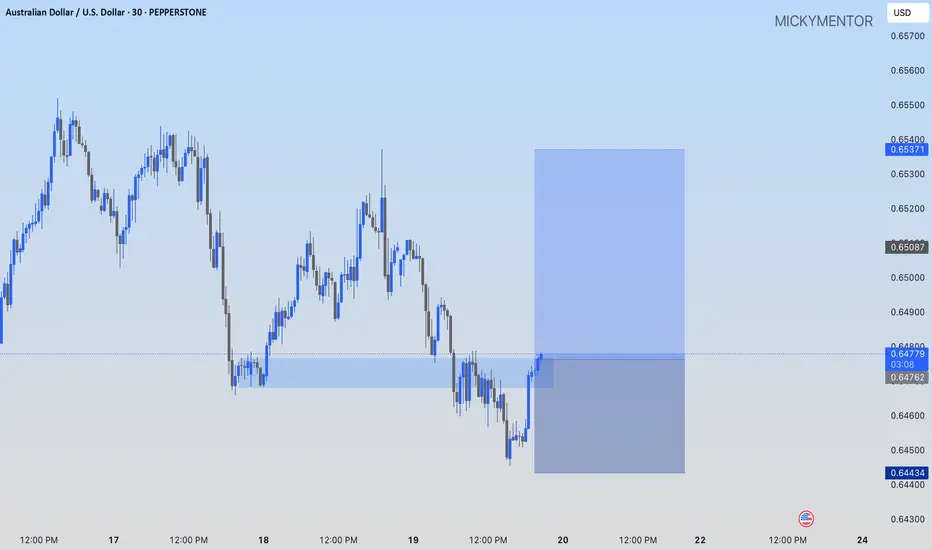
AUDUSD: AN OPPORTUNITY TO GO LONGPEPPERSTONE:AUDUSD I'm buying at the current market price to the 0.65371 price level
BTC – 15min Reversal Structure & Fibonacci ReclaimWe’re currently witnessing a potential short-term reversal on BTC’s lower timeframe after a volume-supported breakdown and sweep of local lows.
🔍 Key Observations:
Price swept liquidity at local lows (~103,929.27)
Entered into a clear reaccumulation box with responsive buyers
Volume profile shows prior POC just above – room for fill
Fibonacci retracement aligns with key structure:
0.5 = 104,372.94
0.618 = 104,268.23
1.0 = 104,816.60 (final high target for this impulse)
📈 Potential Play:
Entry Zone: Just above the sweep candle (104,100–104,200)
Target 1: 0.382 at 104,477
Target 2: 104,816.60
Invalidation: Close below 103,926
🧠 Mindset:
This is a classic liquidity sweep → reaction → reclaim pattern. If BTC flips the 0.5 level with strong momentum, a short squeeze toward the 104.8K area becomes likely.
Great opportunity for scalpers or day traders.
Let me know if you want this turned into a long-form breakdown or sent in another format.

SOL – Sweep & Spring Play at Local DemandWe’ve got a clean rounded top → breakdown → demand sweep setup.
Current price action suggests a potential reversal is brewing.
🔍 What’s happening on this chart?
Rounded top marks a local distribution — aggressive short entries
Price broke lower, swept the demand zone (gray box), and now shows rejection wick + bullish reaction
Fibonacci levels mapped out the structure
0.5 = 154.51
0.618 = 157.76 = key resistance liquidity zone
🎯 Trade idea:
Entry: inside demand zone (OB marked on chart)
Target 1: 151.25
Target 2: 157.76 (0.618)
Full fill: 162.40 – 168.30 (complete inefficiency sweep)
🧠 Mindset:
This setup is classic spring + reclaim. If price consolidates and flips 147.2, upside becomes favorable.
If you like clean trade setups with logic and clear invalidation, check the account bio for more updates and live breakdowns.


Rectangle ChannelHey traders, here’s one to watch closely 👇
GBPCHF is consolidating in a rectangle channel structure, marked by clear highs and lows — a classic coiled spring waiting for resolution.
📌 Key Notes:
Price has respected horizontal boundaries repeatedly
We’ve now broken above the top of the range with a reaction off point D
Both upside and downside breakouts remain valid — the key is confirmation
🔍 What to Watch:
A surge in volume and close above 1.10142 or below 1.09510 will confirm breakout direction
Fibs projected from XA and ABCD legs show both upside and downside targets
Range extension levels already plotted for reference
No prediction. Just structure and breakout readiness.
— C. Dela | #TradeChartPatternsLikeThePros.

Gold: update hello friends✋️
According to the recent growth of gold, you can see that it is constantly resisting and forming a falling pattern.
For this reason, it can be a warning that the fall can continue and the price will fall to the specified limits.
🔥Follow us for more signals🔥
*Trade safely with us*

Bullish AB=CD Hey traders 👋
This is a textbook Bullish AB=CD structure unfolding on NZDUSD.
The market sold off in clean symmetry from A → B, pulled back into C, and completed the full AB = CD leg at D (0.59590) — precisely at the 100% – 127.2% PRZ.
🧠 Pattern Breakdown:
AB = CD completion at 0.59590
Reversal began from confluence zone with clear reaction
PRZ defined from 0.59788 to 0.59574
Target 1 → 0.60202 – 0.60368
Target 2 → 0.60683 – 0.60849 (extension to full symmetry cycle)
We now monitor for continuation and use structure to manage the trade.
Momentum shifting bullish — trade the setup, not your opinion.
— C. Dela | #TradeChartPatternsLikeThePros.

Expect BTC/USD to drop to 102000 post-Fed rate decisionBTC/USD Update 📈
BTC rebounded from 103500 support, now at ~105500. Short-term correction may test 100000 psychological support ⚠️
I think the Fed's interest rate decision this time may cause BTCUSD to drop directly to 102000 .
⚡️⚡️⚡️ BTCUSD ⚡️⚡️⚡️
🚀 Sell@ 105000 - 104500
🚀 TP 102500 - 101500
Accurate signals are updated every day 📈 If you encounter any problems during trading, these signals can serve as your reliable guide 🧭 Feel free to refer to them! I sincerely hope they'll be of great help to you 🌟 👇

Gold Pullback in Uptrend Amid Middle East Tensions: Buy the Dip?📊 Clearly visible on the chart: current pullback within an uptrend.
🔍 News paradox: Despite escalating Middle East tensions 🌍, gold is trending lower—a key reason to emphasize buying the dip recently (watch out for bear trap scenarios 🚫📉).
💡 Trading logic breakdown:
Fed statement yesterday caused minimal volatility (market expectations priced in 💨);
This week’s pattern: Asian session rallies 📈 followed by post-Asian pullbacks 📉;
Entry strategy: Use Asian session highs as resistance reference for entries 🎯.
Technical reinforcement:
Risk alert: Geopolitical bullishness ignored → classic bear trap signal (bear trap 🚫);
Timing: Asian session highs form intraday resistance 🎯—look to enter on retracement.
Chart says it all—normal pullback in an uptrend 📊. Ironically, while Middle East conflicts should be gold-positive 🌍, prices are moving lower—a textbook 'buy the panic' setup 🚀. Following this week’s playbook 📅 (Asian session highs followed by dips), focus on Asian session highs as a resistance anchor for entries
⚡️⚡️⚡️ XAUUSD ⚡️⚡️⚡️
🚀 Buy@ 3345 - 3355
🚀 TP 3370 - 3380
Accurate signals are updated every day 📈 If you encounter any problems during trading, these signals can serve as your reliable guide 🧭 Feel free to refer to them! I sincerely hope they'll be of great help to you 🌟 👇

Dogecoin - This is the key structure!Dogecoin - CRYPTO:DOGEUSD - has to reverse now:
(click chart above to see the in depth analysis👆🏻)
A couple of months ago Dogecoin retested the previous all time high. We have been seeing a harsh correction of about -65% thereafter. However Dogecoin still remains in a bullish market with bullish structure. In order to validate this trend, a reversal must happen now.
Levels to watch: $0.15, $0.5
Keep your long term vision🙏🙏
Philip (BasicTrading)

Micron Technology - Starting the next +80% move!Micron Technology - NASDAQ:MU - perfectly respects structure:
(click chart above to see the in depth analysis👆🏻)
Starting back in mid 2024, Micron Technology created the expected long term top formation. We witnessed a correction of about -60%, which ultimately resulted in a retest of a confluence of support. So far, Micron Technology rallied about +60%, with another +80% to follow soon.
Levels to watch: $150, $180
Keep your long term vision!
Philip (BasicTrading)

Bearish AB=CDWhat's up, traders 👋
Let’s look at a clean Bearish AB=CD symmetry pattern playing out on USDJPY.
Price advanced from A → B, corrected sharply into C, then rallied again into D (145.767) — completing the AB = CD symmetry leg into a tight PRZ zone, now showing early signs of rejection.
🧠 Pattern Details:
Precise AB = CD symmetry
PRZ zone plotted with 145.504 (entry) to 145.793 (stop)
First target near 144.65 (100% extension)
Rejection aligns with short-term resistance + SMA 200 below
Textbook CD completion followed by indecision bar at D
Now it’s all about follow-through — we manage from structure, not emotion.
— C. Dela | #TradeChartPatternsLikeThePros

Major resistance ahead?USD/JPY is rising towards the resistance level, which is a pullback resistance that aligns with the 145% Fibonacci extension and the 61.8% Fibonacci projection. The price could reverse from this level towards our take profit.
Entry: 145.90
Why we like it:
There is a pullback resistance that lines up with the 145% Fibonacci extension and the 61.8% Fibonacci projection.
Stop loss: 146.78
Why we like it:
There is a pullback resistance level that aligns with the 145% Fibonacci extension.
Take profit: 144.62
Why we like it:
There is a pullback. support level.
Enjoying your TradingView experience? Review us!
Please be advised that the information presented on TradingView is provided to Vantage (‘Vantage Global Limited’, ‘we’) by a third-party provider (‘Everest Fortune Group’). Please be reminded that you are solely responsible for the trading decisions on your account. There is a very high degree of risk involved in trading. Any information and/or content is intended entirely for research, educational and informational purposes only and does not constitute investment or consultation advice or investment strategy. The information is not tailored to the investment needs of any specific person and therefore does not involve a consideration of any of the investment objectives, financial situation or needs of any viewer that may receive it. Kindly also note that past performance is not a reliable indicator of future results. Actual results may differ materially from those anticipated in forward-looking or past performance statements. We assume no liability as to the accuracy or completeness of any of the information and/or content provided herein and the Company cannot be held responsible for any omission, mistake nor for any loss or damage including without limitation to any loss of profit which may arise from reliance on any information supplied by Everest Fortune Group.

121 SymmetryHey awesome traders 🔥 Hope the trading week is flowing well.
This is a clean Bullish 121 Symmetry setup on CADJPY.
After a sharp XA impulse, price printed a deep AB correction, then rallied to C — forming a perfect CD symmetry leg into the PRZ zone (D = 105.593).
🧠 Key Pattern Logic:
AB ≈ CD 121 Symmetry
PRZ between 78.6% & 100% projection
Strong rejection at D, supported by the SMA 200
🎯 Target Zones:
TP1 → 106.75 (38.2% retracement of CD)
TP2 → 107.46 (61.8% Fibonacci, full reversal extension)
Optional final stretch: 107.96 (78.6%)
Clean reaction from structure. Now we let the market validate continuation.
Stay disciplined, trade structure, not emotion.
— C. Dela | #TradeChartPatternsLikeThePros

Bullish rise for the Loonie?The price has reacted off the resistance level which is an overlap resistance and could potentially rise from this level to our take profit.
Entry: 1.3703
Why we like it:
There is an overlap resistance level.
Stop loss: 1.3647
Why we like it:
There is an overlap support level.
Take profit: 1.3857
Why we like it:
There is a pullback resistance level that aligns with the 161.8% Fibonacci extension.
Enjoying your TradingView experience? Review us!
Please be advised that the information presented on TradingView is provided to Vantage (‘Vantage Global Limited’, ‘we’) by a third-party provider (‘Everest Fortune Group’). Please be reminded that you are solely responsible for the trading decisions on your account. There is a very high degree of risk involved in trading. Any information and/or content is intended entirely for research, educational and informational purposes only and does not constitute investment or consultation advice or investment strategy. The information is not tailored to the investment needs of any specific person and therefore does not involve a consideration of any of the investment objectives, financial situation or needs of any viewer that may receive it. Kindly also note that past performance is not a reliable indicator of future results. Actual results may differ materially from those anticipated in forward-looking or past performance statements. We assume no liability as to the accuracy or completeness of any of the information and/or content provided herein and the Company cannot be held responsible for any omission, mistake nor for any loss or damage including without limitation to any loss of profit which may arise from reliance on any information supplied by Everest Fortune Group.

Potential bullish rise for the Cable?The price has bounced off the support level which is an overlap support that aligns with the 50% Fibonacci retracement and could bounce from this level to our take profit.
Entry: 1.3399
Why we like it:
There is an overlap support level that aligns with the 50% Fibonacci retracement.
Stop loss: 1.3337
Why we like it:
There is a pullback support level that lines up with the 61.8% Fibonacci retracement.
Take profit: 1.3505
Why we like it:
There is a pullback resistance level that aligns with the 50% Fibonacci retracement.
Enjoying your TradingView experience? Review us!
Please be advised that the information presented on TradingView is provided to Vantage (‘Vantage Global Limited’, ‘we’) by a third-party provider (‘Everest Fortune Group’). Please be reminded that you are solely responsible for the trading decisions on your account. There is a very high degree of risk involved in trading. Any information and/or content is intended entirely for research, educational and informational purposes only and does not constitute investment or consultation advice or investment strategy. The information is not tailored to the investment needs of any specific person and therefore does not involve a consideration of any of the investment objectives, financial situation or needs of any viewer that may receive it. Kindly also note that past performance is not a reliable indicator of future results. Actual results may differ materially from those anticipated in forward-looking or past performance statements. We assume no liability as to the accuracy or completeness of any of the information and/or content provided herein and the Company cannot be held responsible for any omission, mistake nor for any loss or damage including without limitation to any loss of profit which may arise from reliance on any information supplied by Everest Fortune Group.

Bullish bounce?EUR/USD is falling towards the support level which is a pullback support that lines up with the 71% Fibonacci retracement and could rise from this level to our take profit.
Entry: 1.1445
Why we like it:
There is a pullback support level that aligns with the 71% Fibonacci retracement.
Stop loss: 1.1386
Why we like it:
There is a pullback support level that is slightly above the 61.8% Fibonacci retracement.
Take profit:1.1514
Why we like it:
There is an overlap resistance level that lines up with the 38.2% Fibonacci retracement.
Enjoying your TradingView experience? Review us!
Please be advised that the information presented on TradingView is provided to Vantage (‘Vantage Global Limited’, ‘we’) by a third-party provider (‘Everest Fortune Group’). Please be reminded that you are solely responsible for the trading decisions on your account. There is a very high degree of risk involved in trading. Any information and/or content is intended entirely for research, educational and informational purposes only and does not constitute investment or consultation advice or investment strategy. The information is not tailored to the investment needs of any specific person and therefore does not involve a consideration of any of the investment objectives, financial situation or needs of any viewer that may receive it. Kindly also note that past performance is not a reliable indicator of future results. Actual results may differ materially from those anticipated in forward-looking or past performance statements. We assume no liability as to the accuracy or completeness of any of the information and/or content provided herein and the Company cannot be held responsible for any omission, mistake nor for any loss or damage including without limitation to any loss of profit which may arise from reliance on any information supplied by Everest Fortune Group.
