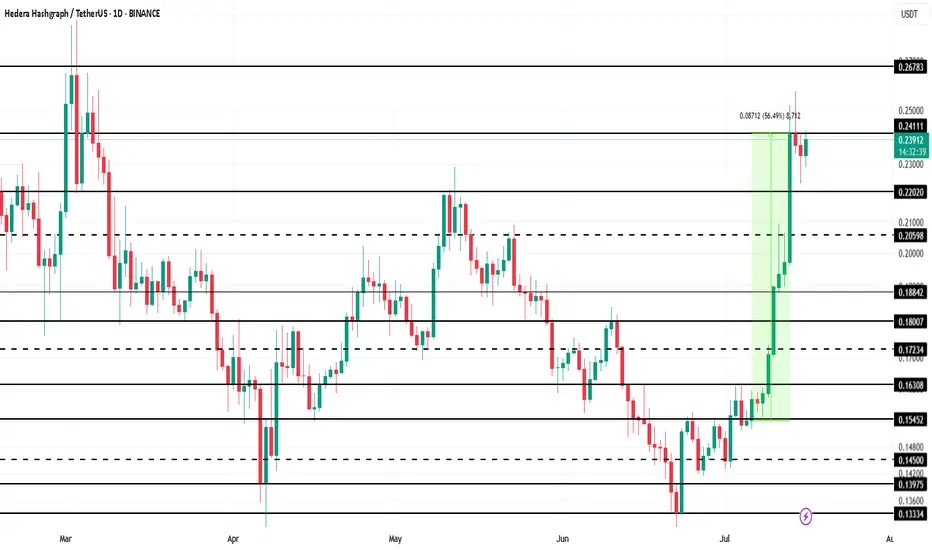
HBARUSDCOINBASE:HBARUSD try to break 0.257$ but we hope up-trend in last reaction to 0.257$ an break this level.
Best support: 0.239 - 0.230
Best resistance: 0.257 - 0.277 - 0.292
Please control risk management⚠️
HBARUSDT

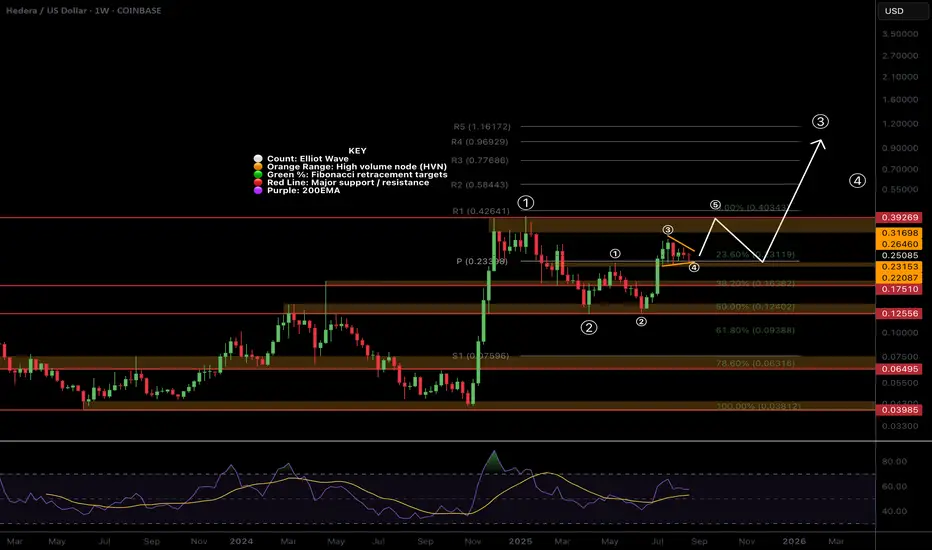
$HBAR Macro Chart - Ready for wave 5 of (1) of 3 up?CRYPTOCAP:HBAR appears to be printing a wave 4 triangle above the weekly pivot point. This implies the next move would be a terminal wave (5) of 1 of (3) likely completing with a poke above all time high to trap FOMO novice investor / traders. Classic Elliot Wave.
Wave 2 of (3) has a high probability of ending at the wave 4 triangle base which is the weekly pivot and 0.236 Fibonacci retracement adding confluence. This fib level support would indicating continued trend strength.
If it is a wave 1 of (3) is completing then we can expect the long term target to overextend the weekly R5 pivot point of $1.16, possibly reaching $3.
Weekly RSI remains at the EQ so plenty of room to grow.
Analysis is invalidated below the weekly pivot.
Safe trading
Hbar is forming a tradable structureBAR is printing many tradable structures on major timeframes. The current one is the possible bull flag with a great RR. Keeping in mind that the daily momentum and trend are still showing negative pressure. Keep your POI hand as the PA unfolds.

HBAR/USDT – Gearing Up for a Major Bullish Wave!🚀 Trade Setup Details:
🕯 #HBAR/USDT 🔼 Buy | Long 🔼
⌛️ TimeFrame: 1D
--------------------
🛡 Risk Management (Example):
🛡 Based on $10,000 Balance
🛡 Loss-Limit: 1% (Conservative)
🛡 The Signal Margin: $374.39
--------------------
☄️ En1: 0.19607 (Amount: $37.44)
☄️ En2: 0.17665 (Amount: $131.04)
☄️ En3: 0.16401 (Amount: $168.48)
☄️ En4: 0.15228 (Amount: $37.44)
--------------------
☄️ If All Entries Are Activated, Then:
☄️ Average.En: 0.17047 ($374.39)
--------------------
☑️ TP1: 0.25245 (+48.09%) (RR:1.8)
☑️ TP2: 0.305 (+78.92%) (RR:2.95)
☑️ TP3: 0.38787 (+127.53%) (RR:4.77)
☑️ TP4: 0.5266 (+208.91%) (RR:7.82)
☑️ TP5: 0.73806 (+332.96%) (RR:12.47)
☑️ TP6: Open 🔝
--------------------
❌ SL: 0.12493 (-26.71%) (-$100)
--------------------
💯 Maximum.Lev: 2X
⌛️ Trading Type: Swing Trading
‼️ Signal Risk: 🙂 Low-Risk! 🙂
🔎 Technical Analysis Breakdown:
This technical analysis is based on Price Action, Elliott waves, SMC (Smart Money Concepts), and ICT (Inner Circle Trader) concepts. All entry points, Target Points, and Stop Losses are calculated using professional mathematical formulas. As a result, you can have an optimal trade setup based on great risk management.
📊 Sentiment & Market Context:
Hedera Hashgraph (HBAR) is showing strong bullish potential on the daily timeframe, supported by increasing volume and a solid base formation around key demand zones. With broader altcoin sentiment improving and BTC showing stability, HBAR could be poised for a breakout rally in the coming weeks.
🔍 Fundamental Highlights:
HBAR powers the Hedera network, a next-gen public ledger built on a unique Hashgraph consensus mechanism—faster, more secure, and more scalable than traditional blockchains. With real-world enterprise partnerships (like Google, IBM, and Boeing), Hedera’s ecosystem continues to gain momentum as Web3 adoption expands.
⚠️ Disclaimer:
Trading involves significant risk, and past performance does not guarantee future results. This analysis is for informational purposes only and should not be considered financial advice. Always conduct your research and trade responsibly.
💡 Stay Updated:
Like this technical analysis? Follow me for more in-depth insights, technical setups, and market updates. Let's trade smarter together!

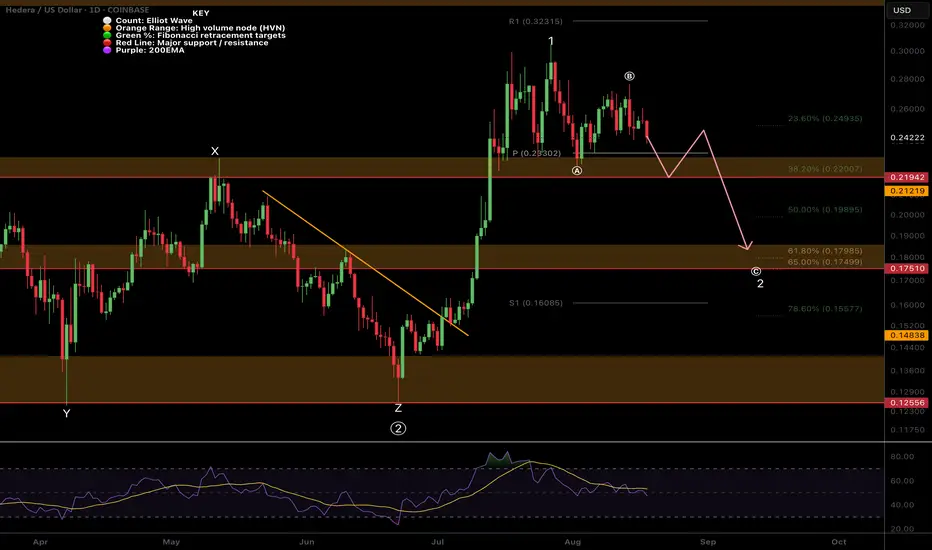
A Local look at the $HBAR retracementWave (c) appears to be underway with a target of the golden pocket and major support High Volume Node at $0.175.
There may resistance at the daily 200EMA along the way but it just seems to floating between supply and demand zones right now.
Daily RSI has room to fall.
Safe trading
HBARUSDT — Retest of Demand Zone After Breakout?HBAR/USDT is currently in a crucial retest phase after a strong breakout from its key accumulation zone around 0.199–0.217 (yellow box, Fib 0.5–0.618 area). The recent rally toward 0.29–0.30 highlighted strong buying momentum, but price is now consolidating near 0.243, suggesting a healthy pullback before the next potential move.
This structure often signals a bullish retest after breakout — but if key support levels are lost, it could trigger a deeper correction.
---
🔍 Structure & Pattern
Previous phase: HBAR traded sideways for months within a large range.
Recent move: Clean breakout above the accumulation zone.
Current phase: Retesting the demand zone.
Pattern in play: Bullish Retest / Flag Consolidation on the daily timeframe.
Bullish continuation trigger: Daily close above 0.29197 with volume confirmation.
Bearish invalidation: Daily close below 0.19928 (Fib 0.618).
---
📌 Key Technical Levels (1D)
Support (Demand Zone):
0.21707 (Fib 0.5) → first line of defense.
0.19928 (Fib 0.618) → strongest support; bullish invalidation if broken.
Resistance Levels:
0.26511 → minor resistance.
0.29197 → major resistance / breakout trigger.
0.33037 → TP1.
0.37526 → TP2.
0.40139 → local high & ultimate mid-term target.
Downside targets (if breakdown):
0.160–0.140 → prior consolidation zone.
0.093–0.087 → historical low.
---
🚀 Bullish Scenarios
1. Conservative (Breakout Buyer):
Entry: Daily close above 0.29197
Stop: Below 0.26511
Targets: 0.33037 / 0.37526
Potential reward: +35% to +54% from current levels
2. Aggressive (Buy the Dip):
Entry: 0.217–0.199 demand zone
Stop: Below 0.199 (bullish invalidation)
Targets: 0.265 / 0.292 / 0.330
Attractive R:R potential (>1:3) if demand holds
---
⚠️ Bearish Scenarios
1. Breakdown of 0.199:
Daily close below 0.199 → structure invalidated.
Downside targets: 0.16 → 0.14, and possibly 0.087 (historical low).
2. Rejection at Resistance:
Failure to break 0.292 + formation of a lower-high = possible range or distribution phase.
Price could revisit 0.217 demand zone again.
---
📈 Strategy & Risk Management
Aggressive traders: Buy dips at 0.217–0.199 with tight stops.
Conservative traders: Wait for confirmation above 0.292 before entering.
Risk management: Limit exposure to 1–2% per trade.
Extra confirmation: Watch for volume spikes or bullish candlestick reversals (hammer, engulfing) in demand zones.
---
✅ Conclusion
HBAR is in a critical demand retest. As long as 0.217–0.199 holds, the bias remains bullish, with mid-term targets at 0.33–0.37. A daily close below 0.199, however, would shift momentum bearish and open the door to a much deeper correction.
HBAR offers a high R:R opportunity for both aggressive dip buyers and conservative breakout traders — making it one of the setups to watch closely in the coming weeks.
#HBAR #HBARUSDT #Hedera #Crypto #TechnicalAnalysis #PriceAction #SwingTrade #Fibonacci

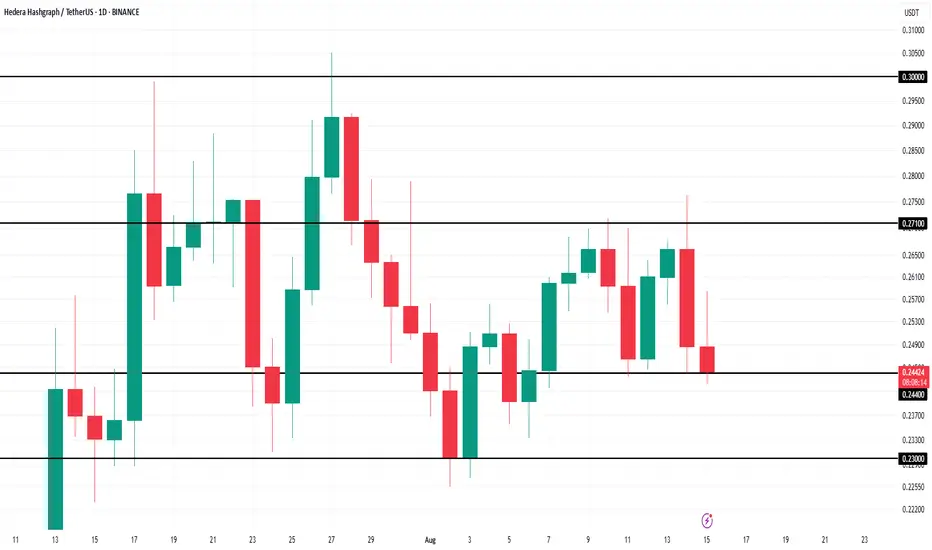
HBAR Eyes Bitcoin for Price Recovery Amid Market UncertaintyBINANCE:HBARUSDT is currently consolidating, trading at $0.255 while oscillating between $0.271 and $0.244 . The narrow range reflects investor caution, with traders awaiting external market cues. Without a decisive breakout, the altcoin may continue drifting sideways in the immediate term.
If Bitcoin strengthens and resumes its rally, BINANCE:HBARUSDT could break resistance at $0.271. Such a move may open the door for gains toward $0.291, with potential upside extending further if bullish conditions persist.
Alternatively, a Bitcoin downturn could drag BINANCE:HBARUSDT lower, pushing it beneath $0.244 support. In such a scenario, the altcoin risks falling to $0.230, undermining the bullish thesis and reinforcing caution among investors.

HBAR Bull Flag Is Ready to Explode, But Only If One Level FallsYello, Paradisers! Is #HBAR quietly setting up for its biggest breakout of the year? The chart is heating up fast, and the next move will be decisive.
💎Since forming a double bottom around $0.128, HBAR has bounced sharply, showing clear strength. The price action is now shaping into a potential bullish flag pattern, but the bulls are stuck at a critical barrier.
💎The $0.285–$0.30 zone is proving to be a major challenge, as it combines both horizontal resistance and the 61.8% Fibonacci retracement. Since mid-July, not a single daily candle has been able to close convincingly above this level, a clear sign of just how important this wall is.
💎For #HBARUSDT, a strong breakout and close above $0.30 with real volume would open the doors to a major bullish move, targeting the $0.380–$0.410 zone. This range not only marks the next strong resistance but also aligns with HBAR’s 52-week high.
💎On the downside, solid support lies between $0.235–$0.22, a zone that has held firm since mid-July within a converging triangle formation. As long as HBAR stays above this range, the bullish setup remains valid, and the breakout pressure continues to build.
Paradisers, strive for consistency, not quick profits. Treat the market as a businessman, not as a gambler.
MyCryptoParadise
iFeel the success🌴

HBAR Price Stalls as Outflows Hit 2-Month High—What’s Next?BINANCE:HBARUSDT price is currently at $0.243 , trapped within the range of $0.244 to $0.271. The mixed market cues, including the bearish CMF and the relatively neutral RSI, suggest that HBAR could continue consolidating.
This sideways movement is expected to persist unless there is a major shift in investor sentiment or a market catalyst that could push the altcoin in either direction.
If outflows intensify and BINANCE:HBARUSDT falls below its $0.244 support level , the bearish case could become more likely. In such a scenario, the price may drop further to $0.230, invalidating the current bullish-neutral outlook and signaling a deeper correction for HBAR.
$HBAR Printing an ABC in wave 4?Wave C of an ABC correction in wave 4 appears to be underway in CRYPTOCAP:HBAR
This would see price have a quick drop below the daily pivot testing the major support High Volume Node and rising daily 200EMA as support before continuing up in wave 5. This is also the .382-.5 Fibonacci retracement a typical area for wave 4 to end per Elliot wave rules. Lots of confluence in this area.
RSI is still making its way down from overbought. Investor psychology is still irrationally bullish giving opportunity for professional traders to make some volatility bucks.
Analysis is invalidated if price breaks $0.273 upgrading the count to wave 4 completing at the current wave (a) bottom.
Safe trading
$HBAR Is Loading… $0.30 Next?CRYPTOCAP:HBAR has turned its key resistance into support, showing a strong shift in market structure. After reclaiming this level, price has been holding steady above it, supported by the 100 EMA.
As long as bulls defend this zone, the next upside target could be the $0.30 area and beyond.
A clean breakout above that level could open the door for further gains.
DYOR, NFA

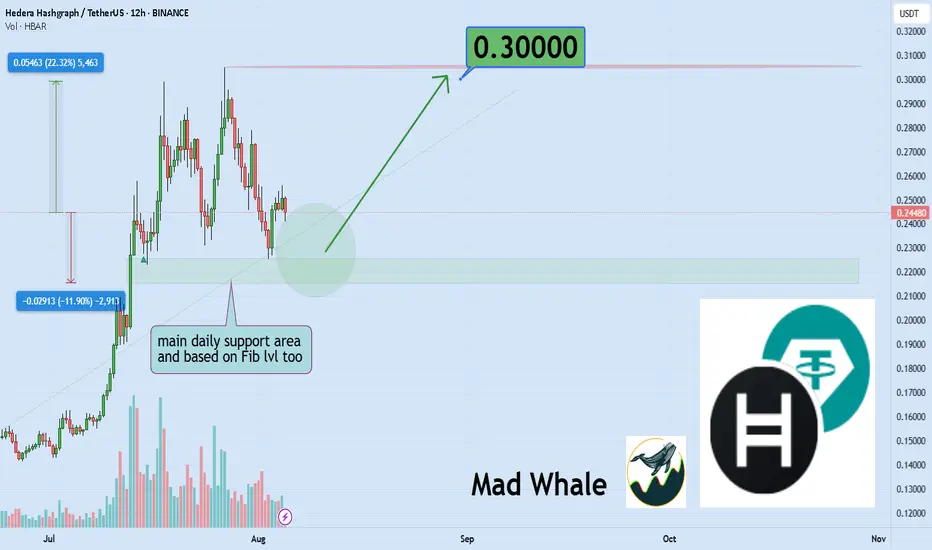
HBAR Set for 22% Rally if Key Support Holds Strong 0.30 targetHello✌
Let’s analyze Hydra Hashgraph’s price action both technically and fundamentally 📈.
🔍Fundamental analysis:
If HBAR’s real use grows, burning fees could rise and boost investor trust. But with 42.4 billion coins out (85% of max), steady demand is needed to handle new unlocks 📊.
📊Technical analysis:
BINANCE:HBARUSDT is currently trading near a confluence of key daily support levels 📉. If this zone holds, the setup suggests a potential upside of around 22 percent toward the 0.30 target 🎯.
✨We put love into every post!
Your support inspires us 💛 Drop a comment we’d love to hear from you! Thanks , Mad Whale
Hedera (HBAR) – Pullback Opportunity After 100% RallyHBAR has surged 100% recently. With the broader market entering contraction, we’re now watching for a healthy retracement into key support, aligning with the 50% Fibonacci level and a fair value gap (FVG). This could be the formation of a higher low before continuation.
🔍 Setup Overview:
Entry Zone: $0.22 – $0.19
Take Profits: $0.26 / $0.32 / $0.37
Stop Loss: Daily close below $0.18
Bias: Bullish continuation from support
🧠 Trade Idea:
Price is approaching a confluence zone of Fib support and unfilled imbalance. As long as daily structure holds above $0.18, the bullish case remains intact. This zone offers an attractive long setup for the next move higher, targeting previous resistance levels.
⚠️ Invalidation:
A daily close under $0.18 would break structure and invalidate the setup. Monitor price action and volume confirmation around this support zone for entry timing.

HBARUSDT – Planning Ahead, Not Reacting Late In the event of a potential Q3 correction, I believe HBARUSDT could revisit the green box zones below.
These areas aren’t guaranteed bounce points — but they represent fair value in a market pullback scenario.
🧭 How I’m Preparing
📌 No blind orders
📌 Set alerts at the green zones
📌 When price hits, switch to 1-hour
📌 Wait for upward breakout + rising CDV
If it aligns, I take the trade — one bullet only.
"The smart investor doesn’t fear the correction — they prepare for it."
No rush. No panic. Just discipline.
Let’s stay ready.
— UmutTrades 💙
📌I keep my charts clean and simple because I believe clarity leads to better decisions.
📌My approach is built on years of experience and a solid track record. I don’t claim to know it all but I’m confident in my ability to spot high-probability setups.
📌If you would like to learn how to use the heatmap, cumulative volume delta and volume footprint techniques that I use below to determine very accurate demand regions, you can send me a private message. I help anyone who wants it completely free of charge.
🔑I have a long list of my proven technique below:
🎯 ZENUSDT.P: Patience & Profitability | %230 Reaction from the Sniper Entry
🐶 DOGEUSDT.P: Next Move
🎨 RENDERUSDT.P: Opportunity of the Month
💎 ETHUSDT.P: Where to Retrace
🟢 BNBUSDT.P: Potential Surge
📊 BTC Dominance: Reaction Zone
🌊 WAVESUSDT.P: Demand Zone Potential
🟣 UNIUSDT.P: Long-Term Trade
🔵 XRPUSDT.P: Entry Zones
🔗 LINKUSDT.P: Follow The River
📈 BTCUSDT.P: Two Key Demand Zones
🟩 POLUSDT: Bullish Momentum
🌟 PENDLEUSDT.P: Where Opportunity Meets Precision
🔥 BTCUSDT.P: Liquidation of Highly Leveraged Longs
🌊 SOLUSDT.P: SOL's Dip - Your Opportunity
🐸 1000PEPEUSDT.P: Prime Bounce Zone Unlocked
🚀 ETHUSDT.P: Set to Explode - Don't Miss This Game Changer
🤖 IQUSDT: Smart Plan
⚡️ PONDUSDT: A Trade Not Taken Is Better Than a Losing One
💼 STMXUSDT: 2 Buying Areas
🐢 TURBOUSDT: Buy Zones and Buyer Presence
🌍 ICPUSDT.P: Massive Upside Potential | Check the Trade Update For Seeing Results
🟠 IDEXUSDT: Spot Buy Area | %26 Profit if You Trade with MSB
📌 USUALUSDT: Buyers Are Active + %70 Profit in Total
🌟 FORTHUSDT: Sniper Entry +%26 Reaction
🐳 QKCUSDT: Sniper Entry +%57 Reaction
📊 BTC.D: Retest of Key Area Highly Likely
📊 XNOUSDT %80 Reaction with a Simple Blue Box!
📊 BELUSDT Amazing %120 Reaction!
📊 Simple Red Box, Extraordinary Results
📊 TIAUSDT | Still No Buyers—Maintaining a Bearish Outlook
📊 OGNUSDT | One of Today’s Highest Volume Gainers – +32.44%
📊 TRXUSDT - I Do My Thing Again
📊 FLOKIUSDT - +%100 From Blue Box!
📊 SFP/USDT - Perfect Entry %80 Profit!
📊 AAVEUSDT - WE DID IT AGAIN!
I stopped adding to the list because it's kinda tiring to add 5-10 charts in every move but you can check my profile and see that it goes on..

Can Hedera Hashgrap sustain the breakout for 17% gains to $0.27?Hello✌
Let’s analyze Hedera Hashgraph’s upcoming price potential 📈.
BINANCE:HBARUSDT has broken above multiple daily resistance levels and is now holding near a strong Fibonacci support and daily demand zone 📊. This setup suggests a potential upside of around 17%, with a primary target at 0.27 🚀. Monitoring volume and price action near support will be key for continuation.
✨ Need a little love!
We pour love into every post your support keeps us inspired! 💛 Don’t be shy, we’d love to hear from you on comments. Big thanks , Mad Whale 🐋

Hedera 2025 All-Time High · Simple Analysis Bullish ConfirmedHedera is about to close five weeks green. Five weeks green and we only have a minor advance, relatively speaking. Some 100%. Back in late 2024 five weeks green resulted in more than 800% growth. Huge difference, but after the fifth week growth stopped. This time it will be different.
We already have five weeks of bullish action and this is only portion of the entire bullish period, just a small part. This can continue for months, then a stop and one final jump. Or this can start now and just keep on going until it peaks and that's it, nor more growth until the next bullish phase. So we would see a bear market after the completion of the bull market and the only bullish action would be corrections within the bear market. Right now market conditions are extremely bullish.
We have a long-term lower high. In early 2025 the action peaked below the 2021 all-time high. The wave that is developing now will break this barrier and produce a new all-time high. This is very easy to predict, market conditions are bullish.
The interesting part will be to see how far up Hedera will go. We can use this project, since it is definitely going to be one of the first to peak, to know how the rest of the market will perform. Easy we have between 200% and 400% potential for growth.
I hope you are being entertained and I really hope you enjoy the content. If you do, give me a follow @MasterAnanda
Namaste.

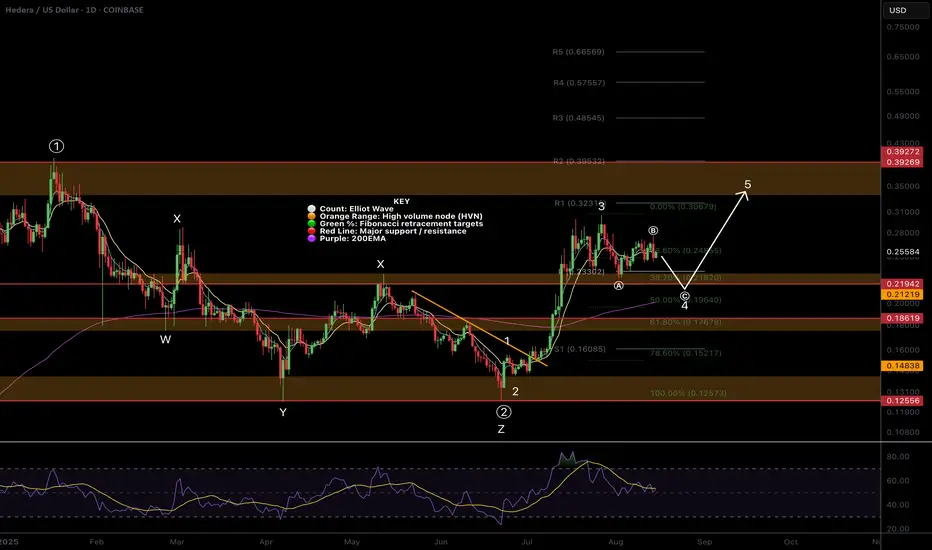
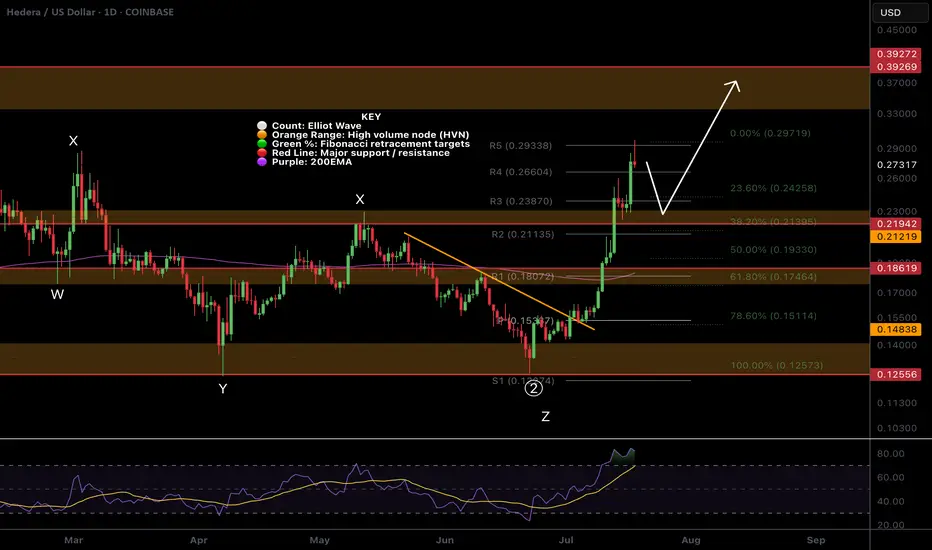
$HBAR Wave 4 finishing soon?CRYPTOCAP:HBAR Hedera appears to have completed wave 4 with the test of the High Volume Node support at the 0.382 Fibonacci retracement.
Wave 5 has an expected target of the High Volume Node resistance at $0.4 before a larger retracement in wave 2 aligning with my summer pump august / September dump view.
Analysis is invalidated below $0.1933 at the 0.5 Fib retracement and will be updated to a wave 2 instead of 4.
Safe trading

Hedera Update · Keep Holding · No Selling, YetHedera (HBAR) looks awesome. The action and chart right now is one of the best in the market. I love the fact that the candles are moving straight up. This can be equated to how FUN Token (FUN) has been performing in the past month. What one does, the rest follows.
The most interesting signal comes from MA200. Trading is happening above this level and that's all we need to know. When HBARUSDT broke above it, any bullish potential and bullish signals become fully confirmed. It is not a question of "if" anymore but instead a done deal. Growth is expected to happen for a period ranging between 3-6 months once this signal shows up.
This means you can see a strong retrace in a month and still, you remain calm and hold because you know higher prices are still possible. This means that if you see a correction after three months, you can take profits of course but still know that the top is not in. It will take a while before the entire bullish process is complete.
The top is not only calculated based on time duration but also on price levels and marketwide action. Depending on how the rest of the market is doing; looking at Bitcoin and at what price the pair in question is trading can help us confirm if the top is in. For now you just keep on holding.
Each chart/project/pair needs to be considered individually. If your technical analysis ability is lacking, you can always contact me and I will publish an update for you. If you publish news articles, videos, trade-signals or even TA, you can come to me for confirmation, ideas or just inspiration and I will take care of the rest. Once you have your update you can decide what actions to take. It is still early in this game.
The initial portion of the bull market is long gone. Here it started in November 2024, you can see it as the "market bottom." We are on the second portion now in 2025. The year started with a correction and the correction ended in April-June with a very strong higher low. Projects like this one reveal super-strength compared to the rest of the market, it happens with the top 100.
If you consider some of the smaller projects I've been sharing, you see double-bottoms compared to 2024, 2023 and even 2022 and even new all-time lows. Here the low in 2025 is far away from November 2024 and this is good news. That is why I say that each chart/pair needs to be considered individually because conditions are not the same for each project. The market has now thousands of good projects and tens of thousands of trading pairs. It is impossible to say how one will move based on the other because they are just too many and too far away.
The bigger picture and the general bias, yes, bullish all across. Exact resistance and support levels, where to sell, where to buy; should I continue to hold? This is what needs to be considered individually.
Your support is appreciated.
If you enjoyed, please follow.
Namaste.

$HBAR Pull Back Started, What is the target?CRYPTOCAP:HBAR doing extremely well, the R5 daily pivot point has been hit and a pull back should be expected before continuation!
It appears wave 3 is now complete and wav4 i expected to pull back to the 0.382 Fibonacci retracement which adds confluence to the High Volume Node in the same place at $0.22 our previous take profit #2 target.
Daily RSI is overbought but no bearish divergence yet! Price behaviour can often pop above the swing high just made to trap new buyers before dumping hard! Watch out for that, that would be the bearish divergence print also.
The next take profit is $0.39
Safe trading
HBAR Price Drop To $0.20 Likely; $53 Million Liquidation AheadBINANCE:HBARUSDT price currently sits at $0.235, encountering resistance at $0.241. Despite its recent rally, the broader market conditions are pulling it down, and the next major support level is at $0.220 . If the altcoin fails to hold above this level, it could slide towards $0.200.
Looking at the liquidation map, there is a real possibility of significant losses for $BINANCE:HBARUSDTtraders. The map shows that if the price drops to $0.20 or lower, approximately $53 million worth of long positions would be liquidated . This would create a wave of selling pressure and potentially drive the price down further.
In the event of a surge in bearish sentiment or increased selling pressure, BINANCE:HBARUSDT could fall below $0.220 , hitting the psychological support level at $0.200. A drop below this critical level would likely trigger the $53 million worth of liquidations, further exacerbating the decline.
However, if BINANCE:HBARUSDT manages to hold above $0.220 and successfully breaches the $0.241 resistance, there could be an opportunity for a rally. A successful bounce off $0.220 could push HBAR towards $0.267 , providing some relief to traders and reinforcing its bullish outlook.
HBARUSDT Forming Bullish BreakoutHBARUSDT is showing strong signs of a potential bullish trend as it pushes higher with increased momentum. The recent breakout on the daily chart confirms that buyers are stepping in with confidence, supported by a good surge in volume. This uptick in activity is drawing fresh attention from traders and investors who recognize Hedera Hashgraph’s long-term potential in the crypto market. With this breakout move, HBAR could be setting up for a 90% to 100% gain in the coming weeks if market conditions stay supportive.
Hedera’s fundamentals remain solid as it continues to expand partnerships and grow its ecosystem of decentralized applications. Many investors are seeing HBAR as a unique blockchain alternative thanks to its hashgraph consensus mechanism, which promises faster transactions and lower fees compared to traditional blockchains. This unique tech angle has strengthened investor interest, positioning HBAR as a promising long-term play in the altcoin space.
The technical setup on HBARUSDT suggests that further upside may be on the horizon. If the price holds above the breakout level and continues to build higher lows, the next resistance zones could be tested swiftly, potentially driving the pair to new highs. As always, traders should watch for sustained volume and healthy pullbacks, which can offer additional opportunities to join the trend.
✅ Show your support by hitting the like button and
✅ Leaving a comment below! (What is You opinion about this Coin)
Your feedback and engagement keep me inspired to share more insightful market analysis with you!

HBARUSDT 4H Chart Analysis |Volume & Fibonacci Reaction in FocusHBARUSDT 4H Chart Analysis | Volume & Fibonacci Reaction in Focus
🔍 Let’s break down the latest HBAR/USDT setup, highlighting a clear technical reaction and a new opportunity on the horizon.
⏳ 4-Hour Overview
HBAR has completed a strong impulsive leg after breaking above the RR2 of the key reversal trendline, supported by notable volume confirmation. This impressive surge was then followed by a corrective leg—a healthy sign for bulls, especially for those who missed the initial breakout.
📉 Corrective Phase & Fibonacci Support
- The current corrective leg is characterized by decreasing volume, suggesting profit-taking rather than heavy selling pressure.
- Notably, price has reacted firmly at the 0.236 Fibonacci retracement level, aligning with classic pullback zones for continuation setups.
- This volume pattern shows traders are waiting for the next major move rather than exiting positions.
🔺 Bullish Continuation Setup
- A strong candle close above the $0.255 level on either the 1H or 4H timeframe will serve as a clear bullish confirmation.
- Such a breakout may pave the way for another impulsive leg upward, with the first upside target identified near $0.30—roughly 19% higher from the recent candle close.
📊 Key Highlights:
- The prior trend reversal was validated by surge in volume and momentum.
- Volume decline during the correction favors further upside rather than distribution.
- Price is respecting key Fibonacci levels, hinting at trend continuity.
- A confirmed close above $0.255 unlocks the next target at $0.30, marking a potential 19% move.
🚨 Conclusion:
HBAR is showing textbook trend continuation signals. For those sidelined after the initial move, the current consolidation offers a safer re-entry point, with actionable confirmation above $0.255. Stay alert for a strong candle close and keep the $0.30 target in view as bullish momentum builds.

I have been waiting to get my signal on HBAR and finally got it!Trading Fam,
I know my crypto portfolio is getting destroyed as I prepare for a future altcoin run towards the latter half of this year. And it sucks. Bitcoin hodl'ers definitely look like the true champions at this point outpacing us altcoin traders by a huge margin. However, I've been through this before. Multiple times. And I know that when they run, altcoins will more than make up for our losses and pay massive dividends. We simply have to remain patient and stick to our strategy which is to continue to look for those great entries into some of our larger cap altcoins. So, that is what I'll do until one of two things occurs: A) either my portfolio dies completely or B) I am able to prove that altcoin traders can eventually beat the Bitcoin hodl'ers. It will be option "B". That's my final answer.
You get to watch all this unfold. And fortunately for you, I am the guinea pig. If you want to join me in these trades, you have that option. If you want to sit by and watch this entertainment, which admittedly hasn't been pretty as of late, you can do that too. But, in my heart of hearts, I believe our strategy will eventually pay off.
With that said, I've long been waiting for my indicator to give me the signal on this outstanding altcoin, HBAR. I mean, it's been months. The last time it flashed green for me we went from 12 cents to 24 cents. Unfortunately, my cash reserves were locked up in other trades. Today is different.
I've entered this trade at around 15 cents. My first target will be 17 cents. My final target will be 23 cents giving us more than 50% profit if achieved.
On the technical side, you can see that we have entered a beautiful area of large liquidity. This is where buyers typically step in. My bet is that they will do so again to break us to the upside of that descending trendline taking us at least to our VRVP point of control on this chart (yellow line).
I know that it is not easy trading alts in this volatile political/geopolitical global environment we have somehow sadly inherited. But I have to remain optimistic that the collective good in man will eventually prevail over the corrupt and mostly misanthropic characters we call "leaders". Once these tides begin to shift and show, massive energy will propel us onward and upward into the future. I believe cryptocurrency will help in this shift. What we will then witness will be like nothing we've seen before. This remains my hope as I continue to tread these perilous trading waters.
✌️ Stew
