HDFC BANK TOMORROWTo support us Please Join us on YouTube for Best momentum Stocks, Nifty and Bank Nifty Levels on a Daily Basis cause Proper Planning, Zero Greed, Right Entry, and Exit, can win you big Bucks: - 'TECHNICAL ANALYSIS BY RK'
HDFC BANK
BUY ABOVE 1565
STOPLOSS 1550
HDFCBANK

HDFC BANK Analysis 04/03/2021as we can see there is a bearish divergence of Price with MACD and it got its confirmation as the price has fallen and tested the immediate Support Area, and MACD and signal lines has crossed in MACD indicator which is the sign of trend reversal and price correction.
the trend is range bounding in a ascending parallels channel and currently touching the top bond
we may have an other impulsive wave to the 1 TP and alternatively retrace down to the 2 TP.

HDFC Bank pole and flag patternhdfc bank forming pole and flag pattern... waiting for either side breakout..


HDFC BANK SHORTHDFC BANK SHORT.
The Banks have started to show weakness and HDFCBANK has broken a crucial level of structure

hdfc bankvery simple yet effective.
any upward move over support has a potential to give 4.30%
if the support of 1532 breaks go short upto until next support.


HDFCBank short HDFC Bank reacting from 1.618 Fib and 2.618 FIB Projection. Bearish Div on Daily.
Short below 1580 with SL as 1625
Tgts are 1500 and 1450
Nice R:R


SBI- Will it proclaim the throne of biggest lender?The stock has broken out of 10 years of range. Volumes like that were seen a decade ago atleast. Is smart money giving another attempt to India's Biggest lender? Will it Exceed HDFC Bank's Market Cap this bull run.
Well, time will tell.

HDFC BANKS LONGPRICE GO UP AND NEXT PROFIT TAKEING AREA IS 1655 THEN MAYBE PRICE DOWN SOME AND RETRACE.NEXT IS NEXT

HDFC BANK SHORT POSITION YOU CAN MAKE IT CAN GIVE CAR BOUNCE HDFC BANK SHORT POSITION YOU CAN MAKE IT CAN GIVE CAR BOUNCE BEFORE IT FALLS............

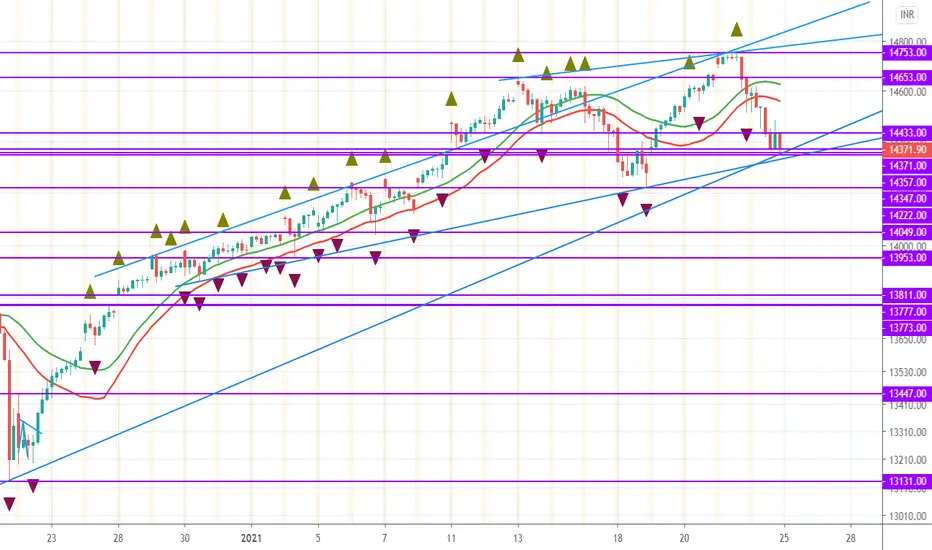
Trade Set up See here I have made major support and resistance lines in a 1 hr Chart for Nifty. As you can see 14347 to 14443 (86 Points ) zone is a painful one. Markets can be very volatile in this range hence for this zone best will be to use an option hedging strategy, do not take a directional view in this range. Also, keep an eye on the support trendlines near closing i.e 14371. Closing below support Trendline line (Retest may occur or not I can't predict if it does and again red candle forms then markets will definitely touch 14222 and then to next support ) will cause some selling. Use these support and resistance and trendline to enter trades. In terms of going long look for trendline breakout in 30 or 15 min candle. Remember as markets fell heavily on Friday therefore general trend in the retail trader is to short the market. You shouldn't be impulsive in shorting, always wait for confirmation don't get trapped on any side, try to read the psychology of 90% of traders, and smartly make your move. See those who missed the rally will always come to buy at major support levels, hence you can use these to do scalp trade on the buy-side too to earn quick money till budget during intraday.

Short sell opportunity in HDFC BANKDistribution phase expected
Kindly trade at your own risk.
Good Luck 🤞
