Range-Bound Rocket: BTC’s Coiled Spring Between S1 and R3-ATHRange Bound Rocket: BTC Loaded and Coiled for $120k Retest
Description:
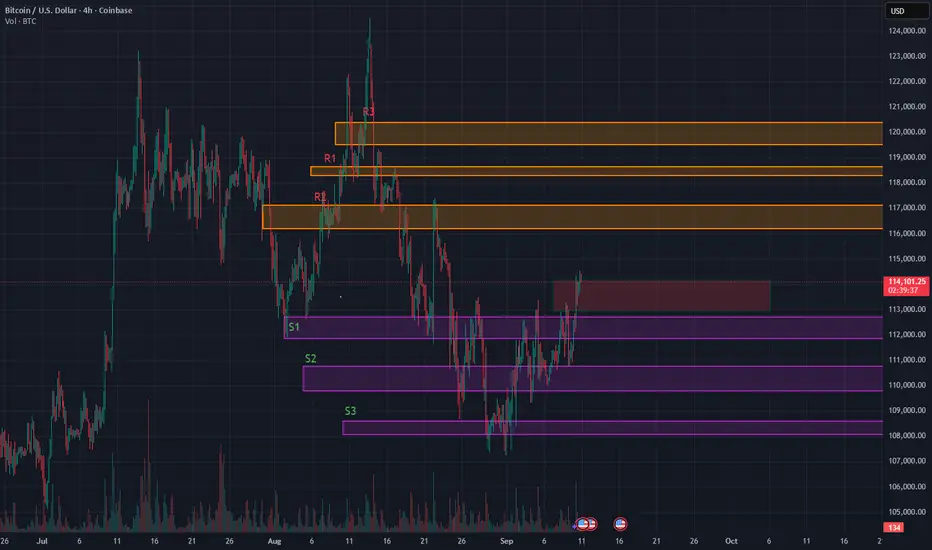
BTC is now trading around $114,260, still inside the range I’ve flagged earlier. We reloaded at our previously posted support zones between $110k and $111k. That gives us a strong base.
I’m watching for acceptance above the $113k to $114k red box, which overlaps with the neckline of a potential reverse Head & Shoulders on the 4‑hour chart. It hasn’t triggered yet but we are in validation mode. (expecting a retest to 113k and then a break up) If we get a breakout with volume expansion and wide‑bodied candles, I’ll treat that as a valid activation. Target remains $119k and above.
This table shows how likely BTC is to stay above certain price levels over the next two weeks based on current volatility. These are not predictions, they represent statistically expected ranges based on price behavior.
2WK/Probability, Price Level, Meaning
90%, ~$96,700 BTC is very likely to stay above this level
75%, ~$103,200 BTC has a strong chance of staying above here
50%, ~$111,000 This is the midpoint, BTC has equal chance of being above or below
25%, ~$119,400 BTC has a one in four chance of closing higher than this
10%, ~$127,400 Only a small percentage of outcomes put BTC above this level
Key takeaways:
BTC is currently trading around $114,260, sitting just above our red resistance zone at $113,000 to $114,000.
Our first upside target, $118,000, lines up with the top 25 to 30 percent range of expected outcomes. This is reachable if the broader market stays supportive.
$120,000 sits closer to the top 20 percent threshold. BTC would need strong momentum and favorable macro data to push there in the next two weeks.
Downside probabilities
While the structure looks bullish, we should still consider these potential retracement levels:
Around 46 percent chance BTC dips below $110,000
Approximately 43 percent chance it drops under $109,000
Roughly 30 percent chance BTC trades below $105,000
These downside paths are consistent with our S2 and S3 support zones, which were successfully defended during the last major pullback.
What I'm doing and suggest :
Breakout confirmation:
I’m looking to add above $113k to $114k only if volume expands and candles show conviction, meaning minimal wicks and strong closes. Weak volume or upper wicks mean the breakout could fail. Main stop is back inside the range. Scalpers can use a tighter invalidation below $112.2k.
Reload zone:
A move into $110k to $109k is a statistically common retest. I’ll look for buyer defense and fading downside pressure to reload.
Volatility risk:
I'm already positioned long from our previously posted support zones around $110k to $111k, so I’m not actively adding or hedging right now. Into CPI and the Fed, I’m staying hands-off unless we get a clear breakout or strong market signal.
For those not in position:
Avoid chasing breakouts before the event
Look for confirmation or reaction post-data
If we get a volatility spike, retests of $110k to $109k are still statistically common and may offer a better entry
The goal is to avoid being overexposed heading into binary catalysts. I’m holding my current spot exposure and letting the trade breathe.
If no breakout forms:
I expect BTC to remain in a range between $111k and $118k. Support zones from prior posts maintained a bullish bias. If BTC consolidates below $114k but keeps forming higher lows, I’ll consider that ongoing accumulation.
Catalysts to monitor:
Nasdaq or NQ breakdown
• Tech strength: Nvidia up ~30% YTD on strong Blackwell Ultra demand, ADI and MX showing strength despite macro headwinds.
Jobless claims rising again
• U.S. jobless claims are rising to 237K, signaling labor market cooling. Continuing claims are easing but job additions in August were weak at just 22K. Recent wide downward revisions (~911K fewer jobs year-to-date) reinforce rate‑cut bets.
Geopolitical risk
• Geopolitical tensions remain tail‑risks.
Fed rate tone and CPI reaction
• Fed tone and CPI outputs are increasingly important as data is tilting soft and markets are pricing in easier policy.
• The USD’s trajectory matters. Further weakness helps BTC and tech space gain more cushion.
Tech remains a key driver. AI and semis continue to lead Nasdaq strength, and BTC still tracks equity moves closely. A soft dollar also reduces market drag and supports upside potential.
Head_and_shoulder
SILVER XAGUSD30 min TF Short Scalp
Silver is very bulish Just a pull back is what we can capture , very risky trade but Head & shoulder pattern is making it look good
Trade will be active once complete Bearish candle close below the neckline
Must book partial profit, Once achieve 50 % towards TP put your SL to tp , and partial profits

NQ - Nasdaq Is Coming For Your Stop!OK, there's not much to say.
That guy looks bad. I mean, really bad §8-)
Let's see if we can use the bad mood for a nice short down to the bottom.
Ohhhh Myyyy.....

EURAUD upside is endingThe EURAUD bullish run may be coming to an end.
Price action has broken trend support and formed a head-and-shoulders trend reversal pattern.
From a fundamental perspective, the AUD is an attractive investment due to its stable inflation and robust GDP growth.
If EURAUD doesn't become bearish, we may see the price action form a consolidation.
OANDA:EURAUD FX:EURAUD

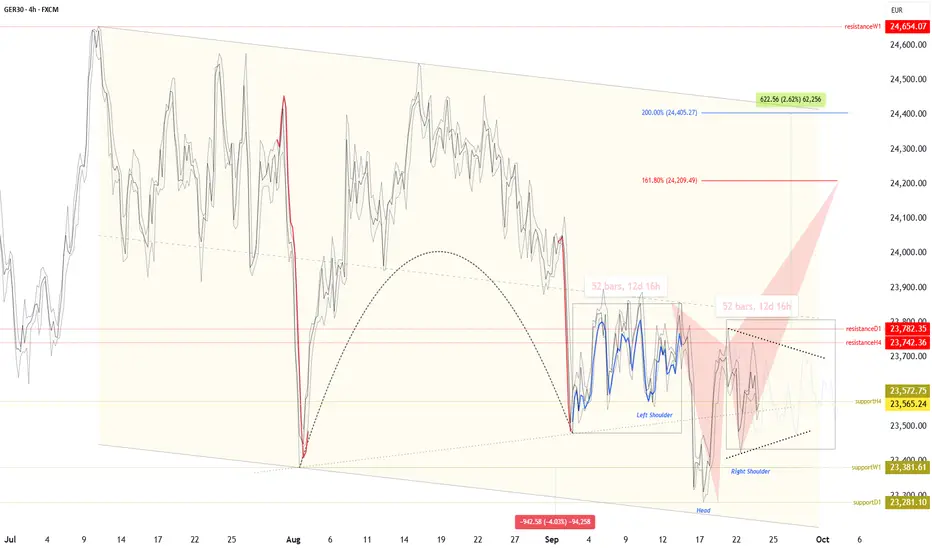
German DAX | Inverted Cup vs Inverted Head & ShouldersThe FX:GER30 continues to trade around critical technical levels, where multiple patterns are competing to determine the index’s next direction.
In the short term, the main risk remains with the inverted cup and handle pattern, formed above the weekly fractal support at €23,381, which could project a drop toward €22,483 (around -4%). A new daily fractal support has emerged at €23,281, adding pressure just below the previous support/neckline.
On the other hand, the index is also building the base of a potential inverted head and shoulders pattern, with its trigger lying in a breakout above the daily resistance at €23,782. If this breakout is confirmed, it opens the door for strong bullish momentum toward €24,400 (200% Fibonacci extension and the classical target of the pattern). This move could also validate a parallel consolidation channel, suggesting the formation of a bullish flag.
Key fractals to monitor
Weekly resistance: €24,654
Daily resistance: €23,782 (H&S neckline/resistance)
Intraday resistance: €23,742
Intraday support: €23,572
Weekly support: €23,381
Daily support: €23,281
The DAX is at a decision point:
Clear break below €23,281 → activates bearish scenario (target €22,483) .
Sustained breakout above €23,782 → validates bullish scenario (target €24,400) .
Safe Trades,
André Cardoso
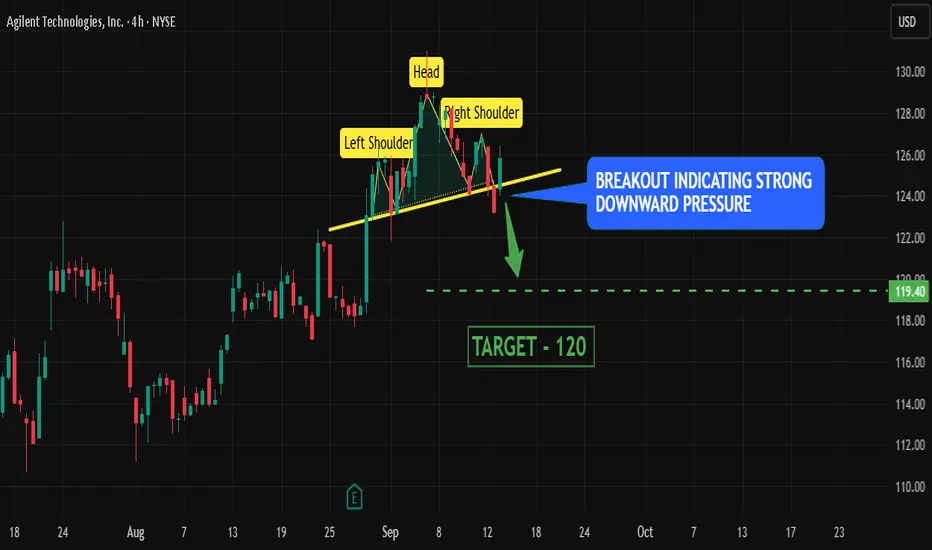
Head & Shoulder breakout in Agilent stock pointing Bearish move
HEAD AND SHOULDER BREAKOUT -
price broke out of head and shoulder pattern with a strong confirmation indicating strong downward pressure for the stock.
Definition -
(i) Left Shoulder → price rise, then fall
(ii) Head → higher rise, then fall
(iii)Right Shoulder → lower rise, then fall again
EVENING STAR CANDLESTICK -
1 large green candlestick followed by 1 doji followed by 1 large red candlestick is called evening star which indicates downward pressure for the stock
TARGET -
120 level
Yes the chicken man - PPC Short?PPC is at the bottom of a monthly box and at VAL of the daily and weekly anchored volume profile. It could catch a bid here and retest $45.60s(VPOC).
If the retest ends in a rejection of that area, and a daily close below the previous low around $41.95 then I expect short continuation and validation of the H&S.
I would especially like this trade after a retest and rejection of box bottom around $43.41 - $43.30.
My targets would be 40.11, 38.98, 37.27,35.96 then 33.72.

Long Term Buy Position in GBPUSDICMARKETS:GBPUSD has completed Head & Shoulder on Daily Timeframe on 25th August 2025
In this trade, I will not follow any noise as it is a long term trade with high pips in Risk but even higher reward intact. I am waiting for this price action since one month but it is not triggering the cleaned Head and Shoulder's breakout at 1.3596.
I have placed a Buy Stop Order at 1.3596 with my SL at low of inversed right shoulder.
I will take two positions both at the breakout of right shoulder at 1.3596. Both position has 2% risk in total
Position 1 with 1 % Risk
Buy Stop: 1.3596
Stop Loss: 1.3388
TP: 1.3815
Position 1 with 1 % Risk
Buy Stop: 1.3596
Stop Loss: 1.3388
TP: 1.3815

Reverse Head & Shoulders Setup | Gold Spot | 15min | by Mohsen M
🔸 **Chart:** Gold Spot / USD (XAU/USD)
🔸 **Timeframe:** 15min
🔸 **Method:** Smart Money Concepts (SMC) + Pattern Recognition
🔸 **Focus:** Reverse H&S, Order Blocks, TLQ, BOS
---
## 🔍 Market Context:
- **Market Structure:** Bearish on higher TF
- **Short-Term Trend:** MSU (Market Structure Up)
- **Efficiency:** ✅ Confirmed — clean price delivery
- **Key Pattern:** Bullish **Inverse Head & Shoulders**
---
## 🧠 Technical Breakdown:
1. **Left Shoulder – Head – Right Shoulder** perfectly forming within a high-value demand zone
2. Price reacted strongly from **Order Block (OB)** + TLQ marked at the bottom wick (Head zone)
3. BOS confirms bullish attempt to shift structure
4. Anticipating neckline break at ~3345 level for further upside
5. Potential resistance and liquidity resting above 3400 (HH region)
---
## 📌 Trading Plan (Pre-London Open / Monday 1:30 AM UTC+3:30):
- **Entry Idea:**
Watch for bullish confirmation after price stabilizes above Right Shoulder zone (~3300–3320)
Or re-entry on a retest of neckline after breakout
- **Stop Loss:**
Below "Head" and OB zone (~3260)
- **Take Profits:**
- TP1: Neckline break zone (~3345)
- TP2: 3400 – Liquidity pool
- TP3: Final HH sweep (~3420+)
---
## ⚠️ Alternate Bearish Case:
> If price breaks below the "Head" zone and OB fails to hold,
> → Expect bearish continuation to the next liquidity zone near **VTA @ 3200**
---
## ✅ Summary:
This is a clean **bullish reversal setup** using SMC logic and a classic H&S pattern:
**OB + TLQ + BOS + Efficient Market + Clear Pattern ➝ High-Probability Setup**
Structure: 🟥 Bearish (macro)
Trend: 🔼 MSU (micro)
Efficiency: ✅ Efficient
Pattern: 🟩 Inverse Head & Shoulders
---
📊 Prepared by: **Mohsen Mozafari Nejad**

DOT Daily After a strong downtrend, the price has stabilized around the 3.23 – 3.27 support zone, showing several bullish reactions from this area.
Recently, the price action has formed a Symmetrical Triangle structure, meaning volatility is tightening and energy is building up for a breakout.
The key resistance lies in the 4.40 – 4.65 zone (pink box), which could be the first target if the triangle breaks to the upside.
A breakout above the descending trendline (upper side of the triangle) with rising volume may signal the start of a strong bullish move.
On the other hand, if the triangle support and the 3.23 level are lost, the price may continue lower toward 3.00 and possibly 2.75.
The current Symmetrical Triangle can act as either a continuation or a reversal pattern, depending on the breakout direction. Given the recent bullish reactions at support and the market’s defense of the 3.2 zone, the probability of an upward breakout seems slightly higher.
❓ Do you think this triangle pattern could be a signal for a new bullish rally in DOT?

4h BTC-USD shows Inverse H&S patternOn the 4h BTC-USD chart is an inverse head and shoulders pattern visible. This is generally a bullish pattern.

ATG forming a right shoulder?Is this a textbook H&S pattern being formed? 643 is break out/neck line and 912 is the target. Looks like it and reversal will be know by September to November 2025.
This is not a solicitation to trade in ATG shares.

XAU/USD Technical Outlook – Short-Term Dip, Bigger Upside AheadHello guys.
It is what I see:
We can see that Gold is currently trading around $3,404, consolidating after a strong bullish move inside a rising wedge formation. The wedge has now broken out to the upside, and price action is showing a potential head and shoulders pattern near the top.
Head and Shoulders:
The left shoulder, head, and right shoulder are clearly visible, and the neckline is sitting around the $3,399–$3,400 zone. If price dips and retests this neckline, we could see a short-term bearish move toward the target of the head and shoulders around $3,399. This is a healthy pullback after the recent rally.
Bigger Picture (Wedge):
Even though we might see a short-term correction, the larger wedge breakout suggests continuation to the upside. The measured target of the wedge points toward $3,430, which lines up as the next resistance level.

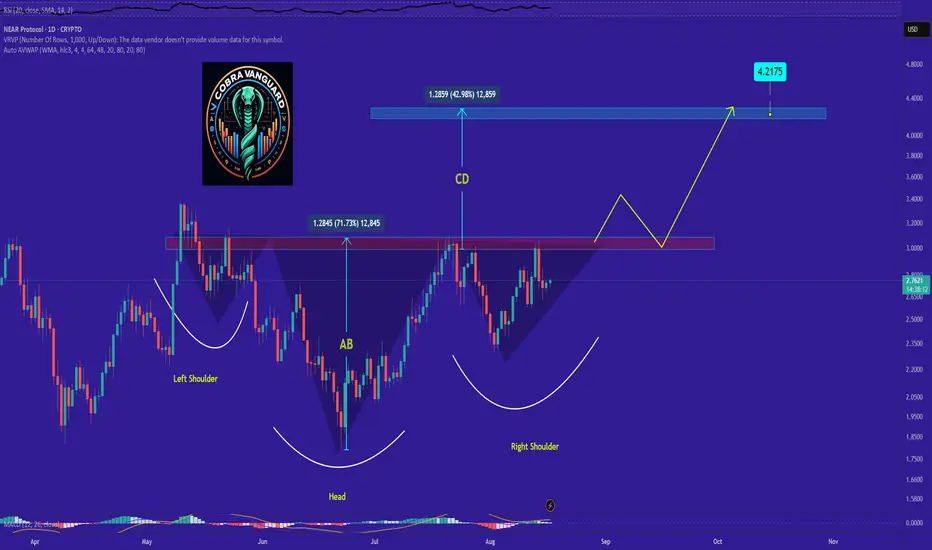
we shall see a good amount of increase in NEAR price !It seems the price is forming a head and shoulders pattern, which, if correct, suggests a good price increase in the coming days. However, we should wait for the pattern to fully complete.
Best regards CobraVanguard.💚
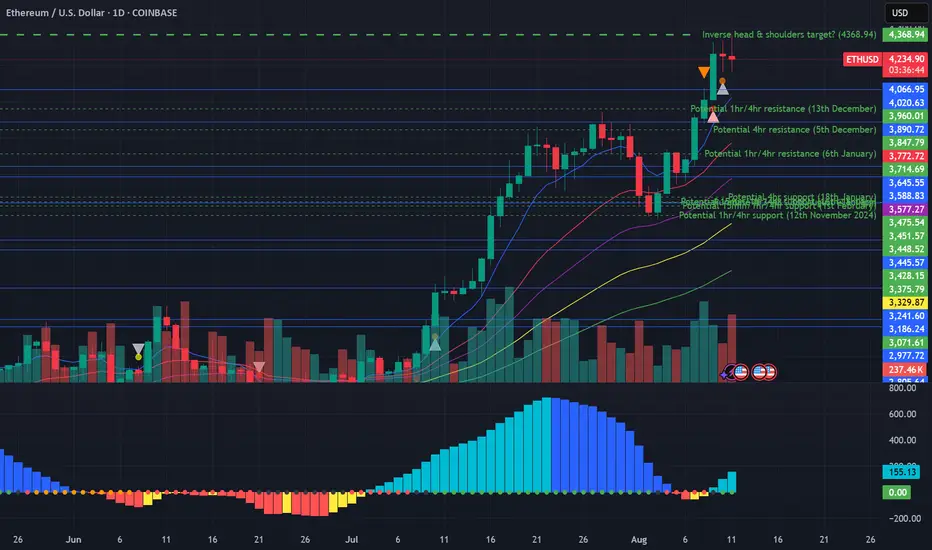
Potential inverse head and shoulders target reached on EthereumWell... nearly reached at this stage anyway. In a similar vein to Dow Theory (in which you would normally expect that the Dow Jones Industrial Average would rise alongside the Dow Jones Transportation Index, the Nasdaq Composite, the SP500 and the Russell 2000 indices), let's suppose you would expect that Ethereum would rise alongside Bitcoin and the other altcoins.
Let's face it, Ethereum has had a great run recently, but what has Bitcoin been doing over the past month in particular? Literally nothing. Zero, zilch, nada... But why am I bringing up caution at this stage whilst everyone is so bullish about Ethereum? Let's scale out. If you look very far out to earlier this year, there was spike down in February for Ethereum (which formed a 'left shoulder' downward), and further retracement in share price downward to the ultimate low in April two months later to form the 'inverted head', followed by upward movement to form the inverted 'right shoulder' in late June.
This allows us to draw a 'neckline' at around about the 2880 level. Extending calculations from this neckline to the inverted head provides a range of approximately 1400, but when utilising exact numbers utilising charting software, and extending this range upwards from the neckline northwards provides a potential target of 4,368.94, which is fairly close to where we've been recently (the high of 4,333.13 about 2 hours ago at the time of writing).
Unless Bitcoin can get itself moving, as well as Ethereum turn around with respect to the one hourly momentum, tread cautiously and consider the possibility that the target may be reached of this head and shoulders target for Ethereum (thus, neutral bias at this stage, with potential to turn bearish).
ethusdETHUSD HEAD AND SHOULDER
Sell Trade 30 minutes 15 minutes
After extreeme bullish momentume a retrace can seen in ETH chart
H&S can be seen trade it when price brakes the neck line retest and go down before a new upside run!

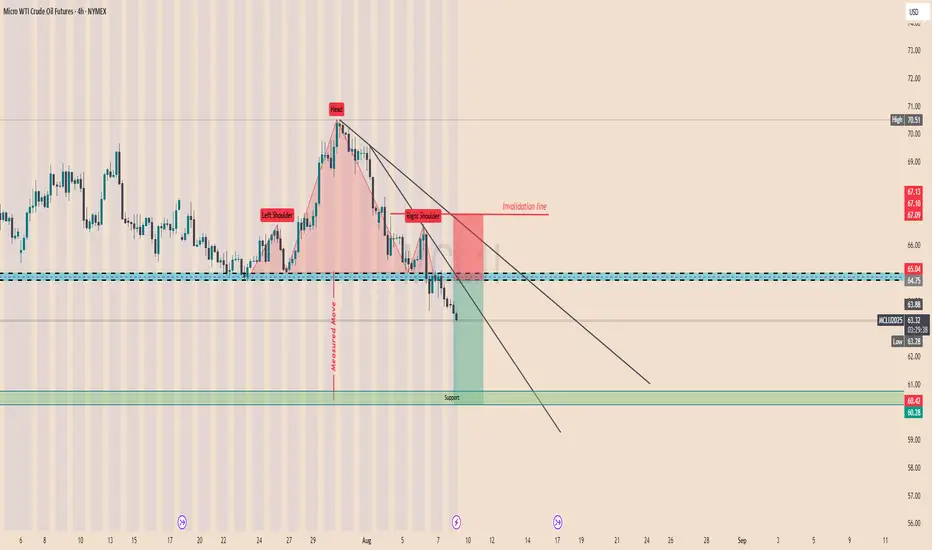
MCL1 Head and Shoulder Pattern! H&S price retested neckline a few times and no closed below it heading to first support at 63.6 then > 60.80 and possible extension to 57.8
Bitcoin inverted HEAD & SHOULDERSIf this is an inverted HEAD & shoulders pattern for bitcoin, then the neckline is already broken and bitcoin is Back testing that now, well the target is $160k as well

Next predictions for ZoraI see two scenarios for Zora on the chart, one scenario is a head and Shoulder pattern , which pushes Zora down .
and the next scenario is the possibility of another bullish wave.

GBPUSD is in Bearish Reversal Head & ShoulderGBPUSD is showing clear bearish head & shoulder pattern on daily chart it will retrace for some time to get close to the price 1.33788 at that point short sell will be good

Head & Shoulders on EUR/USD daily!We're currently observing a significant Head & Shoulders pattern forming on the EUR/USD daily chart, with the price just breaking below the neckline on the right shoulder.
Applying standard Head & Shoulders trading principles, we measure the distance from the head's peak to the neckline and project that same range downward from the breakdown point. Based on this, the estimated target price (TP) for the trade lands around $1.135. The stop-loss will be positioned just above the right shoulder to manage risk effectively.
We'll be watching closely to see how this setup unfolds. 🍻

Bull Trap Confirmed: GBPUSD's 8% Rally Faces ExhaustionLets Face it we had a great 6 months already clocking 60%+ Returns already.
And after sitting ducks for almost 2 months now we finally have a trade.
- Its a very self explanatory chart
- Trading at resistance
- Head & Shoulder pattern
And the best part the right shoulder is still yet to be formed! My favourite type of entry.
1.It gives a better risk reward ratio (1:7 expected)
2.Better Entry (No long red candles)
3. And even if the pattern fails it we may still reach the neck line which is target 1.
Entry Criteria
- A Red candle at the entry Line Marked
- Stoploss Above the Entry Candle
Target 1- 1.3361
Target 2- 1.3252
Target 3- 1.3169
Keep Your Risk Reward Intact! Not An investment Advice

GBPUSD BEARISH POTENTIAL The daily time frame for GBPUSD is showing me that price has formed a head & shoulders pattern, breaking through the former support now resistance level. Price is currently sinking to my 1.31000 mid level, once the level is reached it will either breakthrough or bounce off of it to retrace and continue to build bearish structure.
