AMD - Inverted Head and Shoulder in makingDisclaimer : Do your own research before investing. This is just a chart analysis. No recommendation to buy and sell.
Advanced Micro Devices (AMD) enters the second week of October with a moderately bullish tone.
while analyzing AMD chart found there is Inverted Head and Shoulder pattern in making.
I have highlighted level on the chart.
Please share your thouhts.
Head and Shoulders

long TNSR/USDT.ptensor about to go higher, it made a H&S pattern, the recent rise it left a small consolidation. currently its trading back to that. the point of controll of that small range is imo good for a long entry to around 0.1114 or even higher. trade safe, cheers

Double or nothing The price is moving with its third upward wave toward the $16 mark.
It’s possible that this move will represent a solid +100% gain from the lows near the lower blue support at $7.77.
Head and shoulders completed on 4H
Be cautious: these small-cap companies often swing 10% in a single day due to high volatility.
The space sector is shaping up to be one of the next speculative bubbles in the coming years — better to start positioning early.
In my recent picks, I’ve included several other space-related stocks

MARA | My Life Long Girlfriend Stock | LONGMARA Holdings, Inc. is a digital asset technology company, which engages in mining cryptocurrencies with a focus on the Bitcoin ecosystem. It also deals with owning and operating bitcoin mining facilities or data centers, selling proprietary software or technology to third parties operating in the Bitcoin ecosystem, offering advisory and consulting services to support Bitcoin mining ventures in domestic and international jurisdictions, and generating electricity from renewable energy resources or methane gas capture to power Bitcoin mining projects. The company was founded on February 23, 2010 and is headquartered in Hallandale Beach, FL.

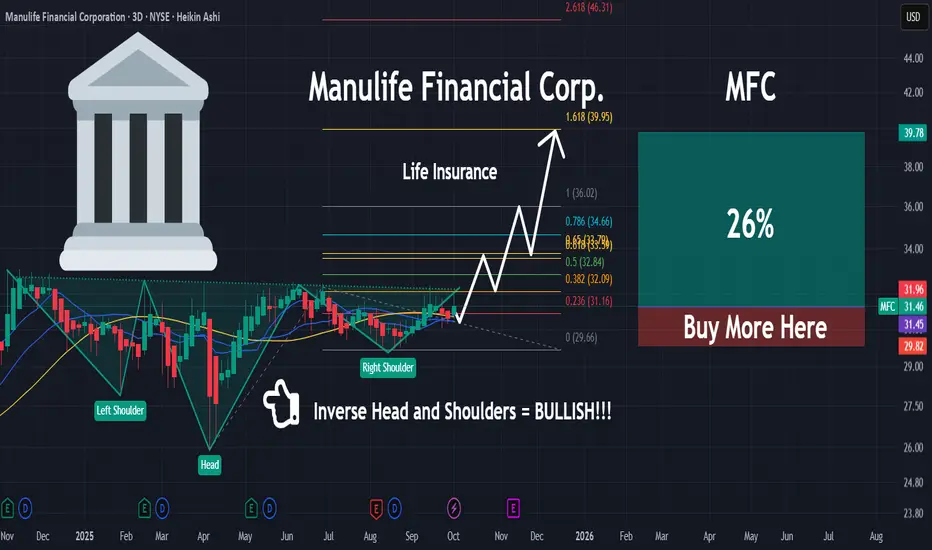
MFC | Something is Brewing | LONGManulife Financial Corp. engages in the provision of financial services and insurance for individuals, groups, and businesses. It operates through the following segments: Asia, Canada, U.S., Global Wealth and Asset Management (WAM), and Corporate and Other. The Asia segment offers insurance products and insurance-based wealth accumulation products. The Canada segment includes insurance products, insurance-based wealth accumulation products, and banking services. The U.S. segment consists of life insurance products and insurance-based wealth accumulation products and has an in-force long-term care insurance business and an in-force annuity business. The Global WAM segment delivers investment solutions to retail, retirement, and institutional clients. The Corporate and Other segment refers to investment performance on assets backing capital, costs incurred by the corporate office related to shareholder activities, property and casualty reinsurance business, and run-off reinsurance operation including variable annuities and accident and health. The company was founded in 1887 and is headquartered in Toronto, Canada.
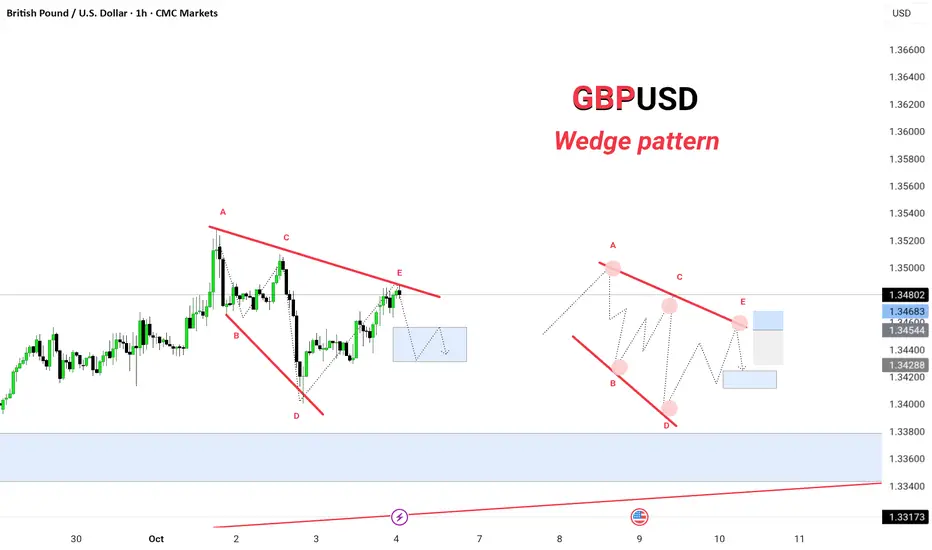
GBPUSD | 4HGBP/USD – Wedge Pattern Analysis | GreenfireForex
The GBP/USD (1H timeframe) is currently forming a contracting wedge pattern (A–B–C–D–E), indicating potential price compression before a decisive breakout.
🔹 Key Observations:
The pair is completing wave E, touching the upper wedge resistance.
Price is expected to face selling pressure near the resistance line, forming a short-term corrective move.
A breakout below the wedge could open a move toward the 1.34200–1.33500 demand zone.
However, if buyers defend support, we may see another push back toward 1.35000 before reversal.
📊 Structure Breakdown:
A–C–E → Lower highs (trendline resistance)
B–D → Higher lows (trendline support)
Possible continuation: ABCDE → Breakout
Blue zones mark potential liquidity areas and entry/exit zones.
⚡ Trading Outlook:
Watch for confirmation candles near the E point before positioning. A clean breakout with volume will confirm the next major move.
🧠 Pattern type: Falling wedge (potential bullish reversal)
🕓 Timeframe: 1H
💰 Instrument: GBP/USD

AUDUSDBroke weekly resistance zone around 0.65700. Made a retest and looks to be forming an inverse head and shoulder visible on the H4 with 3rd touch on daily TF support trendline. Need to have a clean breakout above 0.66200 with a possible retest to push higher. Looking to swing to next daily resistance around 0.69000.

GBP/USD – Wedge Pattern Analysis | GreenfireForex
📊 Structure Breakdown:
A–C–E → Lower highs (trendline resistance)
B–D → Higher lows (trendline support)
Possible continuation: ABCDE → Breakout
Blue zones mark potential liquidity areas and entry/exit zones.
⚡ Trading Outlook:
Watch for confirmation candles near the E point before positioning. A clean breakout with volume will confirm the next major move.
🧠 Pattern type: Falling wedge (potential bullish reversal)
🕓 Timeframe: 1H
💰 Instrument: GBP/USD
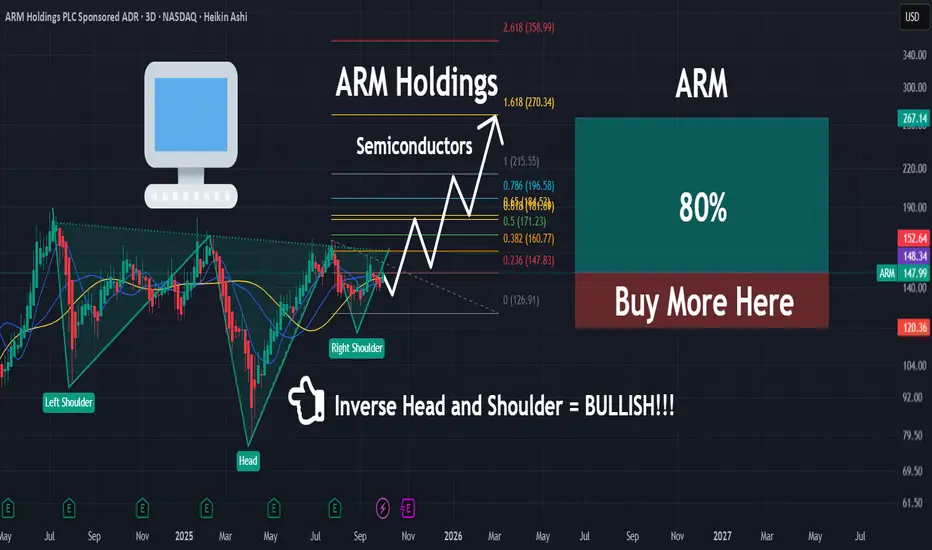
ARM | The Next Semi to Move Higher | LONGArm Holdings Plc engages in the licensing, marketing, research, and development of microprocessors, systems IP, graphics processing units, physical IP and associated systems IP, software, and tools. It operates through the following geographical segments: United Kingdom, United States, and Other Countries. The company was founded on November 12, 1990 and is headquartered in Cambridge, the United Kingdom.
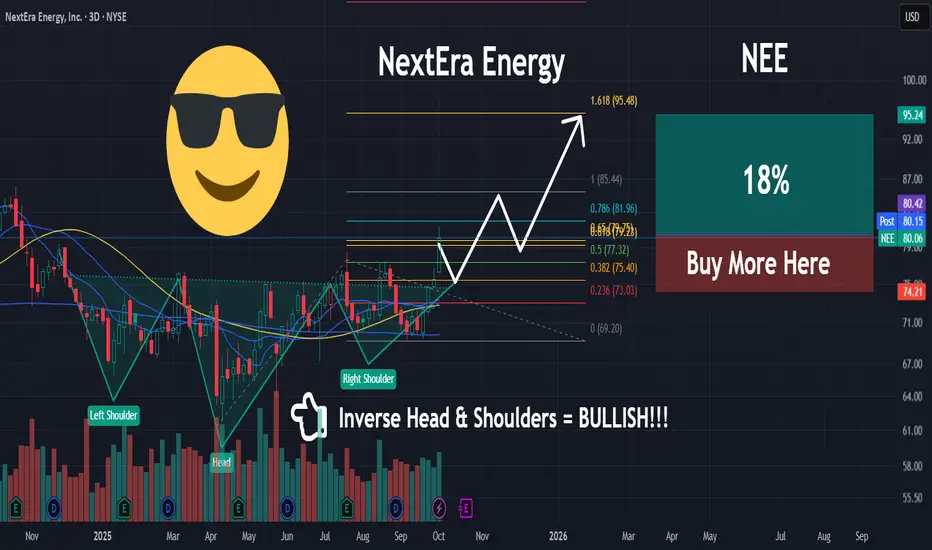
NEE | Utilities STRONG | LONGNextEra Energy, Inc. engages in the provision of renewable energy. It operates through the following segments: FPL and NEER. The FPL segment involves the generation, transmission, distribution, and sale of electric energy in Florida. The NEER segment produces electricity from clean and renewable sources, including wind and solar. The company was founded on December 28, 1925 and is headquartered in Juno Beach, FL.
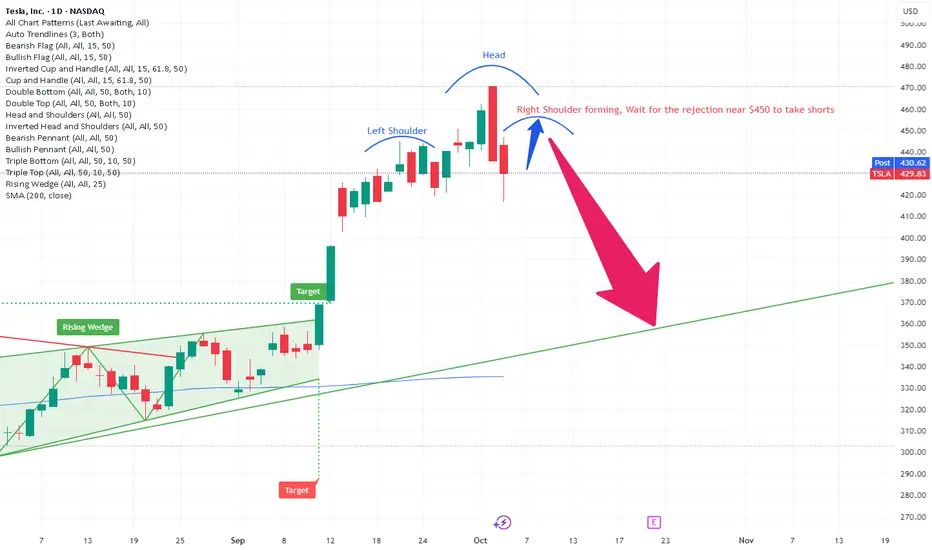
$TSLA H&S FORMING on DAILYHas NASDAQ:TSLA topped ? Maybe it has.
Looking for pullback to 380-376 area if 440 or 450 is rejected.
H&S pattern forming on daily.
AUDUSD LongAUDUSD H&S formation on the H4/Daily timeframe.
W bottom formation on the H1 timeframe.
D1 Trendline break and retest near the 61.8 fib level.
Target at 1.27 fib extension level. Which is near the Daily supply zone.
RR 1:8.
Be careful as there is NFP news this NY session.

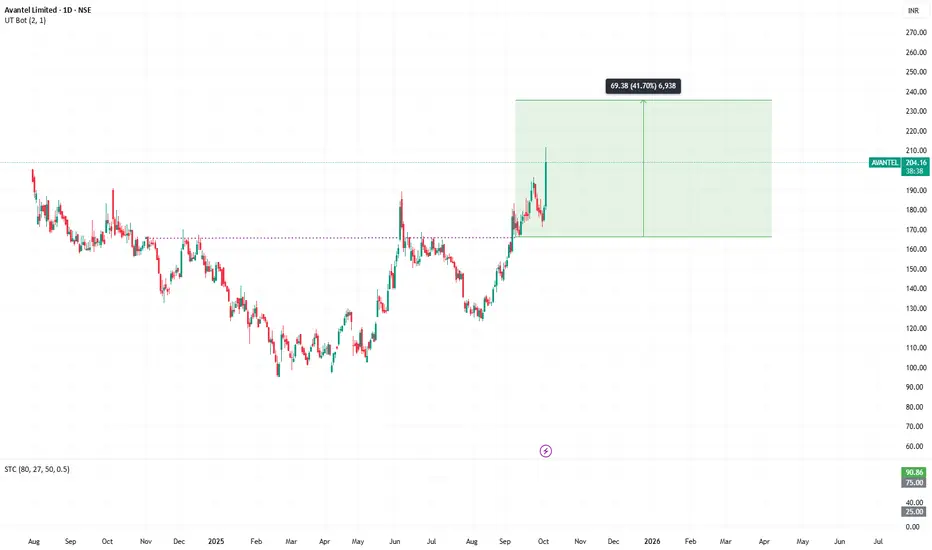
AVANTEL - RHS chart pattern. Target 236 in time period 6 monthsNSE:AVANTEL has given a breakout from a RHS chart pattern . Positive outlook with good financials.
Target 236 in time period 6 months.
Inverse Heads and Shoulders in Bank NiftyI am marking an inverse heads and shoulders pattern in Bank Nifty.
Now, it does not mean Bank Nifty will 100% rally or show a strong breakout.
This is only to show, how patterns form, just for education.

Zcash working on filling out right shoulder for next breakout Zcash appears to be forming a special inverse head and shoulders pattern I like to refer to as the sweet dreams or sleepy head inverse head and shoulders as the trendline you draw to highlight the head and shoulders take on a smile face with its eyelids closed. I anticipate even though I already drew the hypothetical length of the right shoulder fairly s that there’s a chance it could break above the neckline after forming an even shorter right shoulder based on some of the recent tiny right shoulders we’ve seen fro the likes of digibyte, atom, cardano and others. Always a chance since it’s left shoulder was tiny that the right one could buck the trend and form a regular sized right shoulder too, either way I’m confident with market conditions how they currently are theat probability favors this pattern breaking out and up eventually. *not financial advce*

Trade idea on Xauusd Trade idea on Xauusd
Sell @ 3848.03
SL: 3864.86
Tp:3825.97
Tp2:3802.31
Apply proper risk management

EURGBP SELL RETEST OF HEAD & SHOULDERS NECKLINE.- Price was rejected from major Resistance level at (0.87540 - 0.87379) forming head & shoulders at the level, price broke H&S Neckline at (0.87218 - 0.87147) and retesting the level.

NDSN - 9 months HEADS & SHOULDERS══════════════════════════════
Since 2014, my markets approach is to spot
trading opportunities based solely on the
development of
CLASSICAL CHART PATTERNS
🤝Let’s learn and grow together 🤝
══════════════════════════════
Hello Traders ✌
After a careful consideration I came to the conclusion that:
- it is crucial to be quick in alerting you with all the opportunities I spot and often I don't post a good pattern because I don't have the opportunity to write down a proper didactical comment;
- since my parameters to identify a Classical Pattern and its scenario are very well defined, many of my comments were and would be redundant;
- the information that I think is important is very simple and can easily be understood just by looking at charts;
For these reasons and hoping to give you a better help, I decided to write comments only when something very specific or interesting shows up, otherwise all the information is shown on the chart.
Thank you all for your support
🔎🔎🔎 ALWAYS REMEMBER
"A pattern IS NOT a Pattern until the breakout is completed. Before that moment it is just a bunch of colorful candlesticks on a chart of your watchlist"
═════════════════════════════
⚠ DISCLAIMER ⚠
The content is The Art Of Charting's personal opinion and it is posted purely for educational purpose and therefore it must not be taken as a direct or indirect investing recommendations or advices. Any action taken upon these information is at your own risk.

NZDCHF Short Trade IdeaTrend: Bullish
Divergence: Bearish
Reversal Pattern: Head N Shoulder
Bias: Bearish
Scenario:Sell Stop at Neckline Breakout
Trade Plan
Stop Loss : 0.4649
Entry Leve: 0.4631
TP1: 0.4613


trade idea on xausdprice has finally completed the head and shoulder pattern and a break of the neck line support, i will be waiting for a retest of that broken support around 3854.531 for a short, else gold would continue melting from here on to the down side
Let's see how things play out

Head and Shoulders Pattern in the EUR/USD As it seems, the head and shoulders pattern has formed in the EUR/USD currency pair on the H1 timeframe.
The price has also moved down with a strong candlestick by hitting the ceiling of the H4 descending channel in this range.
The price is expected to continue moving towards the bottom of the channel.
Stop Loss on the Range 1.17500
Take Profit on the Range 1.16700

EURUSD Bullish Correction Not DoneIndeed the overall bias is bearish for this market.
But if there is one thing I know about retests of these head and shoulder patterns is that sometimes price will insist on retesting either the right shoulder region or even the head.
Personally I am not looking to long the dollar just yet until one of those two highs I have drawn up have been taken.
Good luck for NFP everyone.
