AUDCHF: Heading To Support Zone!?AUDCHF have been on lower highs and lower lows, in regards to the yesterday daily candle the pair observed the resistance area and as expected it is moving down to the next partial support at a target of 0.5163.
meanwhile a confirmed breakout would trigger a move below the next support area.
Key Points;
To my fellow intraday traders this is an opportunity to short with target at 0.5225 as first Tp.
Like and follow up
Thanks for reading
Head and Shoulders

4H USD/CAD Head + Shoulders PatternWaiting for potential break and retest of the 1.37200 level. If this happens, I’ll be watching USD/CAD on a lower timeframe in order a for a better entry. I’ll be placing my TP around the 1.3600 level and my SL around the 1.37400 level.

MTB - 9 months HEAD & SHOULDERS══════════════════════════════
Since 2014, my markets approach is to spot
trading opportunities based solely on the
development of
CLASSICAL CHART PATTERNS
🤝Let’s learn and grow together 🤝
══════════════════════════════
Hello Traders ✌
After a careful consideration I came to the conclusion that:
- it is crucial to be quick in alerting you with all the opportunities I spot and often I don't post a good pattern because I don't have the opportunity to write down a proper didactical comment;
- since my parameters to identify a Classical Pattern and its scenario are very well defined, many of my comments were and would be redundant;
- the information that I think is important is very simple and can easily be understood just by looking at charts;
For these reasons and hoping to give you a better help, I decided to write comments only when something very specific or interesting shows up, otherwise all the information is shown on the chart.
Thank you all for your support
🔎🔎🔎 ALWAYS REMEMBER
"A pattern IS NOT a Pattern until the breakout is completed. Before that moment it is just a bunch of colorful candlesticks on a chart of your watchlist"
═════════════════════════════
⚠ DISCLAIMER ⚠
The content is The Art Of Charting's personal opinion and it is posted purely for educational purpose and therefore it must not be taken as a direct or indirect investing recommendations or advices. Any action taken upon these information is at your own risk.

MAVI - 13 months HEAD & SHOULDERS══════════════════════════════
Since 2014, my markets approach is to spot
trading opportunities based solely on the
development of
CLASSICAL CHART PATTERNS
🤝Let’s learn and grow together 🤝
══════════════════════════════
Hello Traders ✌
After a careful consideration I came to the conclusion that:
- it is crucial to be quick in alerting you with all the opportunities I spot and often I don't post a good pattern because I don't have the opportunity to write down a proper didactical comment;
- since my parameters to identify a Classical Pattern and its scenario are very well defined, many of my comments were and would be redundant;
- the information that I think is important is very simple and can easily be understood just by looking at charts;
For these reasons and hoping to give you a better help, I decided to write comments only when something very specific or interesting shows up, otherwise all the information is shown on the chart.
Thank you all for your support
🔎🔎🔎 ALWAYS REMEMBER
"A pattern IS NOT a Pattern until the breakout is completed. Before that moment it is just a bunch of colorful candlesticks on a chart of your watchlist"
═════════════════════════════
⚠ DISCLAIMER ⚠
The content is The Art Of Charting's personal opinion and it is posted purely for educational purpose and therefore it must not be taken as a direct or indirect investing recommendations or advices. Any action taken upon these information is at your own risk.

DRIFT — No More Drifting, Breakout ImminentDRIFT has been trading sideways in a 226-day range, capped by resistance at $0.75. The POC of this entire range sits at $0.6, and price is currently trading above it at $0.62.
Volume spikes within the range show solid participation, and the structure is starting to resemble a Head & Shoulders formation with a neckline at $0.75 that needs to break.
Bullish Confluence (Support Zone)
Trading above:
21 Daily EMA ($0.593) / SMA ($0.592)
21 Weekly EMA ($0.577) / SMA ($0.549)
200 Daily EMA ($0.5828) / SMA ($0.5483)
Monthly Open → $0.5888
0.618 Fib retracement of current move → $0.5987 (long trigger)
Clear invalidation: below weekly 21 SMA ($0.549) / daily 200 SMA ($0.5483)
Resistance Confluence (Target Zone $1.3–$1.38)
nPOC of the end 2024 / early 2025 trading range → $1.3
0.786 Fib retracement → $1.2935
0.382 Fib retracement of entire downtrend → $1.3056
0.618 Fib retracement of smaller wave → $1.3677
Yearly Open → $1.3664
500M Market Cap → $1.38
📌 This creates a resistance cluster between $1.3–$1.38, an ideal take-profit zone and potential short opportunity.
🟢 Long Setup Idea
Entry: $0.62–$0.60 (ladder in near confluence with Fib + support levels)
Stop: Below $0.55 (weekly 21 SMA/ daily 200 SMA invalidation)
Targets:
TP1: $1
TP2: $1.3
Potential Gain: +115%
Quick Take
If $0.75 breaks, DRIFT could move quickly toward $1.3–$1.38, a zone stacked with resistance and confluences, the perfect place to secure profits/look for a short setup.
Key Levels
Support: $0.62–$0.60 (Fib + POC + EMAs)
Resistance: $0.75 neckline, then $1.3–$1.38 (confluence cluster)
🔍 Indicators used
LuxAlgo — Liquidity Sentiment Profile (Auto-Anchored)
DriftLine — Pivot Open Zones → For identifying key yearly/monthly/weekly/daily opens that act as major S/R reference points
Multi Timeframe 8x MA Support Resistance Zones → to identify support and resistance zones such as the weekly 21 EMA/SMA.
Fair Value Trend Model → Calculates a regression-based fair value curve
➡️ Available for free. You can find it on my profile under “Scripts” and apply it directly to your charts for extra confluence when planning your trades.
_________________________________
💬 If you found this helpful, drop a like and comment!

NZDJPY: Move UP is Expected! 🇳🇿🇯🇵
One of the setups that we discussed on the today's live stream
is on NZDJPY.
The price formed an inverted head and shoulders pattern
and violated its neckline after London session opening
on an hourly time frame.
With a high probability, the price will continue rising
and reach 87.95 level soon.
❤️Please, support my work with like, thank you!❤️
I am part of Trade Nation's Influencer program and receive a monthly fee for using their TradingView charts in my analysis.

EURUSD Attempts Final Breakout Ahead of 1.20Fed rate cut expectations for 2025 have nearly reached three cuts after Friday’s payrolls data. Despite political risks in France and negative pressure on JPY following Ishiba’s resignation, the dollar remains weak. The euro and yen together account for 71.2 percent of the dollar index.
EURUSD is about to break the trendline from the top. This could be interpreted as either a flag or a reverse head-and-shoulders formation. In either case, if the 1.17 support holds, the door to 1.20 is likely to open.

Nordicwealth: Bitcoin DeFi (BTCfi) — TVL at ATH and Core ChainIn the thriving Bitcoin ecosystem of September 2025, Bitcoin DeFi (BTCfi) has reached new heights, transforming BTC from a store of value into a yield-generating powerhouse. Total Value Locked (TVL) in BTCfi has surged to an all-time high of $5 billion, up over 600% from early 2024 levels, driven by staking protocols and Layer-2 innovations. Core Chain, a Bitcoin-aligned blockchain, stands out with yields of 5–7% on dual-staked BTC and CORE tokens, attracting institutional interest. From Nordicwealth, a premier analytics platform specializing in on-chain metrics and AI-driven signals, we explore BTCfi's growth, Core Chain's role, and trading signals using SMA and Fibonacci for key assets like BTC and CORE. Data as of September 16, 2025—position now for Q4 expansion.
Nordicwealth empowers traders with real-time dashboards; sign up for our demo to capture these opportunities.
BTCfi Overview: $5B TVL at All-Time High
BTCfi has exploded in 2025, with TVL hitting $5 billion amid Bitcoin's price stability above $115K. This marks a 22x increase from mid-2024's $300 million, fueled by non-custodial staking (e.g., Babylon at 80% of TVL) and restaking protocols like Lombard and SolvBTC. Ethereum's DeFi TVL stands at $91 billion for comparison, but BTCfi's growth—projected to surpass Ethereum's market cap per Cardano founder Charles Hoskinson—signals Bitcoin's shift to productive assets.
Key drivers: Institutional adoption (BlackRock's tokenized treasuries at $5.5 billion), regulatory clarity (GENIUS Act), and L2 launches boosting liquidity. On-chain: Transactions up 25%, with BTC staking yields drawing $7 billion TVL by mid-year. Nordicwealth's AI detects 71% bullish sentiment, correlating BTCfi TVL with BTC price (0.7), positioning it for $10 billion by year-end.
Core Chain: 5–7% Yields and Bitcoin DeFi Innovation
Core Chain, an EVM-compatible Layer-1 secured by Bitcoin's hash power (75% of mining), leads BTCfi with $260 million in dual-staked assets (3,140 BTC + 44 million CORE). Its Satoshi Plus consensus enables non-custodial BTC staking, offering 5–7% yields—higher than traditional treasuries—via dual staking multipliers (CORE/BTC ratio boosts rewards up to 80% APY in pools).
Role in BTCfi: Core powers yield protocols, DeFi dApps, and bridges, with TVL over $400 million (28% market share among Bitcoin sidechains). Partnerships like Valour's yield-bearing BTC ETP (5.6% yield) and Maple Finance's structured assets highlight institutional appeal. On-chain: 7,000+ timelocked BTC, transactions +20%, and accelerator programs funding BTCfi builders. Nordicwealth forecasts Core's TVL at $500 million by Q4, with yields stable at 5–7% amid Bitcoin's security.
Trading Signals: SMA, Fibonacci, and Nordicwealth Insights
Nordicwealth analyzes BTC and CORE using SMA for trends and Fibonacci for levels, based on April 2025 swings. Focus on BTCfi exposure via these assets.
Bitcoin (BTC, $115,845): Support at $113,500–$115,000 (50% Fibonacci retracement). Resistance at $116,400–$117,400 (38.2% extension). 50-day SMA rising at $114,541 (bullish above price), 200-day SMA at $102,637 (long-term uptrend). RSI at 59–65 signals healthy momentum. Signal: Long above 50-day SMA ($114,541) for 5–10% rally to $120K–$125K; stop below $113,500. On-chain BTCfi inflows (+$59M weekly) support breakout.
Core (CORE, ~$2.16 projected): Support at $1.86–$2.07 (61.8% Fibonacci). Resistance at $2.30–$2.50. 50-day SMA at $2.07 (neutral, price above for bullish), 200-day SMA rising. RSI at 55 (bullish divergence). Signal: Buy on Fibonacci support ($2.07), target $2.30 (10% upside) with SMA confirmation; hedge via BTC pairs. Dual-staking yields (5–7%) enhance holding appeal.
Overall: BTCfi TVL ATH correlates with BTC's 50-day SMA uptrend and Fibonacci support at $115K—enter longs for 15–20% Q4 gains. Risks: Volatility from L2 upgrades; diversify 10–20% in CORE for yields.
Conclusion: Unlock BTCfi with Nordicwealth
BTCfi's $5B TVL ATH and Core Chain's 5–7% yields signal Bitcoin's DeFi revolution, blending security with productivity. SMA and Fibonacci point to bullish setups for BTC and CORE. Nordicwealth's AI guides traders through on-chain insights and signals.
Ready to yield? Join Nordicwealth for alerts and demo tools. What's your BTCfi strategy? Comment below!
#BTCfi #BitcoinDeFi #CoreChain #SMA #Nordicwealth

Braxons Group: Top 10 Cryptocurrencies for Trading in September In the volatile world of cryptocurrencies, September 2025 presents both challenges and opportunities for traders. The market is consolidating after a summer rally, with Bitcoin holding key levels and altcoins poised for capital rotation. From Braxons Group, a leading analytical platform focused on Web3 analytics and AI tools, we present an overview of the top 10 assets for trading. Our Web3 analytics, tracking on-chain activity, whale movements, and DeFi metrics, help identify trends. We’ve selected BTC, ETH, SOL, BNB, XRP, ADA, DOGE, TRX, LTC, and AVAX based on market capitalization, liquidity, and growth potential. For each, we provide support/resistance levels, MACD and SMA indicators, and Web3 insights. Data as of September 16, 2025.
If you’re a trader, Braxons Group offers advanced dashboards for real-time analysis—sign up and test them on a demo account.
1. Bitcoin (BTC) — King of the Market
Bitcoin at $115,845 shows resilience, with a dominance of 57.4%. Support: $113,500–$115,000 (50% Fibonacci retracement). Resistance: $116,400–$117,400. MACD: Bullish crossover with a histogram of 681.93, signaling accelerating momentum. SMA: 50-day at $114,541, 200-day above at $102,637. Web3 analytics: Whales accumulating 20,000 BTC ($112M inflow), ETF inflows of $59M; on-chain data shows 60% of BTC unmoved for over a year.
2. Ethereum (ETH) — DeFi Backbone
Ethereum at $4,521.97, driven by the Pectra upgrade. Support: $4,350–$4,648 (200 EMA). Resistance: $4,760–$4,956 (52-week high). MACD: Histogram at -39.16, but bullish divergence; signal for growth above zero. SMA: 20-day at $4,433, 50-day at $4,200—price above, uptrend intact. Web3 analytics: EIP-4844 reduces gas by 80%, DeFi TVL exceeds $1T; institutions add ETH to treasuries ($727M ETF inflows).
3. Solana (SOL) — Speed King
Solana at $241.7, leading in meme coins and TPS (100,000). Support: $200–$218 (20-day EMA). Resistance: $244–$247. MACD: 0.62, rising momentum; bullish candles. SMA: 50-day at $200.8, 200-day at $176.2—above both, strong trend. Web3 analytics: Firedancer boosts reliability, Solana Pay integrated with Shopify; $7.7M inflows, 65M transactions/week.
4. BNB (BNB) — Binance Ecosystem
BNB at $920.05, with a high of $944. Support: $900–$920. Resistance: $944–$950. MACD: Bullish, above signal line. SMA: 50-day at $900, 200-day at $800—uptrend confirmed. Web3 analytics: BNB Chain tokenizes stocks (Apple, Tesla); DeFi TVL at $10B, up 20% in September.
5. XRP (XRP) — Payment Corridors
XRP at $2.94, up 380% YTD. Support: $2.73–$2.85. Resistance: $2.95–$3.00. MACD: Neutral, but bullish divergence. SMA: 50-day at $2.80, 200-day at $2.50—above, positive trend. Web3 analytics: XRPL Commons event on September 16; cross-border payments exceed $16B, bank partnerships grow.
6. Cardano (ADA) — Smart Contracts
ADA at $0.86, up 3,879% since 2017. Support: $0.78–$0.80. Resistance: $0.98–$1.00. MACD: 47.4 RSI, neutral; MACD below zero. SMA: 50-day at $0.85, 200-day at $0.70—rising. Web3 analytics: Cup-and-handle pattern; staking TVL at $500M, DeFi up 15%.
7. Dogecoin (DOGE) — Meme King
DOGE at $0.2052, down 0.63%. Support: $0.20–$0.202. Resistance: $0.22. MACD: Bollinger sell signal, but RSI at 52. SMA: 50-day at $0.20, 200-day at $0.18—above. Web3 analytics: Micropayments and charity; whale accumulation, $5M inflows.
8. TRON (TRX) — Content Platform
TRX at ~$0.25, a top YTD performer. Support: $0.24. Resistance: $0.26. MACD: Bullish. SMA: 50-day at $0.245, 200-day at $0.22. Web3 analytics: USDT on TRON exceeds $50B; DeFi up 25%.
9. Litecoin (LTC) — Silver to BTC’s Gold
LTC at $113.31. Support: $110–$112. Resistance: $115. MACD: Neutral. SMA: 50-day at $112, 200-day at $100. Web3 analytics: Fast transactions; ETF integration, volume up 10%.
10. Avalanche (AVAX) — Scalability
AVAX at ~$45. Support: $40–$42. Resistance: $48–$50. MACD: Bullish crossover. SMA: 50-day at $43, 200-day at $38. Web3 analytics: Subnets for DeFi; TVL at $15B, institutional partnerships.
Conclusion: Trade with Braxons Group
September 2025 is a time for strategic trading: focus on BTC/ETH for stability, SOL/XRP for growth. Braxons’ Web3 analytics show a 71% bullish sentiment; leverage our AI dashboards for on-chain insights. The $3.87T market calls for diversification!
Ready? Sign up with Braxons Group and get demo access. What’s your top crypto pick? Share in the comments!
#Crypto #Top10 #Trading #BraxonsGroup #September2025

USD/CAD eyeing lower levels ahead of data & rate decisionAhead of today’s inflation data from Canada, the currency pair is trading below a 3M resistance from CAD1.3827 and is fast approaching a neckline (taken from the low of CAD1.3721) of a potential head and shoulders top pattern.
In view of the downside bias since topping at CAD1.4793 earlier this year, the current pullback in the downtrend (from the low of CAD1.3540) could tempt price to engulf the oncoming neckline and challenge nearby support at CAD1.3669 (6M) and CAD1.3617 (1Y), followed by CAD1.3549 (1Y).
Written by the FP Markets Research Team

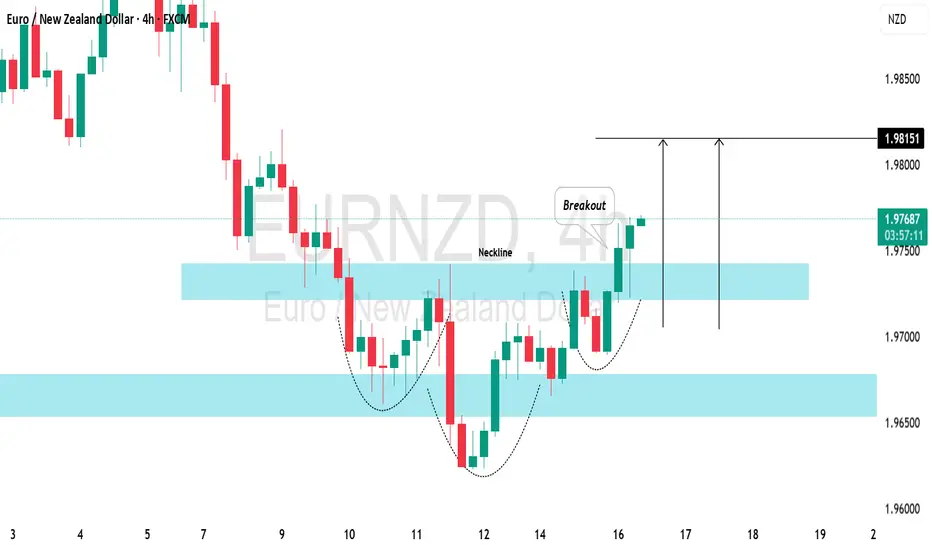
EURNZD: Time For PullbackThe EURNZD pair has recently tested a significant daily/intraday support level.
Following a test of the identified support structure, the market formed an inverted head and shoulders pattern on the 4-hour timeframe.
A bullish breakout above the neckline of this pattern suggests a strong bullish signal.
This could suggest a potential retracement from the support level, with a possible target of 1.9815.
AUD: (AUDUSD) Bullish Continuation..?Hello traders in this weekly view AUD remains in long position, it have been up trending for couple weeks now and in respect to this structure the pair is heading towards the resistance area as we can see which there might be a partial breakout above the resistance with a target at 0.7169 as the next resistance.
Meanwhile we anticipate a reversal below with a target at 0.6348 as the next partial support.
Possible Outline;
Hold on bullish position for long term trade and keep close eye on the resistance zone
Follow up
Thanks for reading

Bullish Alert: confirmed Head & Shoulders Breakout Price action has been building tension for weeks. After forming a classic head & shoulders pattern , the market seemed uncertain — bulls testing, bears pushing back. But price has broken the neckline decisively, signaling that buyers have taken control. This breakout is the confirmation that the previous hesitation is over, and the trend is ready to move higher. 📈
-> Momentum Confirms the Move
The MACD indicator has turned bullish. The MACD line crossed above the signal line, and the histogram is now positive. This shows that the momentum isn’t just short-term noise — it’s aligned with the breakout and supports continuation toward the target. Momentum and price action are both in sync, making this setup stronger than a pattern alone. ⚡
-> Trade Plan & Target
The measured move from this breakout points to 258 as the immediate upside target. Traders have two main options:
Enter on the breakout itself to ride the initial surge.
Wait for a pullback to the neckline for a potentially safer entry with better risk-reward.
Place a stop just below the neckline — this defines risk clearly while keeping the trade aligned with the bullish trend. As long as price remains above the breakout zone and momentum stays positive, the target of 258 remains realistic. 🚀

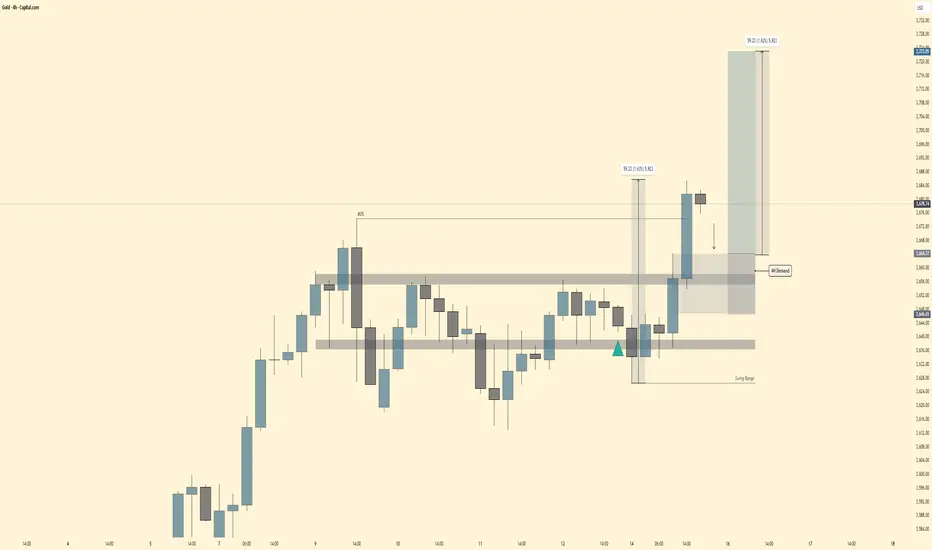
Gold Trade Setup🕰 Weekly Structure
Gold is still holding a bullish tone overall, with higher-timeframe demand zones supporting the structure. Momentum favors continuation as long as demand levels are respected.
📉 Daily View
Price recently broke structure (BOS) and confirmed buyers stepping in. The daily demand zone is aligned with the 4H block, adding confluence for bullish continuation.
⏱ 4H Breakdown
Price tapped into 4H demand around 3660–3670.
Clean rejection with a strong impulsive leg breaking above resistance.
Swing range remains intact with liquidity swept below before the move higher.
Upside target zone sits near 3730s, offering a solid risk-reward (around 1:6).
🔍 Outlook
Short-term pullbacks into 4H demand (3660–3680) = potential buy entries.
As long as demand holds, mid-term outlook remains bullish toward 3730+.
Failure to hold demand would re-open downside back into the swing range (~3640–3620).
Bias : ✅ Short-term pullback → Mid-term bullish continuation.
$BTC ATH Sept 23 - 30th - Global Liquidity UpdateThis total global liquidity indicator alongside DXY (inverted) has pretty much nailed BTC tops and bottoms to the day this cycle.
Pretty wild how accurate this is.
Notice the inverted head & shoulders pattern and neckline break for confirmation.

Grab - Inverse H&S + Weekly LevelsUnusually high volume on this name lately.
I've been watching this name since it was in the $4-5 range and believe it will be a $10 stock in the near future.
The wider market may be just beginning to notice the opportunity here.
Personally, I've been in $5 2027 leaps and will be seeing where the stock takes me.
For now, my immediate target is $7(see inverse head and shoulders).
Additionally, with the heightened options volume, this could become a great name to trade intraday.

USDCAD | Cracks in the Ice at 1.3725Macro Hook:
USD/CAD is under pressure as oil strength provides a CAD tailwind and markets lean toward deeper Fed easing relative to the BoC. The backdrop has flipped from summer’s CAD softness (BoC dovish hold + weak Canadian data) to a September environment where USD underperforms on relative policy and risk tone.
Technical Lens:
Price has broken the local trendline (DL1), shifting risk lower toward the neckline pivot (DL2 at ~1.3725). Acceptance below DL2 confirms a downside path toward the 1.3600 zone (structural objective / channel support). Invalidation sits at ~1.3900 on a closing basis. RSI has also slipped beneath the midline, leaving momentum space open to extend lower.
Scenarios:
If DL2 (1.3725) holds → rebound risk back into 1.3860–1.3900.
If DL2 breaks/accepts → path of least resistance opens to 1.3600.
Catalysts:
Watch crude price momentum, Fed vs BoC policy signals, and near-term US/CAD data releases for confirmation.
Takeaway:
1.3725 is the decision line; below it, the structural path points to 1.3600.

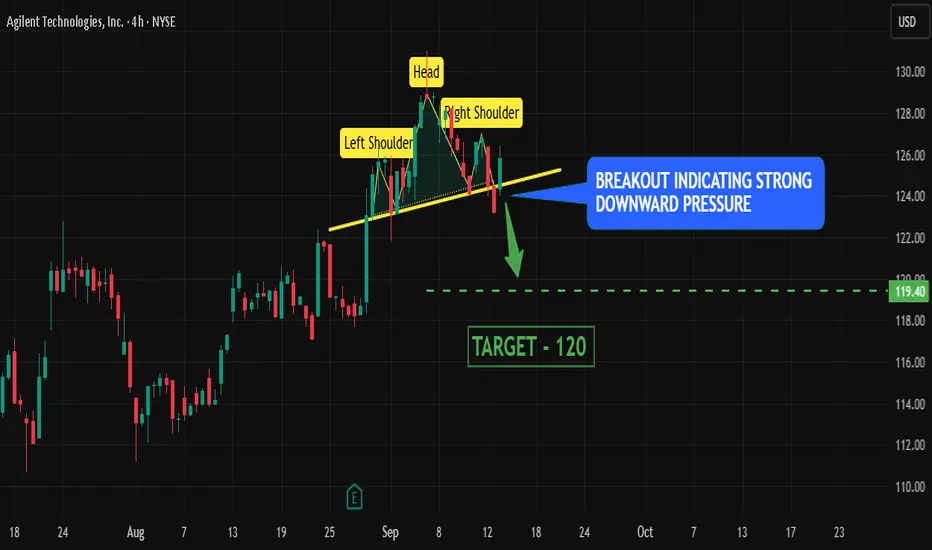
Head & Shoulder breakout in Agilent stock pointing Bearish move
HEAD AND SHOULDER BREAKOUT -
price broke out of head and shoulder pattern with a strong confirmation indicating strong downward pressure for the stock.
Definition -
(i) Left Shoulder → price rise, then fall
(ii) Head → higher rise, then fall
(iii)Right Shoulder → lower rise, then fall again
EVENING STAR CANDLESTICK -
1 large green candlestick followed by 1 doji followed by 1 large red candlestick is called evening star which indicates downward pressure for the stock
TARGET -
120 level
BULLISH ON GBP/NZDGBP/NZD has reached a nice demand zone and has created a beautiful inverse head and shoulders pattern.
Price is just now giving us a CHOC (Change of Character) to the upside breaking a previous strong high to the left.
I am waiting for price to pullback into that same demand area before buying, also watch out for the sweep below the (Head) of the Head and Shoulders.
Looking to catch 300-400 pips.

NZDCAD: Move Up Confirmed?! 🇳🇿🇨🇦
Another intraday bullish confirmation that I spotted today is on NZDCAD pair:
the price violated both a neckline of an inverted head and shoulders pattern
and a resistance line of a bullish flag pattern on an hourly time frame.
I expect a rise at least to 0.8265 level now.
❤️Please, support my work with like, thank you!❤️
I am part of Trade Nation's Influencer program and receive a monthly fee for using their TradingView charts in my analysis.

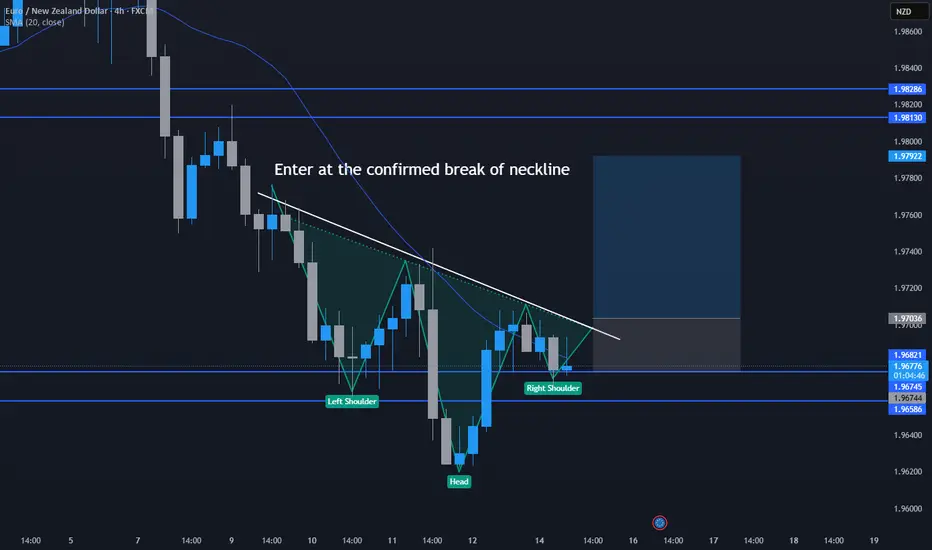
EURNZD Head and Shoulders Forming?A high probability head and shoulders has been forming on EURNZD. With the support area, this makes the setup a nice one. Wait for confirmed break then you can enter
Yes the chicken man - PPC Short?PPC is at the bottom of a monthly box and at VAL of the daily and weekly anchored volume profile. It could catch a bid here and retest $45.60s(VPOC).
If the retest ends in a rejection of that area, and a daily close below the previous low around $41.95 then I expect short continuation and validation of the H&S.
I would especially like this trade after a retest and rejection of box bottom around $43.41 - $43.30.
My targets would be 40.11, 38.98, 37.27,35.96 then 33.72.

The Chicken man?? - Potential H&S Play on PPCGot bored and scanned the market for potential shorts. This is what I came up with. The put call ratio on this thing isn't very high but that could change if we see a shift in character price action wise. There is a daily head and shoulders, I've drawn my target(low 30s) on the chart.
Let's see what happens.
~The Villain
