BTC at a Crossroad: Head & Shoulders or Moonshot? Analyzing the CME Bitcoin Futures chart, we can clearly see confirmation of the price gap between $92K and $94K, which significantly increases the probability of a Head & Shoulders (H&S) formation.
✅ Key Scenarios to Watch
Scenario 1 – H&S Confirmed:
Potential retracement toward $52K–$62K based on the right shoulder's depth
Scenario 2 – Failure H&S Confirmed:
Bullish breakout could push BTC toward $140K–$150K. based on the right shoulder's depth
🔍 Technical Insight
The left shoulde r formed near the Fibonacci 0.618 / 0.382 leve ls. Based on these Fib zones, the right shoulder could develop within a similar range—critical for validating the pattern if weekly closure occurs over 94K .
Disclaimer: This analysis is for educational purposes only and does not constitute financial advice. Always do your own research and manage risk appropriately before making any trading decisions.
Head and Shoulders


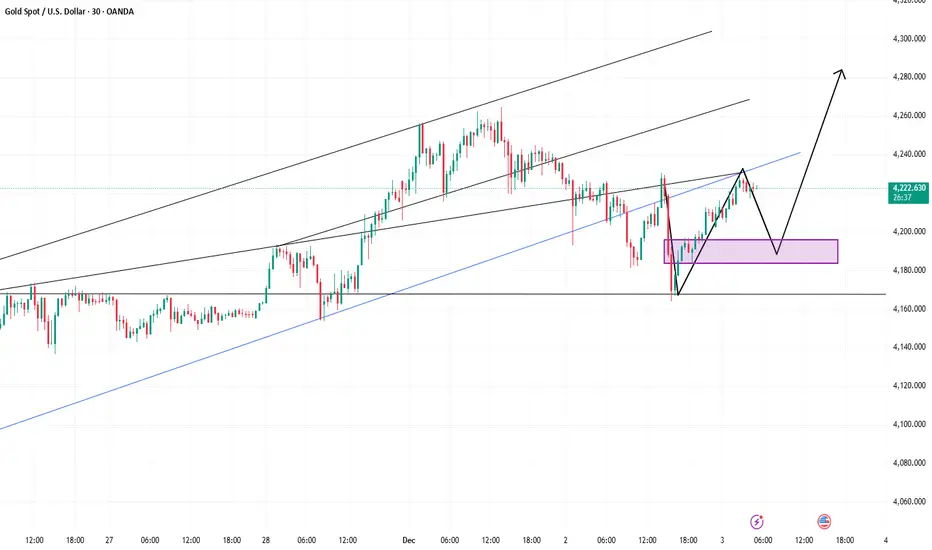
Gold Bulls Suppressed Repeated Tests of 4200Gold continued to fluctuate between 4190 and 4240 today, with 4200 being repeatedly tested. This range is expected to be broken soon, as the main support level has been rising over time, currently around 4198. If this level is broken, I expect the price to fall below the low of 4163, reaching the 4150-4130 range. If the price drops rapidly to this area, a rebound is likely, similar to the market reaction after today's data release, although the rebound may not be as significant. Of course, this also needs to be considered in conjunction with news developments.
Therefore, we need to adjust our trading strategy. We should lower the buying range to below 4170, and at the same time, we should lower the selling range to above 4200.

A head and shoulder for BFLY ?After bouncing from strongest support 1.3 , then drawing a head and shoulder between the 2.7
Now retesting and continue for the breakout from 2.7 . Next targets 4.2 and 5 . Between the 2 and 2.1 is the area for buy chance.

Potential Inverse Heads and ShouldersSummary
NASDAQ:RGTI is forming a potential inverse head and shoulders on the 4-hour timeframe. The neckline is sitting at around $27.5. A strong break above the neckline with volume indicates conviction and a good time to enter the trade. Target would be roughly $34.
Breakdown
Entry : $27.5
Target : $34
Caution
This stock is entirely speculative and has no real value from an investor's standpoint. The company still has negative revenue and is only kept up by retail traders hoping for a quantum breakthrough. Even though the potential pattern is bullish, it is best to position yourself more conservatively on companies that have no real income.

Gold Aiming for 4300? Watch U.S. PMI and ADP DataYesterday, gold once again showed a roller-coaster pattern—high-level consolidation, a pullback downward, yet still maintaining strong resilience near the highs. During the U.S. session, it fell to around 4163, but the late session recovered the losses strongly. If gold continues to hold this kind of structure, we may see the daily chart gradually shift into a rising consolidation, bringing the market back to a bull-dominant phase.
Although gold faces short-term profit-taking pressure, multiple factors—including Fed rate-cut expectations, strong central-bank buying, falling U.S. yields, a weaker dollar, and ongoing geopolitical uncertainty—continue to support the upside breakout. Looking ahead, the 5000 target may not be unrealistic. Keep a close eye on the Federal Reserve and upcoming key economic data.
Today, on rebounds, continue to watch the 4236–4245 and 4265 resistance zones; if price approaches but fails to break, consider light short positions. On pullbacks, first monitor 4211–4193, and if that breaks, watch the 4176–4163 support levels.
Price action remains highly repetitive at the moment. Short-term movement shows high-level choppy consolidation with repeated spikes and pullbacks. Maintain your rhythm—avoid chasing trades, and pay attention to disciplined execution.
Yesterday’s public plan was to buy near 4200, short around 4230, then buy again below 4178 and close at 4187, waiting for another dip to re-enter. However, the market turned strong, so we chased lightly in the 4187–4180 area and are still holding. If resistance near 4245 fails to break, the long positions will be closed, and we will shift to short trades.
Therefore, today’s trading plan is:
Sell above 4240
Buy below 4200
Bitcoin Head & Shoulders on 1H is pumping it above 100K$ soonFirst lets take a look at that Attractive Reversal pattern which is now obvious in all tokens:
#Head_Shoulders :
The recent downward movement successfully triggered a significant number of long-position stop losses, effectively executing a 'long squeeze' and absorbing substantial sell-side liquidity. This classic market-clearing event often removes weak hands and over-leveraged positions, thereby reducing immediate overhead resistance.
With this liquidation event concluded, the market structure has notably cleared a key obstacle. The path upward now encounters less selling pressure from previously vulnerable positions. This development supports a bullish technical outlook, with the next primary targets residing at the $100,000 psychological level and beyond, as the new market structure allows for a more sustained advance.
DISCLAIMER: ((trade based on your own decision))
<<press like👍 if you enjoy💚

EURNZD: Bullish After the News 🇪🇺🇳🇿
EURNZD formed an inverted head & shoulders pattern
on a key daily support cluster.
We see a bullish breakout of its neckline and a strong bullish momentim
after EU inflation data today.
Odds are high that the pair will rise at least to 2.0335 level.
❤️Please, support my work with like, thank you!❤️
I am part of Trade Nation's Influencer program and receive a monthly fee for using their TradingView charts in my analysis.

AUDUSD formed a H&S pattern on 1H TF - likely a bullish reversa?AUDUSD on 1H TF showing a H&S pattern and is likely to have a reversal of trend at the break of support zone

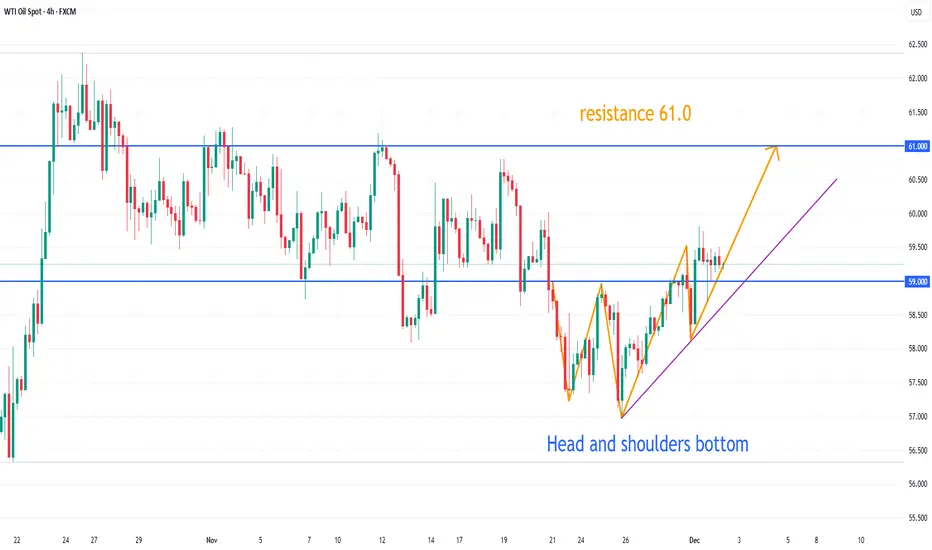
USOIL TP 61.0On the 4-hour chart, USOIL stabilized and then moved upwards, forming a head and shoulders bottom pattern in the short term. Currently, watch for support around 59.0; a pullback and stabilization after this level could present a buying opportunity. Resistance is seen around 61.0.
FORCE MOTORS ready for tejiForce Motors is showing a sign of inverted head and shoulder pattern. Entry will be above neckline breakout. Target will be all time high level of 22097.
Force Motors Ltd., incorporated in the year 1958, is a Small Cap company (having a market cap of Rs 24,021.64 Crore) operating in Auto sector.
Force Motors Ltd. key Products/Revenue Segments include Light Commercial Vehicles (Traded), Other Operating Revenue and Service Charges for the year ending 31-Mar-2025.
For the quarter ended 30-09-2025, the company has reported a Consolidated Total Income of Rs 2,105.89 Crore, down 9.32 % from last quarter Total Income of Rs 2,322.31 Crore and up 8.00 % from last year same quarter Total Income of Rs 1,949.90 Crore. Company has reported net profit after tax of Rs 349.60 Crore in latest quarter.
The company’s top management includes Mr.Abhaykumar Navalmal Firodia, Mr.Prasan Abhaykumar Firodia, Mr.Prashant V Inamdar, Mr.Mukesh Mangalbhai Patel, Ms.Sonia Prashar, Mr.Vallabh Roopchand Bhanshali, Mr.Rishi Luharuka, Mr.Rohan Sampat. Company has Kirtane & Pandit LLP as its auditors. As on 30-09-2025, the company has a total of 1.32 Crore shares outstanding.

Gold: Shorts from 4250 Profit — Beware of Shakeouts TodayOn Monday, gold moved higher within a range. It first surged to 4255 but met resistance and pulled back to find support, then consolidated around 4220 before moving upward again. Later, it was once more pressured downward near 4265. Yesterday, I publicly suggested buying below 4220 and watching the resistance near 4250—selling if the structure turned unfavorable. Today, gold pulled back below 4200. After taking profits perfectly during the drop, we executed a new long entry and captured a small gain.
From a technical perspective, based on the triangle breakout projection, the short-term key support zone defining bullish or bearish strength is 4170–4180. Within this zone, the strategy remains to follow the trend and buy. On a larger scale, gold is trading within the 4380–3890 range, which serves as the trend divider: a breakout above 4380 would restart the bullish trend, while a breakdown below 3890 would confirm a bearish trend.
So far, gold has completed its first test of the 4200 area. The short-term pattern continues to reflect a cycle of pushing higher, pulling back, retesting, and repeated consolidation. This level is likely to see more fluctuations. The key focus is whether the market can reclaim 4236–4245 during the next upward move.
Today’s trading plan:
Sell lightly near 4245 on a rebound; if the price breaks strongly, watch the resistance near 4265.
Buy near 4200 on pullbacks; if support breaks, watch the 4179 zone.

Bulls Still in Control?Hello traders! Here’s an idea for AUDCAD based on current structure, trend, and momentum.
(This is market analysis, not financial advice. Always use proper risk management and seek additional confirmations before entering a trade.)
Intraday Buy Idea (short term move)
• Entry: 0.91500 – 0.91600
• Stop-Loss: 0.91350 – 0.91300
• Target Area: 0.91800 – 0.92000
⸻
Market Analysis
AUD/CAD continues to trade within a relatively modest daily range—typical for this pair—especially as we approach the end of Q4 and move deeper into the holiday season, when liquidity thins and price action often becomes more choppy and range-bound.
On the 4-hour chart, an inverted head-and-shoulders pattern has formed. The market recently closed above the neckline/right-shoulder zone, confirming potential bullish structure. A clean retest of this zone (around 0.91500-0.91600) could provide an opportunity to catch the continuation of the bullish momentum that began late last week (around Nov 21).
Our target—0.92000—lines up closely with November’s high and a key structural resistance level. If momentum remains intact, price could attempt another test of this area.
⸻
Fundamentals (per economic sources)
Australia (AUD)
• The RBA has kept rates steady, maintaining stability in the AUD.
• Commodity prices trending higher (especially metals) provide underlying support for the Australian dollar.
• A potential shift toward U.S. Federal Reserve rate cuts later on can indirectly support AUD through broader USD softness and risk-on flows. (per economic sources)
Canada (CAD)
• Canada’s manufacturing sector continues to contract, signaling broader weakness.
• While recent GDP growth was positive, the expansion was driven mainly by oil exports and government spending, not broad economic strength.
• Mixed and uneven economic performance may limit near-term CAD strength.
Combined, these factors support a slightly bullish bias for AUD/CAD in the near term, aligning with this technical setup.

XAUUSD shortSell Limit 2043.331
TP 2029.155
SL 2046.182
Risk/Reward Ratio (RRR) 4.97
TP1 2038
TP2 2034

EURUSD Long: Channel Support Intact, Path Open Toward 1.1625Hello, traders! EURUSD is trading within a developing ascending channel, where price action continues to respect both the higher lows and the upper boundary of the structure. This upward movement formed after buyers defended the Demand Zone around 1.1550, which acted as a strong pivot area and triggered a bullish reversal via a clear inverse Head and Shoulders pattern. This pattern gave buyers the momentum needed to break back above the mid-range structure.
Currently, after reclaiming this level, EURUSD made a steady climb inside the ascending channel. However, price is now approaching the 1.16250 Supply Zone, which has previously acted as a strong reaction area where multiple breakouts and fake breakouts occurred. This remains the key short-term barrier that buyers need to overcome for further upward continuation.
My scenario: if buyers maintain structure above the Demand Zone at 1.15900 and hold the ascending channel’s support, EURUSD may continue pushing toward the 1.16250 level. This zone, aligned with the channel’s upper boundary, is the main target for the current bullish leg. A clean breakout above this resistance could open the door for a stronger bullish extension. However, if price reaches the Supply Zone and shows weakness or rejection, a corrective pullback toward the channel’s lower boundary is possible while still preserving the bullish structure. As long as EURUSD holds above the Demand Zone and respects the channel, the bullish scenario remains valid. Manage your risk!

EURGBP SELL 0.8800On the 4-hour chart, EURGBP has formed a head and shoulders pattern. Currently, attention should be paid to the resistance around 0.8800, which is the resistance level of the descending trendline. Shorting opportunities may arise at this level, with a downside target around 0.8700.

USB | This Regional Bank May POP Higher ! | LONGU.S. Bancorp operates as a bank holding company, which offers financial services including lending and depository services, cash management, foreign exchange and trust and investment management. The firm also offers mortgage, refinance, auto, boat and RV loans, credit lines, credit card services, merchant, bank, checking and savings accounts, debit cards, online and mobile banking, ATM processing, mortgage banking, insurance, brokerage and leasing services. The company was founded on April 2, 1929, and is headquartered in Minneapolis, MN.


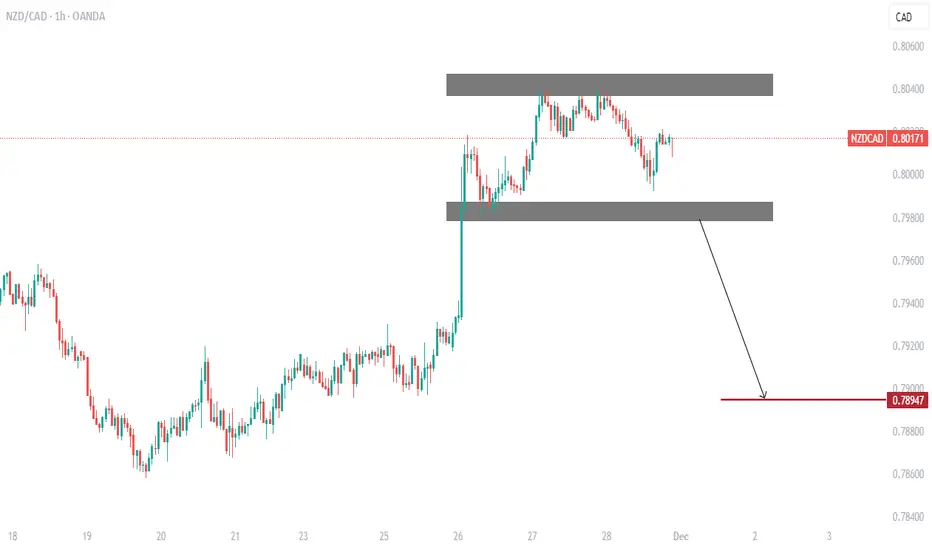
NZDCAD: Chart Pattern Confirmation.NZDCAD have been on upward rise, the pair is trending on descending channel of lower highs and lows, in regards to the bigger time frame structure. the 1hr chart is clearly displaying a partial formation of double top and head shoulders chart pattern.
Meanwhile we can spot that the price is setting off to head downward.
Key points;
A confirmed breakdown below this pattern horizon, would activate a short to 0.7894 as possible target.
Thanks for reading.
DVN | Strong Oil & Nat Gas Producer About to Pop | LONGDevon Energy Corp. engages in the exploration, development, and production of oil and natural gas properties. It develops and operates Delaware Basin, Eagle Ford, Heavy Oil, Barnett Shale, STACK, and Rockies Oil. The company was founded by J. Larry Nichols and John W. Nichols in 1971 and is headquartered in Oklahoma City, OK.

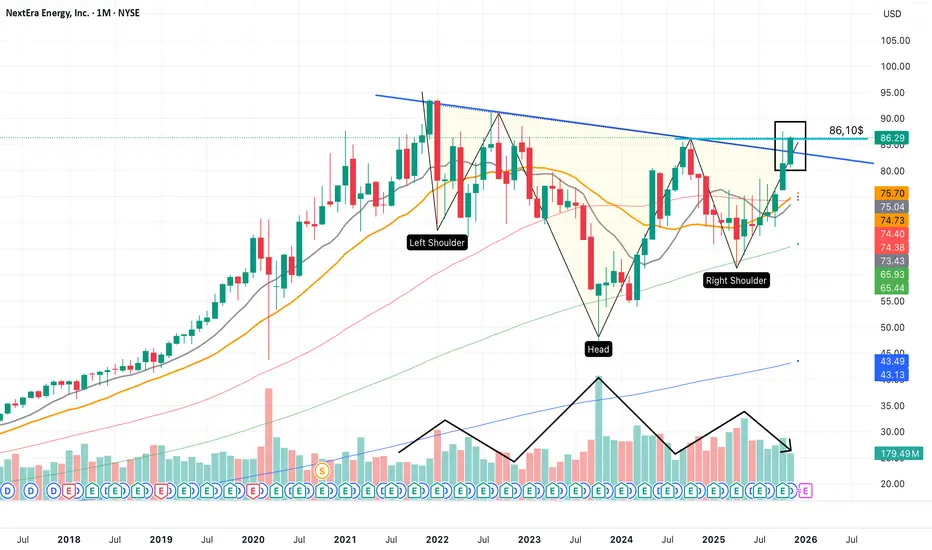
Inverse head and shouldersThe price completes an inverse head and shoulders pattern on the monthly chart, closing above the neckline and surpassing the previous high of $86.10.
The strong demand for energy from data centers is expected to drive revenue growth in the coming months.
PEP | Bullish Move Incoming for Pepsico| LONGPepsiCo, Inc. engages in the manufacture, marketing, distribution, and sale of beverages, food, and snacks. It operates through the following business segments: Frito-Lay North America (FLNA), Quaker Foods North America (QFNA), PepsiCo Beverages North America (PBNA), Latin America (LatAm), Europe, Africa, Middle East, and South Asia (AMESA), and Asia Pacific, Australia and New Zealand, and China Region (APAC). The FLNA segment consists of branded convenient food businesses in the United States and Canada. The QFNA segment includes cereals, rice, and pasta under the Quaker, Pearl Milling Company, Quaker Chewy, Cap'n Crunch, Life, and Rice-A-Roni brands. The PBNA segment is composed of beverage concentrates, fountain syrups, and finished goods under various beverage brands such as Pepsi, Gatorade, Mountain Dew, Diet Pepsi, Aquafina, Diet Mountain Dew, Sierra Mist, and Mug. The LatAm segment covers beverage, food, and snack businesses in the Latin American region. The Europe segment offers beverage, food, and snack goods in Europe and Sub-Saharan Africa regions. The AMESA segment deals with all beverage and convenient food businesses in Africa, the Middle East, and South Asia. The APAC segment refers to all business operations in the Asia Pacific, Australia and New Zealand, and China region. The company was founded by Donald M. Kendall, Sr. and Herman W. Lay in 1965 and is headquartered in Purchase, NY.

