PSX: Engroh projects - long call - daily timeframePSX: Engroh projections
Fib levels
inverse head and shoulders
Head and Shoulders

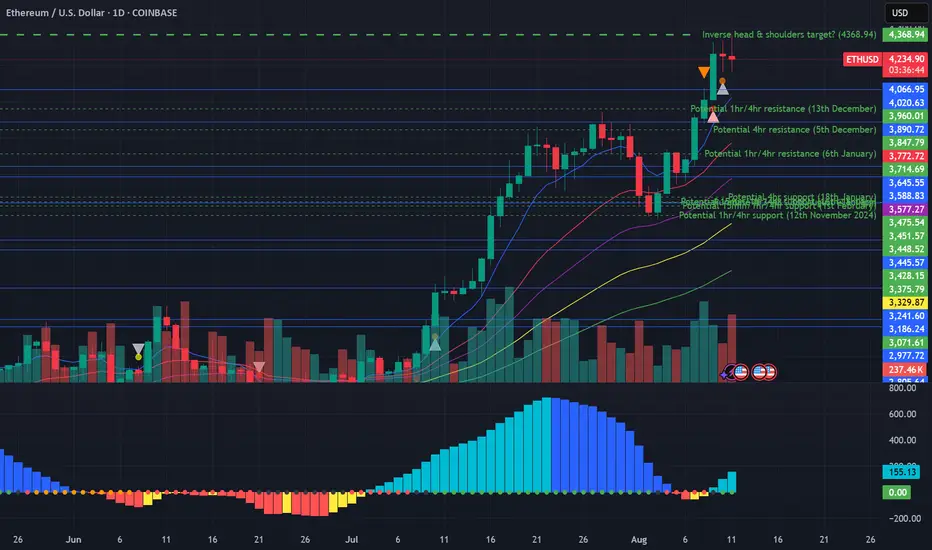
Potential inverse head and shoulders target reached on EthereumWell... nearly reached at this stage anyway. In a similar vein to Dow Theory (in which you would normally expect that the Dow Jones Industrial Average would rise alongside the Dow Jones Transportation Index, the Nasdaq Composite, the SP500 and the Russell 2000 indices), let's suppose you would expect that Ethereum would rise alongside Bitcoin and the other altcoins.
Let's face it, Ethereum has had a great run recently, but what has Bitcoin been doing over the past month in particular? Literally nothing. Zero, zilch, nada... But why am I bringing up caution at this stage whilst everyone is so bullish about Ethereum? Let's scale out. If you look very far out to earlier this year, there was spike down in February for Ethereum (which formed a 'left shoulder' downward), and further retracement in share price downward to the ultimate low in April two months later to form the 'inverted head', followed by upward movement to form the inverted 'right shoulder' in late June.
This allows us to draw a 'neckline' at around about the 2880 level. Extending calculations from this neckline to the inverted head provides a range of approximately 1400, but when utilising exact numbers utilising charting software, and extending this range upwards from the neckline northwards provides a potential target of 4,368.94, which is fairly close to where we've been recently (the high of 4,333.13 about 2 hours ago at the time of writing).
Unless Bitcoin can get itself moving, as well as Ethereum turn around with respect to the one hourly momentum, tread cautiously and consider the possibility that the target may be reached of this head and shoulders target for Ethereum (thus, neutral bias at this stage, with potential to turn bearish).
Crm classic double top monthly Seems pretty straight forward - second top usually reaches slightly higher and with a clear head and shoulders forming on the weekly it seems like a no brainer to be short to 215 and if that breaks which I think it will could be a long tumble down to the 150s

XAUUSD SELL SETUPGold already on a level of supply zone after the liquidity grab , and on 1hr time frame we already seeing a change of structure and distribution schematic .. also looking from chart pattern thats also a possible head and shoulder pattern.. looking to sell if the retrace back to retest that order block

eurnzdRetesting recent H4 strong resistance zone and 50EMA. H1 & M15 have some inverse head and shoulder action going on. Targeting the next daily high. If price goes above 1.97000, 1.98000 could be next.

ethusdETHUSD HEAD AND SHOULDER
Sell Trade 30 minutes 15 minutes
After extreeme bullish momentume a retrace can seen in ETH chart
H&S can be seen trade it when price brakes the neck line retest and go down before a new upside run!


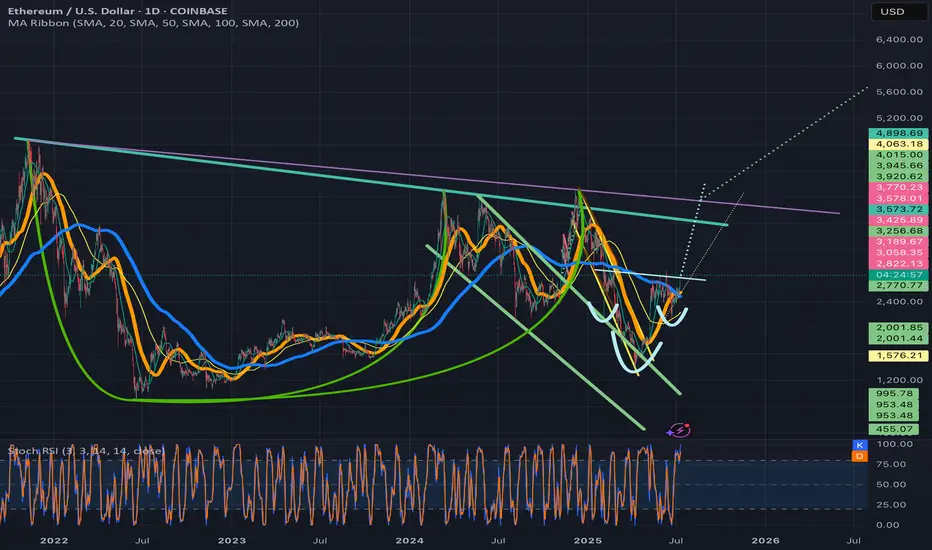
Ethusd breaking above invh&sEthusd chart has a similar set upas the total2 chart, a cup and handle that is breaking up from a smaller inverse head and shoulders that will complete the handle to the cup. Ethereum actually has two potential to trendlines for its cup and handle and I wouldn’t be surprised if both are valid. The breakout target for the inverse head and shoulder pattern will take price action above both of them. Once we solidify the top trendline for the cup and handle patterns as support the breakout target for it is $7161. Ethereum just recently had a golden cross on the daily which adds to the probability the inverse head and shoulder pattern breakout will be validated. *not financial advice*
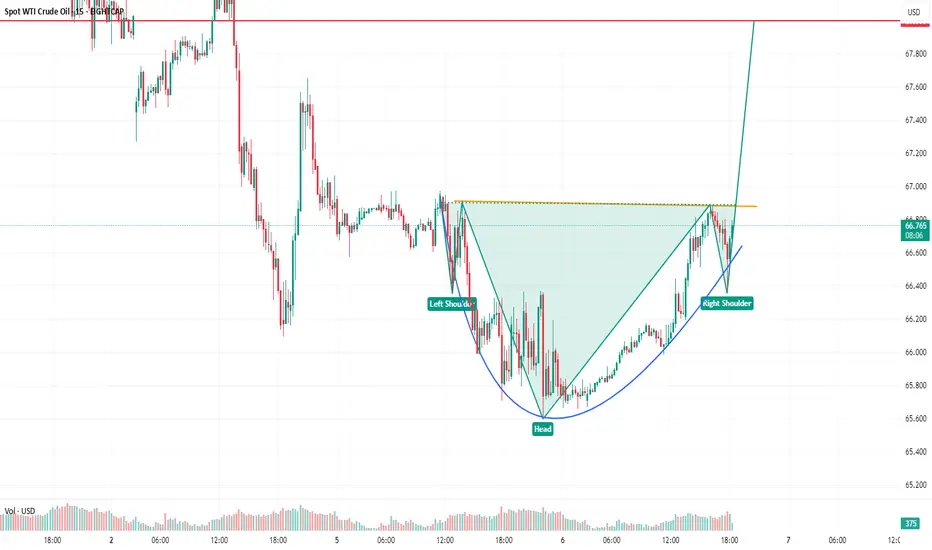
Is oil price heading back up? Watching a potential inverse head and shoulders forming on the 30-minute chart for Oil.
🔹 Risk/Reward: 2.7
🔹 Entry: 63.290
🔹 Stop Loss: 63.043
🔹 Take Profit 1 (50%): 63.93
🔹 Take Profit 2 (50%): 64.21
A couple of key factors still need to align before I pull the trigger:
• One will confirm around 14:45 SAST (GMT+2)
• Looking for lower volume on the right shoulder compared to the left
What do you think? Is oil ready to push higher?
Drop your thoughts or how you trade inverse head and shoulders below! 👇

GBPUSD - Bearish ValidationGBP completed HAS pattern and now is testing the Resistance cluster - what for me is the Bearish Validation of trend reversal to downtrend.
Yet the price is staying within the downtrend channel.
If price respects the Resistance and the channel - we are in the downtrend.
Jus my humble opinion

XLV SHORTMonthly chart - Head and shoulders pattern with a break below neckline and 200MA. Target for the pattern is around 118 looking to pick up long term shares there.

Bearish Head and Shoulder Pattern = Bullish As you can see, a bearish Head and Shoulders pattern is forming on the BTC dominance chart, specifically on the 4-hour timeframe. The neckline has already broken down, which indicates potential downside movement in dominance. This could lead to a strong pump in altcoins in the coming days. So, if you're thinking about selling right now, it’s better to hold and wait. You may start seeing results within the next two to three weeks. Keep an eye on this setup and watch how it plays out

Bitcoin inverted HEAD & SHOULDERSIf this is an inverted HEAD & shoulders pattern for bitcoin, then the neckline is already broken and bitcoin is Back testing that now, well the target is $160k as well

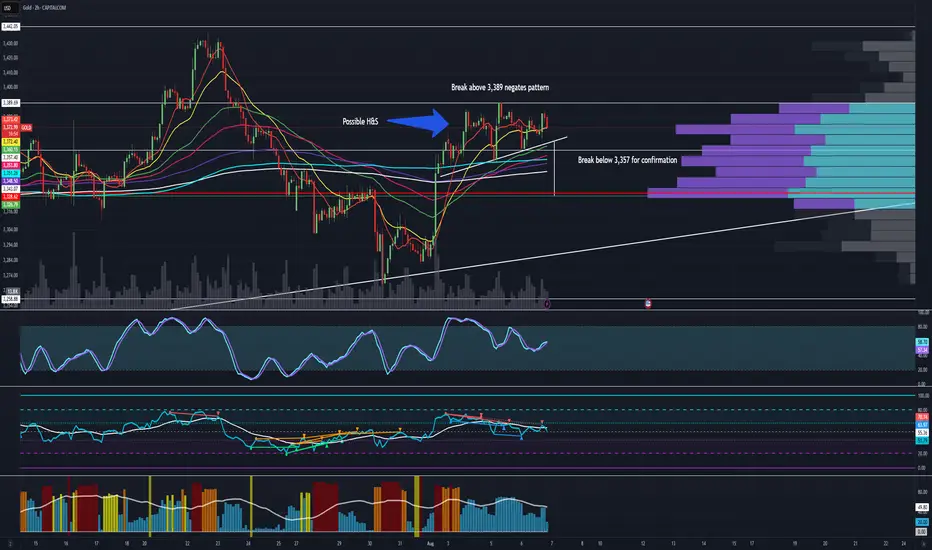
Possible Head and Shoulders Pattern - Analysis and TargetsWe have a possible head and shoulders formation on Gold. Upon a break below 3,358, we would have a target down to 3,327 which also would line up with our volume blocks on the VPVR. A break above 3,390 would negate this pattern. If we break down we are still in a macro ascending triangle formation which would be a bullish formation until proven otherwise.
Short Term : Bearish
Medium/Long Term : Bullish
Bel intradat setup after neckline brekaout target 404Cup and handle formation in short duration
Neckline 390
After breakout target is 404.
Swing trade target SL will be 386
Take entry only after neckline breakout either with heavy volume or with heavy monemtum.

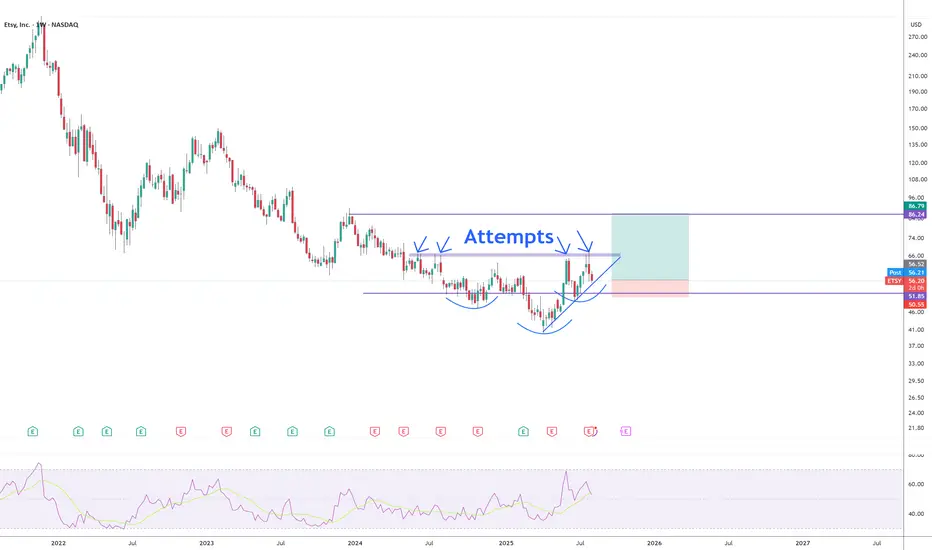
Many attempsInverse HS forming to break out the 67 resistance area. More than a year trying to break it, and now is forming a super bullish pattern to get over with it. Once it breaks it, will just go up. Hold this for a few months. SL if a weekly candle closes below the support area.
Waaree energyies ready for warWaaree energies forming head and shoulder pattern waiting for neckline to break.After that target will be 1200 points atleast. This target is long term target it may take atleast 13 weeks after break out.
So target is 4400
Neckline 3200
Wait for 3400 for safety after that take the trade for the target of 4400.

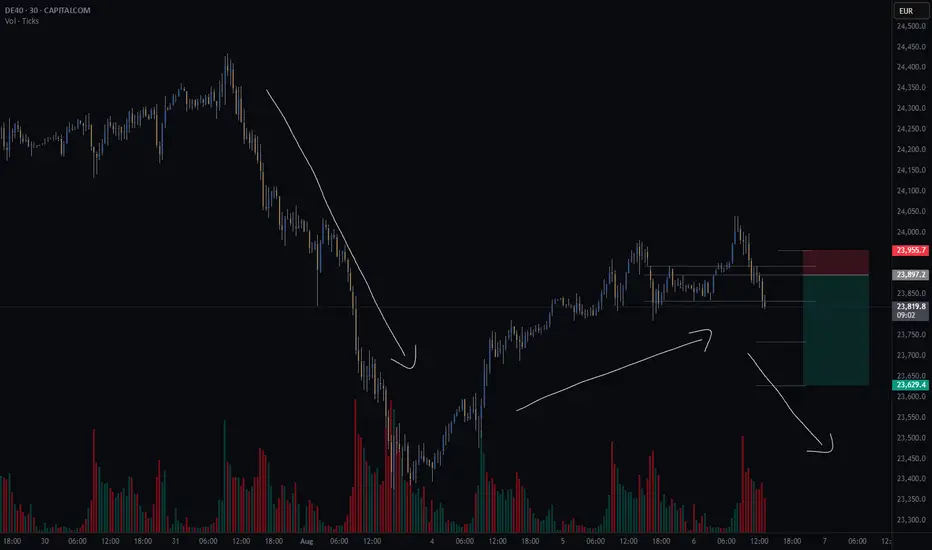
GER40CASH (DE40) - potential short - HSThere is a potential head and shoulders continuation pattern.
What I like about this setup is the GER40 is potentially creating a bear flag.
Finding a continuation pattern within the bear flag, like the head and shoulders, is a great entry point for the second part of the downward move.
Still waiting for my system to confirm some variables before I take the trade.
Risk/reward = 4.3
Entry price = 23 905.3
Stop loss price = 23 955.4
Take profit level 1 (50%) = 23 733
Take profit level 2 (50%) = 23 628
EURJPY: Classic Bullish Pattern 🇪🇺🇯🇵
There is a high chance that EURJPY will continue growing.
A bullish breakout of a neckline of an inverted head & shoulders
pattern leaves clear bullish clues.
Next resistance - 171.9
b]❤️Please, support my work with like, thank you!❤️
I am part of Trade Nation's Influencer program and receive a monthly fee for using their TradingView charts in my analysis.

WTI Spot crudeinverted head and shoulder observed if breakout given target too in chart. Not a sebi registered analyst . No buy, sell and hold recommendation personal view.
HEROMOTOCO accelerating into a bullish breakout– momentum trade!This is the Daily chart of HERO MOTOCORP LTD.
Hero MotoCorp has formed a Head & Shoulders pattern, and the stock has recently given a breakout above the neckline. It has also retested the shoulder zone, confirming the breakout and it's shoulder pattern target is 4800 and head pattern target is 5750.
HEROMOTOCO having a good support zone near at 4100-4200.
If this level is sustain then we may see higher prices in HEROMOTOCO.
Thank You !!

EURJPYBroke out of a strong daily/H4 resistance zone, retested multiple times with inverse head and shoulder forming on the H1.

Next predictions for ZoraI see two scenarios for Zora on the chart, one scenario is a head and Shoulder pattern , which pushes Zora down .
and the next scenario is the possibility of another bullish wave.
