Bunge Breaks Out of Head & Shoulder with Volume SurgeHead & Shoulder Breakout -
Bunge (BG) has recently broken out of a Head & Shoulder pattern .
This breakout indicates a potential continuation of bullish momentum.
Volume Confirmation -
The breakout was supported by a strong surge in volume on the last trading day .
Rising volume adds conviction and reliability to the breakout.
Support Trend Line Break -
The stock has also broken out of the support trend line .
This trend line was formed during the previous Inverse Head & Shoulder pattern formation .
A breakout from this structure gives additional confirmation of strength.
Price Target -
Based on the breakout and pattern analysis, the next upside target is projected at 73.9 .
Technical Confluence -
Breakout from a major pattern (Head & Shoulder).
Volume surge confirming buying interest.
Breakout from trend line formed during earlier Inverse H&S.
All these factors combine to strengthen the bullish outlook.
Head and Shoulders

#JX - Bull Market about to resume, massive inv Head & Shoulders.The Canadian venture index
After completing one Inverse Head and Shoulders that made target and overshot into expected resistance.
Has now setup a massive larger inverse head and shoulders that projects to previous all time high's last seen nearly 20 years ago.
The venture index is full of junior miners and commodity companies that have a letter .v Suffix
Once it has done retracing I expect it to attack the neckline for the Big pattern breakout.

GBPCAD: Intraday Bearish Signal 🇬🇧🇨🇦
GBPCAD may drop from a key daily resistance.
A breakout of a neckline of a head & shoulders pattern
on an hourly time frame indicates a strong selling pressure.
Expect a retracement at least to 1.85 level.
❤️Please, support my work with like, thank you!❤️
I am part of Trade Nation's Influencer program and receive a monthly fee for using their TradingView charts in my analysis.

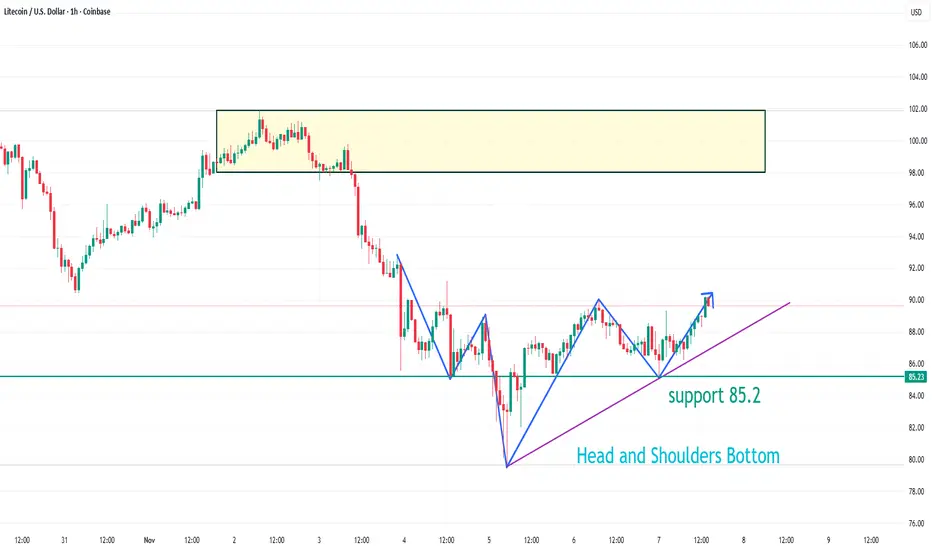
LTCUSD has formed a head and shoulders bottom patternOn the 1-hour chart, LTCUSD has formed a head and shoulders bottom pattern. Currently, watch for support around 85.2; if it retraces but doesn't break below this level, it's likely to continue its upward trend, targeting the 98.0-102.0 area.

AFCOM Just tracking idea for a friend :)
watching at head & shoulder on daily & possible bull pennant on weekly lets see how price develops further

ZCash ZEC Strong Accumulation about to play outZCASH has seen a long accumulation phase during which especially Koreans (ZECKRW PAIR) has seen alot of Volume the past few Weeks/Months.
As soon as this BTC pullback os over and the fear in the market clears. ZEC will be ready to move strongly.
I marked the first few months of ZEC/USD or even ZECBTC in a black box. The Valuation can be ignored. It was only cause due to it's low initial supply.
Like If you appreaciate.
Feel free to tip so i can start doing this on a regular basis.
BTC 0.09% -0.90% / Bitcoin: 1GLr5xkEQonUBquXjLQWoxhT5BSxdTpkur

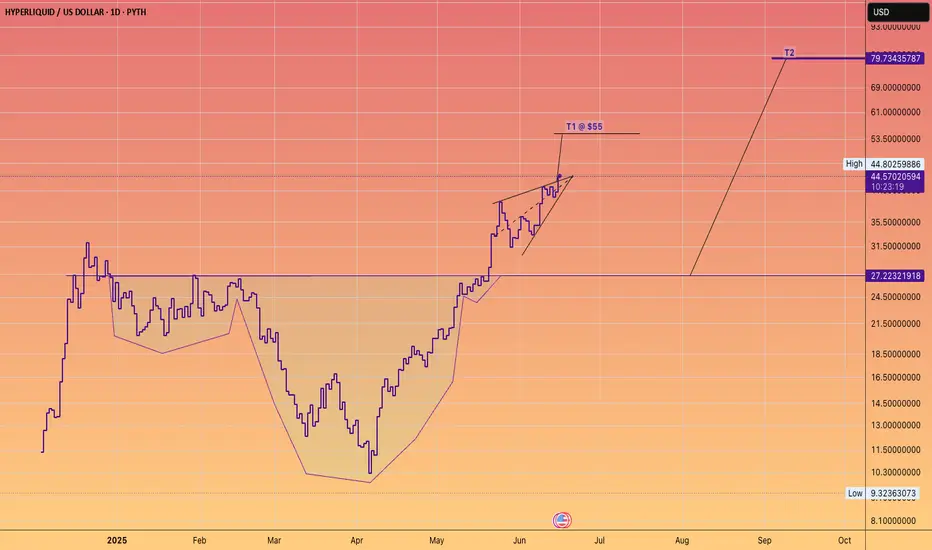
Don't fight the HYPE train!The James Wynn saga was wonderful advertising for the platform.
(Maybe it was staged).
Either way #Hyperliquid goes higher.
EUR/CAD: Bullish Outlook📈EURCAD formed a significant inverted head and shoulders pattern on a 4-hour timeframe.
The neckline for this pattern is identified between 1.6226 and 1.6210.
Should the price successfully break and close above this neckline, it would indicate a strong bullish signal.
In such a scenario, the market could potentially advance towards the 1.6560 level.
Please note that the neckline currently acts as a robust demand area. Shorting opportunities should only be considered after a confirmed breakout of this level.

GBPCHF Fall/Rise?GBPCHF is back down near one if it's lowest points and close to a SUPPORT area. Possible reversal getting into London Session after confirmation.

BCOUSD Oil has taken all the fractal lows and is looking to the upside. If dxy softens as I believe we go up a ton. The low time frame pattern is easily recognizable. HTF bullish and done falling. Time is soon for the black viscous stuff.


Eur/aud 4hrPrice has come down to a strong level of support (grey box)
4hr has given head and shoulders pattern

SI1! - Comex Silver Futures 4hr
Head and shoulder pattern noting the conflicting inverse H&S in it’s right shoulder.
Break out or Break down?
Bias 3.7458/1 Sellers

$BTC BEARISH CROSS on the 20 / 200 DMA We had a similar setup at the end of September of 2021 where CRYPTOCAP:BTC then rallied a week later ~75% over the next few weeks.
However, every other time this bearish cross occurred in the past, ₿itcoin has spent at least a couple months trying to reclaim the 200DMA.
Currently PA has closed the Day below the 200DMA.
Bulls CANNOT afford a Weekly close below $106k, which is well outside the DANGER ZONE and .382 Fib
GOOD NEWS: An Inverse Head & Shoulders pattern has formed.
Bulls need some big volume days to come reverse the localized downtrend ASAP.
If not, the 50WMA will be tested ~$103k.
If that happens, Bulls must not show any weakness nor allow Weekly Closes below it.

$BTCUSD: $106K area needs to holdBITSTAMP:BTCUSD : $106K area needs to hold to negate the H&S pattern. If it turns around and takes out $116K, it would transform into the Wyckoff accumulation pattern.
Waiting for a resolution.

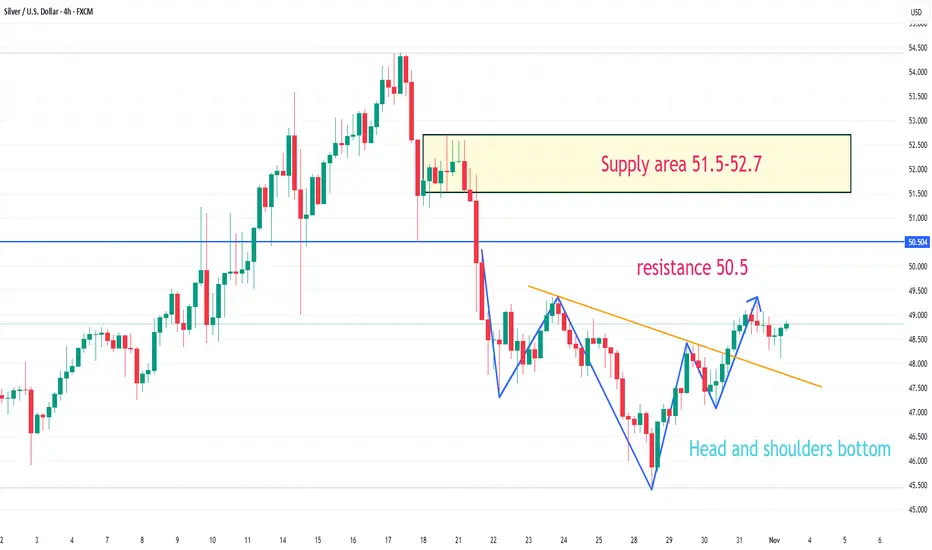
XAGUSD has formed a head and shoulders bottom patternOn the 4-hour chart, XAGUSD has formed a head and shoulders bottom pattern. Currently, watch for resistance around 49.4; a break above this level could lead to further upward movement, with resistance around 50.5, and further upside potential in the 51.5-52.7 area after that.
TALK | Mental Health Services on the Rise | LONGTalkspace, Inc. engages in the operation and development of a technology platform used in connecting patients to licensed mental health professionals through messaging, video, and audio. The company was founded by Frank Roni and Frank Oren in 2012 and is headquartered in New York, NY.

$SOUN Jade Lizard Trade 1/16/2026 ExpirationNASDAQ:SOUN
CALL CREDIT SPREAD, above price:
Buy SOUN $19 Call 1/16/2026
Sell SOUN $18 Call 1/16/2026
SHORT PUT, below price:
Sell SOUN $14 Put 1/16/2026
Credit to open: Approx $200 (TBD)
END RESULT SCENARIO #1: Share price between $18 and $14 @ expiration = Credit to open is max profit (best case scenario).
END RESULT SCENARIO #2: Share price above $19 @ expiration = Credit to open minus $100 (no risk to upside).
3) END RESULT SCENARIO #3: Share price at or below $14 = Assigned to purchase 100 shares. The result is now you own 100 shares at an avg cost of ~$12 per share.

US100 phase D confirmedNOT financial advice, please be cautious with your capital, you are the only and solely responsible for your actions and reaction at every time so asses properly the information shared, after all I don't know better than a hedge fund, but if they tell you something on the charts, why not listening to them?
Interestingly enough, phase c is already checked and phase D too. the neck has been already confirmed by the pro when they defended the neck + it made the masses enter heavily just for the matter of being above the neck. what i am expecting? A phase C on a smaller timeframe such as 15 min. Potential path 26171 because it is the ceiling and everyone knows that + it is impossible to know if the market will already continue higher after reaching 26171 or instead will continue with phase D and then a potential shake out (look that i am talking in the future, different projections)

AUDUSD | Inverse Head & Shoulders – Bullish Breakout Setup AheadTimeframe: 4H
Pattern: Inverse Head & Shoulders
Sentiment: Bullish (Waiting for Confirmation)
#AUDUSD is forming a perfect inverse Head & Shoulders pattern on the 4-hour chart — a strong bullish reversal signal after the recent downtrend.
Currently, there are no clear bearish signs, and the structure looks solid. For bullish confirmation, I’ll be waiting for:
✅ A clean break above the neckline
✅ A successful retest of the neckline as support
✅ Then looking for long entries with proper risk management
Potential Targets:
First target: 0.67061
Second target: 0.67922
Stop-loss: Below the right shoulder
This could be a textbook reversal setup if the neckline breakout holds. Keep an eye — it might offer a great long opportunity in the coming sessions.
What’s your view on #AUDUSD — do you see the same bullish pattern? Drop your thoughts below!
Like and follow for more clean price-action setups every week!

NAS100 Head and Shoulders and Gap If I am correct, and that is an M15 TF head and shoulders pattern then we might finally see a fill of that gap.

EURUSD downside target: 1.140On the daily chart, EURUSD has formed a head and shoulders pattern, indicating short-term bearish dominance. Currently, the price is trading below the downtrend line. Intraday, watch for opportunities to short on rallies around 1.160. Support is currently around 1.154; a break below this level would target 1.140.
