Sequent is about to give breakoutSequent is about to give breakout of reverse head and shoulder pattern, SL should be day's low
Head and Shoulders

$BTCUSD: everything hangs on whether this support will holdBITSTAMP:BTCUSD : if supports here, $107 area would be the bottom and forming the right shoulder of iH&S.

Brent Brent crude is compressing into a funnel. Expect upside in the near term. Htf and now ltf aligning. Expansion is next.

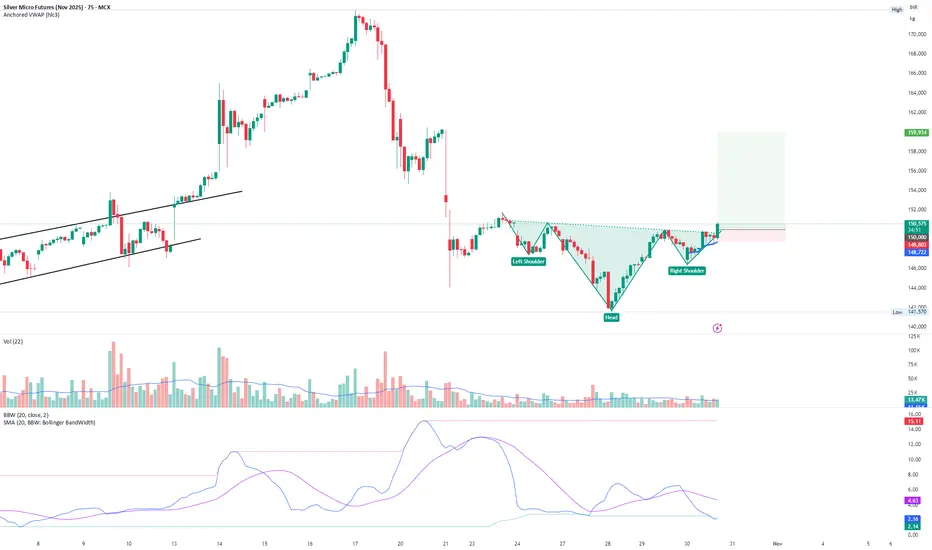
Silver micro breakout tradeInverse head and shoulders breakout is in progress in silver micro futures.
Silver tried to go down thrice but failed and came back up.
The bearish candles were strong as well but still silver stood ground and is breaking out.
Currently silver has formed inverse head and shoulders pattern.
1st Possible target can be 159900 rs which is 21st october high.
GOOG | The Year of Quantum | LONGAlphabet, Inc. is a holding company, which engages in software, health care, transportation, and other technologies. It operates through the following segments: Google Services, Google Cloud, and Other Bets. The Google Services segment includes products and services, such as ads, Android, Chrome, devices, Google Maps, Google Play, Search, and YouTube. The Google Cloud segment refers to infrastructure and platform services, collaboration tools, and other services for enterprise customers. The Other Bets segment relates to the sale of healthcare-related services and internet services. The company was founded by Lawrence E. Page and Sergey Mikhaylovich Brin on October 2, 2015 and is headquartered in Mountain View, CA.

COMEX Silver Futures : Head & Shoulder chart pattern formationCOMEX Silver futures is forming Head & Shoulder chart pattern with a neckline at 45.90. A break below this support level could lead to further correction. Currently, the price is 47.75, facing resistance at 48.5-49.
Key Levels:
- Neckline Support: 45.90
- Current Price: 47.75
- Resistance: 48.5-49
- Potential Outcome: Break below 45.90 may lead to further decline, while sustaining above 49 could indicate a bullish reversal
Trading Strategy:
- Break Below Neckline: Potential short-term correction
- Resistance Breakout: Sustaining above 49 may lead to upside momentum
- Risk Management: Monitor price action around key levels for trading opportunities

EURUSD | Bias Shift & QML Zone in FocusThe previous setup has been invalidated as the market showed a clear Change of Character (ChoCh), flipping the structure and order flow to bullish.
With that shift, my bias has now turned bullish, and I’ve marked the QML (Quasimodo Level) zone as my area of interest.
I’ll be waiting for price to tap into this zone and show confirmation before considering any execution.
Adaptability is part of discipline — the market evolves, and so should the bias.
⚠️ Disclaimer: This analysis is for educational purposes only. Always manage your risk and trade responsibly.

$BTCUSD: found support at the channel bottom. BITSTAMP:BTCUSD : I added to my longs at $109K - $110K range. The entire bottoming pattern also looks like a complex head and shoulders. Once $116K breaks to the upside, we should see some strong moves up.

Btc head shouldersSometimes you have to switch off the noise to begin to hear with more clarity. The same goes with price action, candle wicks are loud and in your face. Daily open, and in this case, daily close, line drawings can give you a clearer less obstructed view. The W pattern is a harmonic bat on the right shoulder.
The fib extension is a projection, not fact, but points to a round number 90k ish.

Before DOW 50K Happens (DJI long call for holders)Remember the future. Beware of the past. This time it's different. That's all.
I recommend studying Richard Wyckoff Stock Trading Technique, but not Tape Reading because that information is past its prime, in my opinion ;)
There's nothing left but upward ascent for humanity in my view. This is to do with spiritual reasons that many of us traders are privy to in our inner circles.
This chart is directed guidance towards the g20 group and the G7 group of Countries we call Home on Earth protectors.
We use capitalization as necessary to achieve the desired effect, affect, or required attribute enrichment in order to AVOID City 17, and not have to go back to the old ways of fearing totalitarian rule.
I posit that Donald Trump, The President of the United States of America, will eventually reply to my Christmas letter from 1993 and finish Home Alone 3, but I degress.
Some of us write letters. This is one such letter to the public; I used to write letters to Bill Gates on an IBM PS2, if you know your stuff.
This is my final chart, at least for a while. I always say something like that when I post a grand prediction like this one.
I bid you all well, and hope you find fruitfulness in your future life endeavors.
BLUEDOG OUT

Retest 100K?I want to be bullish on Bitcoin. We have a rate cutting environment, skyrocketing sovereign US debt, potential rotation from gold into bitcoin.
But the technicals right now are ugly and bearish:
1. Right shoulder formation
2. Stochastic reversion
3. Unbroken downward channel
Recipes for another flash crash or sell off back to the unbearable 100K level IMO. Sellers are still in control regardless of the fundamental backdrop.

AUDUSD: Major Resistance.Hello everyone,
Lets take a sight on AUDUSD, the pair is presently at the resistance zone. in regards to the structure the price have respected this level for several times, qualifying it as the major resistance. we assume this as opportunity to short.
However we look forward for a clear confirmation.
Key Points;
A confirmed retracement below the resistance would set off downward movement to 0.6482 as potential target.
Thanks for reading.

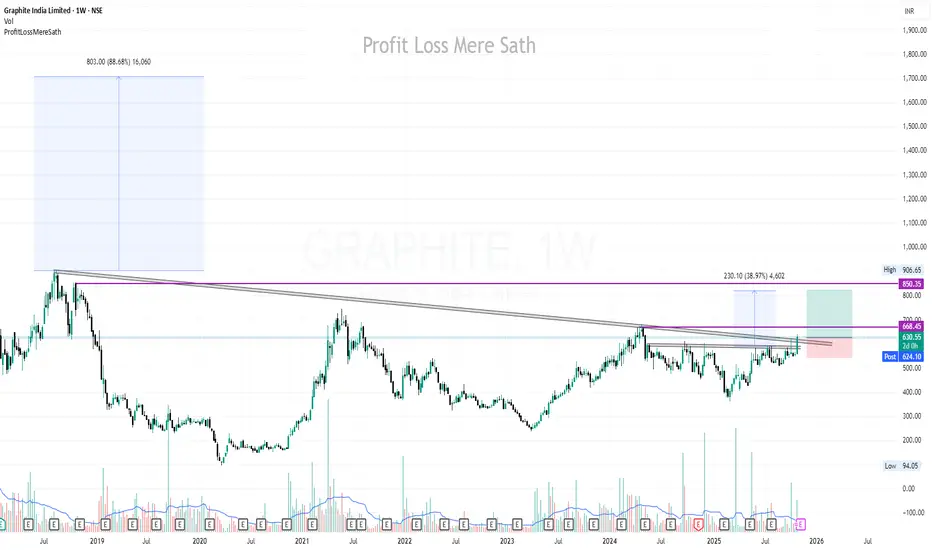
GRAPHITE | Buy @622 | SL below 540 | Targets 825, 900, 1700Disclaimer:
This is not financial advice. Please do your own research or consult with a financial advisor before making any investment decisions. Investments in stocks can be risky and may result in loss of capital.
Possible upward movement for AVAXIn recent days, there has been a pattern of accumulation, and in the 4-hour timeframe, a reverse head-and-shoulders pattern can be seen.
If we add the gap filled in BTC and ETH + accumulation in the TOP 10, it could result in an upward movement for altcoins.

TTD – Potential Inverse Head & Shoulders Formation in PlayA potential inverse Head & Shoulders formation appears to be developing on The Trade Desk (TTD) daily chart.
The neckline sits near 55.56.
A break and close above 55.56 could trigger the pattern, with an upside target around 67.28 based on the measured move. The target aligned with both the 50% Fibonacci retracement and the Ichimoku Senkou Span B — a key confluence area.
Invalidation lies below 48.54; a breakdown there would negate the setup.
Focus on the chart, not the headlines.
(Educational idea – not financial advice.)


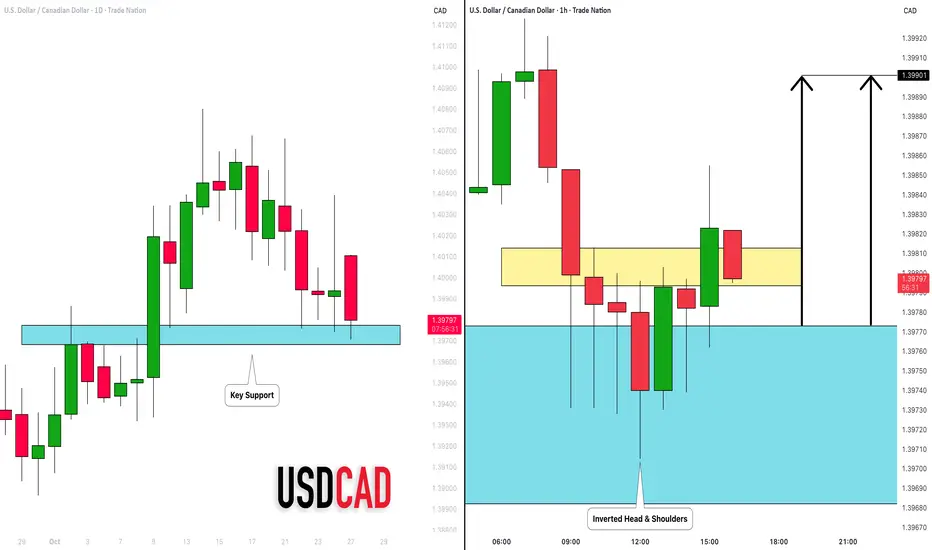
USDCAD: Pullback Trade From Support 🇺🇸🇨🇦
There is a high chance that USDCAD will pull back
from the underlined key horizontal support.
A formation of an inverted head and shoulders pattern on an hourly
time frame suggests a strong buying interest.
Goal - 1.399
❤️Please, support my work with like, thank you!❤️
I am part of Trade Nation's Influencer program and receive a monthly fee for using their TradingView charts in my analysis.
Inverse head and shouldersThe price has completed the formation of an inverse head and shoulders pattern, closing Friday above the neckline ($212), marked in blue.
The breakout occurred on very low volume, so caution is advised due to the risk of a potential reversal.
The stock has already reached a P/E ratio of 135, so I’m not attaching any long/short bias to this idea.
I recommend waiting for a pullback to retest the neckline before considering a potential long entry.

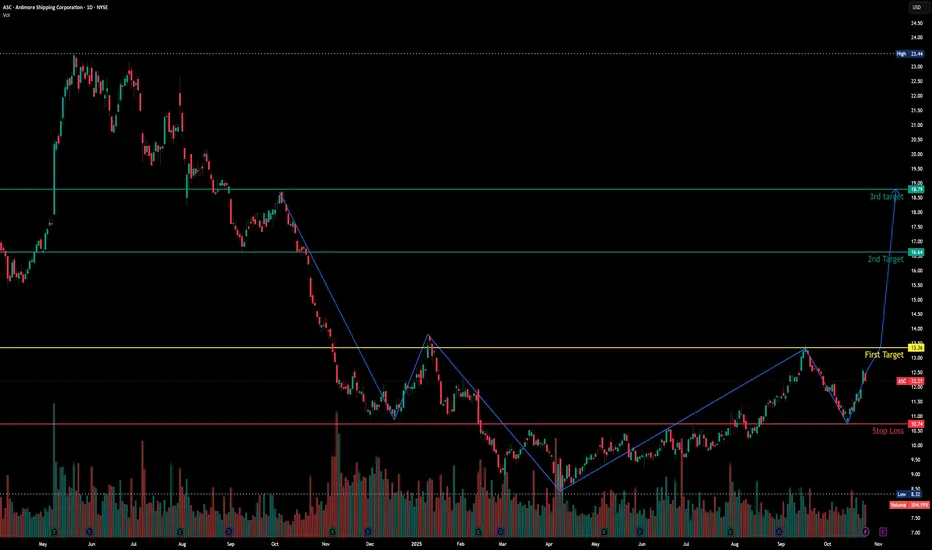
Ardmore Shipping Corp - Exciting Chart Pattern Disclaimer: This post is purely based on technical chart analysis and is not a recommendation to buy or sell. Please do your own research and consult with a financial advisor before making any investment decisions.
Last Year in May 2024, stock price was at nearly $23. from that level it fall to $8.5.
During this fall and rise, stock has made an inverted Head and Shoulder Chart Pattern.
According to my analysis , i have marked some of levels on the chart for reference.
Please share your thoughts.
Best wishes.
RAIL | Railroads on the Rise | LONGFreightCar America, Inc. is engaged in the manufacturing of railcars and railcar components. It operates through the Manufacturing and Aftermarket segments. The Manufacturing segment includes new railcar manufacturing, used railcar sales, and railcar conversions and rebodies. The Aftermarket segment deals with the selling of forged, cast and fabricated railcar parts and supplies for all railcar types, and provides aftermarket services including safety training, railcar inspections, and preventative maintenance. The firm offers freight cars including box cars, covered hoppers, open top hoppers, gondolas, intermodal, and non-intermodal flat cars that transport dry bulk and containerized freight products. The company was founded in 1901 and is headquartered in Chicago, IL.

4H H/S Bullish reversal pattern possibility [short-term]4H H/S bullish reversal patten.
If neck-line breaks, potential rise to the ~.80 area.
Similar pattern on XLM/USD & XRP/USD are forming, with a breakout on XRP/USD already confirmed.

HIMX | Launch This Semiconductor | LONGHimax Technologies, Inc. is a semiconductor solution provider dedicated to display imaging processing technologies. It operates through the Driver Integrated Circuit and Non-Driver Products segments. The company's products include display drivers, timing controllers, wafer level optics, video and display technology solutions, liquid crystal over silicon silicon, complementary metal-oxide semiconductor image sensor, and power integrated circuit. Its products used in TVs, laptops, monitors, mobile phones, tablets, digital cameras, car navigation, virtual reality (VR) devices and many other consumer electronics devices. Himax Technologies was founded by Biing Seng Wu and Jordan Wu on June 12, 2001 and is headquartered in Tainan, Taiwan.

ZECUSDT Breakdown Incoming? Don’t Get Caught Long!Yello, Paradisers! Have you been paying attention to what’s happening on ZECUSDT lately? If not, now’s the time to look closely—because the signs of an incoming bearish move are stacking up fast, and getting caught on the wrong side could be costly.
💎Right now, ZECUSDT is reacting directly from a key 4H resistance zone, and the price structure is showing some serious warning signals. We’re seeing the formation of a clear Head & Shoulders pattern, which is one of the most reliable bearish reversal setups. On top of that, there’s bearish divergence showing up—indicating that upside momentum is fading, even as price attempts to push higher.
💎This kind of setup is what experienced traders wait for. For aggressive traders, there’s already a potential short opportunity from current levels. However, if you're more conservative (as you should be in this kind of uncertain environment), it's smarter to wait for a pullback and then look for a clear bearish candlestick formation. That confirmation will not only improve the probability of success but also provide a much more favorable risk-to-reward ratio.
💎But caution is key here. If price breaks and closes above the resistance zone, this whole bearish idea becomes invalid. In that case, the best move is to stay patient and wait for clearer price action before making any decisions. Jumping in early without confirmation is what wrecks most traders.
🎖Strive for consistency, not quick profits. Treat the market as a businessman, not as a gambler.
MyCryptoParadise
iFeel the success🌴
