Could Gold Recover After Yesterday's CrashGold saw its biggest single-day drop since the infamous 2013 crash. Back then, I was inexperienced, but with some luck and perhaps a bit of reckless bravery, I managed to secure a tidy profit. Unfortunately, my more experienced self missed most of yesterday’s move :)
Now that gold has reached the double-top target near 4000, a short-term bounce could be on the way. However, volatility remains high, making gold a risky trade at the moment.
My plan is to enter around current levels, targeting a recovery toward the 61.8% retracement of the recent drop. It’s a calculated gamble, but the risk-reward ratio looks acceptable, at least for me.
Head and Shoulders

USDCHF Bearish FlagUSDCHF Bearish Idea. We may see strong bearish moves from USDCHF today. Price looking bearish from the W chart and 4hr analysis. We can see a head and shoulders pattern specifically on the 4hr chart which we can use as an entry model. Watch for US CPI at 14:30 (SAST).

Can WTI’s 8% Rally Hold After Trump-Putin Summit Collapse?WTI just staged its biggest two-day rally since June, as hopes for a Trump-Putin summit were dashed, leading to new US sanctions on Russian oil exports.
Here’s what’s fuelling the move and what traders should watch next:
- US sanctions on Russia’s top oil producers after failed Budapest summit trigger supply fears and spike prices
- Trump escalates rhetoric to maintain leverage as Zelensky signs military deals with Sweden, raising geopolitical stakes
- WTI reclaims key $61 resistance, with daily RSI momentum signalling room to run and a possible cup & handle breakout toward $68
- Supply glitch fears (India, OPEC’s slow reaction) and technicals all support continued upside if the current environment holds
Watch for buy the dip signals, respect $61 support, and target the $65–68 channel top if current drivers persist.
Stay tuned!
This content is not directed to residents of the EU or UK. Any opinions, news, research, analyses, prices or other information contained on this website is provided as general market commentary and does not constitute investment advice. ThinkMarkets will not accept liability for any loss or damage including, without limitation, to any loss of profit which may arise directly or indirectly from use of or reliance on such information.

GBPNZD: Pullback From Trend Line 🇬🇧🇳🇿
GBPNZD may bounce from a strong rising trend line on a daily.
The price formed an inverted head and shoulders after its test
and violated its neckline this morning.
I expect a pullback to 2.3215
❤️Please, support my work with like, thank you!❤️
I am part of Trade Nation's Influencer program and receive a monthly fee for using their TradingView charts in my analysis.

ETH 1h chartCRYPTOCAP:ETH 1H Chart
Ethereum showing a clear market structure shift.
After a liquidity grab and CHoCH, price respected the 1H FVG and confirmed a bullish BOS, signaling potential continuation to the upside.
If price maintains above the FVG zone, ETH could look for higher targets in the short term.
#ETH #Ethereum #Crypto #PriceAction

Coinbase Bearish H/S possibilityWould like to start off by saying that I am long-term bullish on Coinbase and Crypto, in general.
Only looking for opportunities to make $$$.
IDEA ~ in the short term; a similar H/S pattern similar to the one in July
- if 300SMA is taken then my PT = ~250

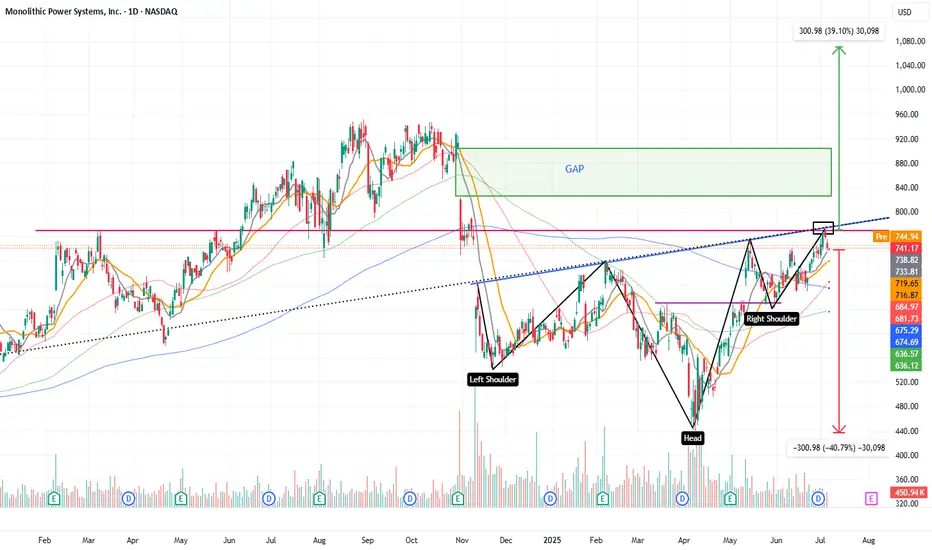
Inverse head and shoulders with a gap to close towards 1070$The price is completing the formation of an inverse head and shoulders pattern, with a head-to-neckline distance of approximately $300.
This suggests a potential breakout target around $1070.
Along the way, there is also a significant gap that has remained unfilled for several months.
The stock belongs to a company that manufactures power management chips used in all types of electronic devices, with steadily growing revenue
SILVER | Head & Shoulder Breakdown After All-Time HighAfter reaching a new all-time high, #SILVER seems ready for a healthy correction before the next bullish rally.
🔹 On the 1H timeframe, price has clearly formed a Head & Shoulder pattern.
🔹 The neckline has been broken, confirming the start of a bearish move.
🔹 This indicates a possible short-term correction phase before bulls take control again.
Trade Idea:
Taking a short position at CMP with strict risk management looks favorable.
Potential targets: near recent support levels.
Stop loss: above the right shoulder.
Always wait for candle confirmation and use proper position sizing.
What’s your view — will #Silver continue the correction or bounce back soon?
Comment your thoughts below and don’t forget to like, follow, and share if you find this analysis helpful!
#Silver #XAGUSD #HeadAndShoulders #ChartAnalysis #TechnicalAnalysis #PriceAction #TradingSetup #Commodities #Forex #Metals #SwingTrade #DayTrading #TradeIdeas #BearishSetup #RiskManagement #TradingCommunity #MarketAnalysis #TradersLife #TrendReversal


CORN BULLUsing daily market structure and an H4 pattern, alongside, daily CVD divergence I'm convinced corn breaks up towards 4.5 and beyond. THE BIGGER PICTURE which i will show below shows a rather large bullish bat harmonic. I have been long corn from below 3.8. Jump on don't miss the commodity super show.

AICUSDT can fall to 0.21$ ASAP some correction is needed Our technical analysis indicates the potential development of a Head and Shoulders reversal pattern on the chart. This is a classical technical formation that often signals a trend exhaustion and a potential bearish reversal.
The critical level to monitor is the pattern's neckline support. A confirmed breakdown, characterized by a decisive daily close below this neckline with accompanying volume, would validate the pattern and complete the reversal signal.
Upon a successful breakdown, the measured move target derived from the Head and Shoulders pattern projects a significant downward move toward the $0.20 level. This would represent a substantial correction from the current price and aligns with the typical price objective calculation for this formation. Traders should manage risk accordingly, as a break below the neckline often triggers accelerated selling pressure.
DISCLAIMER: ((trade based on your own decision))
<<press like👍 if you enjoy💚

XAU/USD🪙Gold dropped over 6% on October 21 due to profit-taking and a stronger dollar, but this pullback is healthy after a 60% rally in 2025. At $4,050, the market is likely executing a liquidity grab before resuming its bullish trend toward new highs.🪙
---
📈 Gold Trade Idea – Liquidity Grab Before New Highs📈
Gold experienced a sharp correction on October 21, falling over 6% from its all-time high of $4,382 to around $4,100, marking its largest single-day drop since 2013. This move was driven by profit-taking after an extraordinary rally, alongside a stronger US dollar, improved risk sentiment, and optimism over US-China trade talks.
Despite the volatility, this pullback is not a trend reversal—it’s a healthy correction following a 60% surge in gold prices this year, fueled by economic uncertainty, central bank accumulation, and expectations of interest rate cuts.
Currently, gold is trading around $4,050, a key zone where I anticipate a liquidity grab. This level likely holds clustered stop-losses from late buyers and short-term traders. Once this liquidity is absorbed, I expect gold to resume its bullish momentum, targeting new highs above $4,400.
### 🔍 Why Gold Is Still Bullish:
- Macro uncertainty remains elevated, keeping demand for safe-haven assets strong.
- Central banks continue to accumulate gold, supporting long-term demand.
- Rate cut expectations from the Fed and other central banks reduce opportunity cost for holding gold.
- Technical structure shows a classic retracement after a parabolic move—ideal for continuation setups.
This correction is a textbook example of market mechanics: after a euphoric rally, the market shakes out weak hands before continuing higher. I’m watching for confirmation of support around $4,050 and signs of absorption before entering long.

Gold Retest of a Daily Demand and Inverse H&S on M15 TFPrice has pulled back to a daily demand zone and there is an entry confirmation pattern on the M15 TF.
As long as the demand zone holds, the bulls will take over. Your position size should be determined by your entry and SL.
Good Luck folks.

XAGUSD formed a head and shoulders patternOn the 4-hour chart, XAGUSD has formed a head-and-shoulders pattern. Currently, attention should be paid to resistance near 50.6. If a rebound encounters resistance, consider continuing to sell. Support is expected near 47.5, and if it falls below, further support is expected near 45.7. If the price of XAGUSD breaks back above 52.8, the bullish trend will resume.

ETHEREUM (ETH/USD): Comeback? Eyes on $4300 Resistance.ETHEREUM appears to be showing some bullish signals following a test of a significant daily support level.
The price formed an inverted head and shoulders pattern on that, succeeded by a bullish breakout above its neckline, which is serving as a minor resistance, thereby confirming a local change of character.
Considering these factors, there is a possibility that the price of the coin could potentially rise to the $4300 level.

THIRD POSITIION ON SCRTUSDTLet's see how my third position play out. Higher high or lower high? Market leads, I follow

CRUDE OIL "3 Heads Monster"Could this 3 Heads & Shoulders come to live ?
Built in "Close Price Line Chart" (Candle = Same formation)
Small (black) H&S Target @ 59.34
Medium (orange) H&S Target @ 44.32
Large (blue) H&S Target @ 10.29

ETHUSDT: Head And Shoulders Pattern, Price Targets! $3,676Hi everyone,
Lets grasp a sight on ETHUSDT, we can clearly notice that Ethereum have lately concluded the head and shoulders pattern setup. the price have been ranging for some few hours after touching the neckline region, presently we are expecting a breakdown below this region.
Meanwhile a confirmed breakout from the neckline region would activate a downside movement with momentum aim for $3,676.
Like and follow up,
Thanks for reading.

Buyers are likely to step into AUDNZD at this levelThis Head and shoulder pattern formed on this key level could potentially reveal the interest of buyers at this daily key level.
Let's watch and see

EURAUDGot rejected at daily resistance.
H4/H1 has given a head and shoulder with neckline broken, retest has been made with H4 rejecting with a bearish engulfing candle. Targeting daily support since we're in a daily range.

GBP/AUD: Downward movement is Expected!The 📉GBPAUD price formed a head and shoulders pattern, and its neckline was breached yesterday on a 4-hour time frame.
A retest is currently underway.
It seems highly probable that the price will continue to decline, potentially reaching the 2.0500 level in the near future.

AUDJPYDaily support zone of 97.000 help up once again. H4 & H1 are showing an inverse head and shoulder pattern. Waiting for clear breakout of neckline with possible retest to look for buys. If we get a clear break above 99.400, 100.500 could be second target. For now, we watch and wait.
(NZDJPY has a similar setting but AUDJPY shows a nice upward movement on the daily TF)

ETH USD HEAD AND SHOULDER PATTERNBear pattern on ETH
Look to retrace lower look for continuation before medium term outlook
