▒H▒ HEDERA FORECAST | 6HR ▒H▒
CRYPTOCAP:HBAR
Someone was screaming about HBAR in the Cryptocurrency chat so I took a look. I am not trading this nor other ALTS. I may with a tiny amount of money here and there. I fundamentally and strongly believe in BTC and BTC only as the King. With that being said I do realize there is a need for utility based (non-meme coins). I would never trade a coin that I was not fine with losing all of the money involved (which will only be a little in these situations) or being stuck holding it for 5+ years. Which is why I will always be a Bitcoin Maximalist.
This is my forecast showing an HBAR low of $0.14 in early Oct.
============================================
An Introduction to Hedera (HBAR)
Often called the "trust layer of the internet," Hedera is a public network designed for the decentralized economy, but with a unique architecture that sets it apart from traditional blockchains.
At its core, Hedera is not built on a blockchain. Instead, it utilizes a patented consensus algorithm called Hashgraph, a type of Directed Acyclic Graph (DAG). This technology allows for incredibly high throughput (10,000+ transactions per second), near real-time finality, and the highest grade of security (aBFT), all while maintaining fair ordering of transactions and stable, low-cost fees.
What truly distinguishes Hedera is its governance model. The network is owned and overseen by the Hedera Governing Council, a rotating body of world-leading, term-limited organizations such as Google, IBM, Boeing, Dell, and LG. This model is designed to provide stable and reliable decentralized governance, ensuring the network will never fork and can be trusted by enterprises for mission-critical applications.
The native token, HBAR, serves two primary functions: it acts as fuel to pay for network services like smart contracts and transactions, and it is used to secure the network through staking.
In summary, Hedera is engineered from the ground up for mainstream, enterprise-grade adoption, prioritizing performance, security, and stable governance to power real-world decentralized applications.
I WILL BE POSTING FORECASTS FROM THE TOP TRADED ALTS IN ADDITION TO MY REGULAR BITCOIN POSTS.
COINBASE:ETHUSD
COINBASE:XRPUSD
BINANCE:BNBUSD
COINBASE:SOLUSD
COINBASE:DOGEUSDC
COINBASE:SOLUSD
CAPITALCOM:ADAUSD
COINBASE:LINKUSDC.P
DISCLAIMER
I AM NOT A FINACIAL ADVISOR, NOR AM I YOURS. THIS IS NOT FINANCIAL ADVICE. MEARLY DOODLINGS ON A MATHMATICALLY DRIVEN GRAPHICAL INTERFACE, TRACKING AN INVISIBLE 256BIT MILITARY-GRADE ENCRYPTED ASSET. . . FOR ENTERTAINMENT/AMUSEMENT PUROSES ONLY. ENJOY!
Hedera

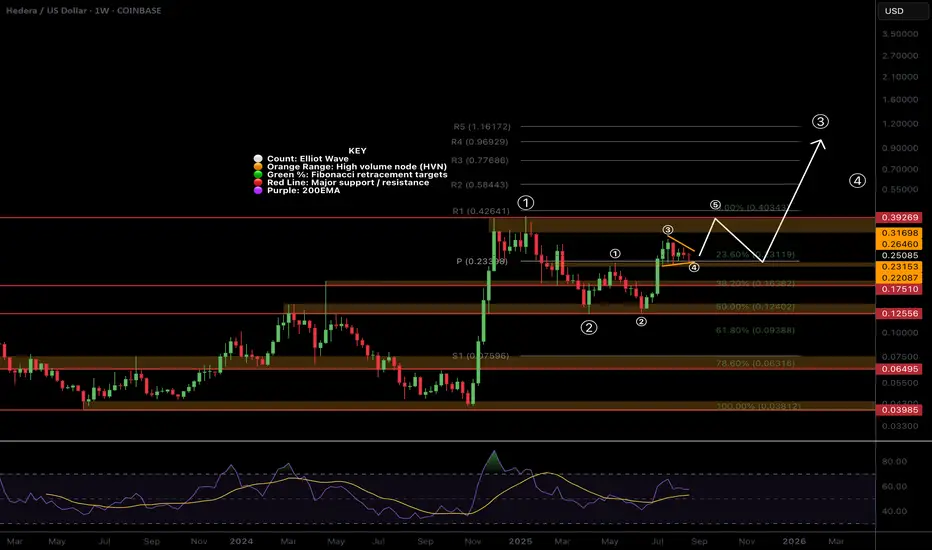
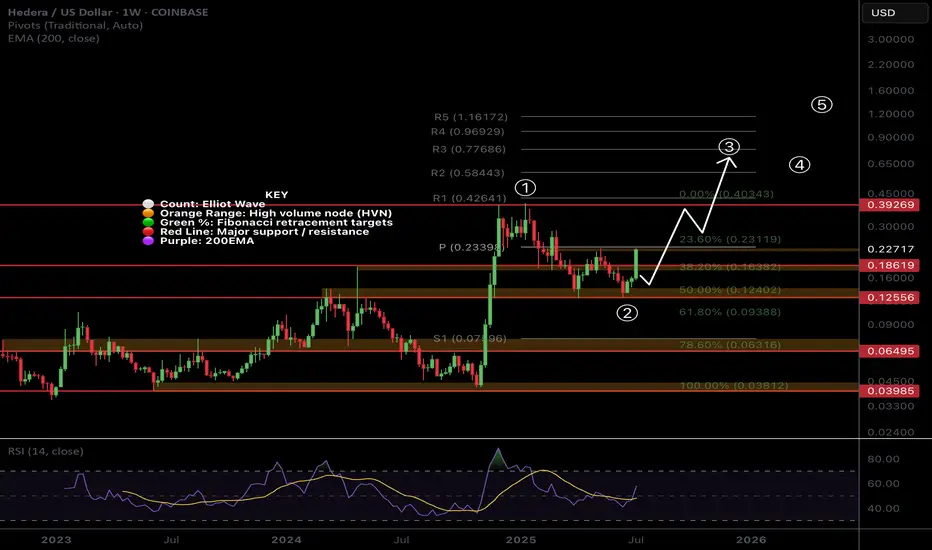
$HBAR Macro Chart - Ready for wave 5 of (1) of 3 up?CRYPTOCAP:HBAR appears to be printing a wave 4 triangle above the weekly pivot point. This implies the next move would be a terminal wave (5) of 1 of (3) likely completing with a poke above all time high to trap FOMO novice investor / traders. Classic Elliot Wave.
Wave 2 of (3) has a high probability of ending at the wave 4 triangle base which is the weekly pivot and 0.236 Fibonacci retracement adding confluence. This fib level support would indicating continued trend strength.
If it is a wave 1 of (3) is completing then we can expect the long term target to overextend the weekly R5 pivot point of $1.16, possibly reaching $3.
Weekly RSI remains at the EQ so plenty of room to grow.
Analysis is invalidated below the weekly pivot.
Safe trading
Hbar is forming a tradable structureBAR is printing many tradable structures on major timeframes. The current one is the possible bull flag with a great RR. Keeping in mind that the daily momentum and trend are still showing negative pressure. Keep your POI hand as the PA unfolds.

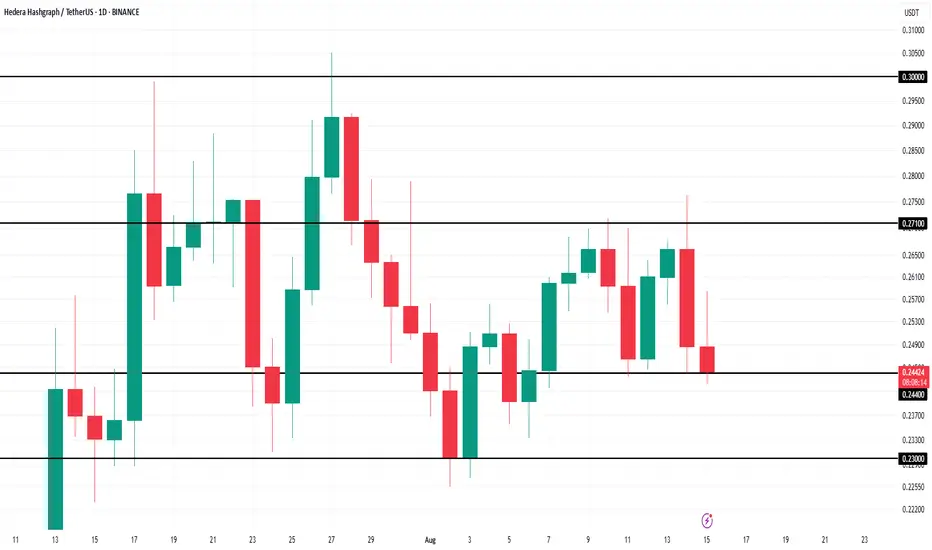
HBAR Eyes Bitcoin for Price Recovery Amid Market UncertaintyBINANCE:HBARUSDT is currently consolidating, trading at $0.255 while oscillating between $0.271 and $0.244 . The narrow range reflects investor caution, with traders awaiting external market cues. Without a decisive breakout, the altcoin may continue drifting sideways in the immediate term.
If Bitcoin strengthens and resumes its rally, BINANCE:HBARUSDT could break resistance at $0.271. Such a move may open the door for gains toward $0.291, with potential upside extending further if bullish conditions persist.
Alternatively, a Bitcoin downturn could drag BINANCE:HBARUSDT lower, pushing it beneath $0.244 support. In such a scenario, the altcoin risks falling to $0.230, undermining the bullish thesis and reinforcing caution among investors.

HBAR Price Stalls as Outflows Hit 2-Month High—What’s Next?BINANCE:HBARUSDT price is currently at $0.243 , trapped within the range of $0.244 to $0.271. The mixed market cues, including the bearish CMF and the relatively neutral RSI, suggest that HBAR could continue consolidating.
This sideways movement is expected to persist unless there is a major shift in investor sentiment or a market catalyst that could push the altcoin in either direction.
If outflows intensify and BINANCE:HBARUSDT falls below its $0.244 support level , the bearish case could become more likely. In such a scenario, the price may drop further to $0.230, invalidating the current bullish-neutral outlook and signaling a deeper correction for HBAR.
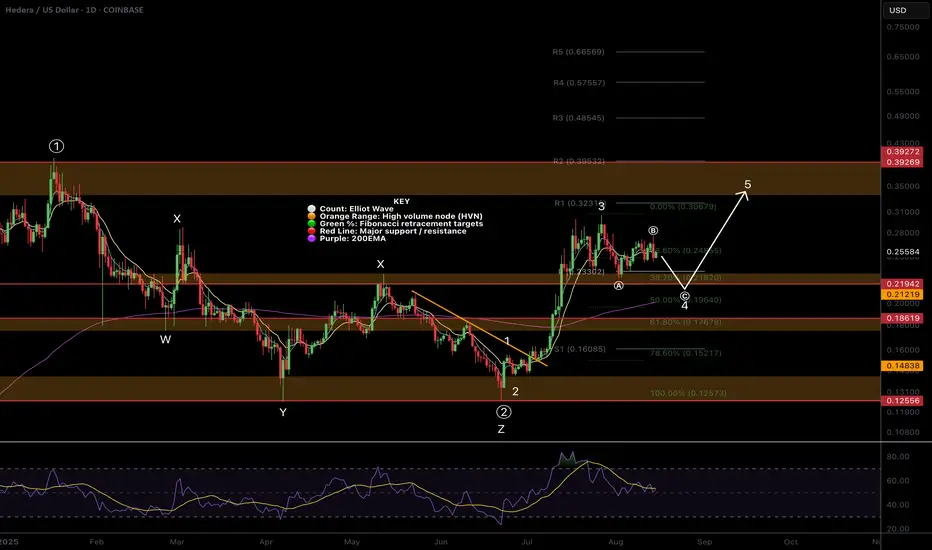
$HBAR Printing an ABC in wave 4?Wave C of an ABC correction in wave 4 appears to be underway in CRYPTOCAP:HBAR
This would see price have a quick drop below the daily pivot testing the major support High Volume Node and rising daily 200EMA as support before continuing up in wave 5. This is also the .382-.5 Fibonacci retracement a typical area for wave 4 to end per Elliot wave rules. Lots of confluence in this area.
RSI is still making its way down from overbought. Investor psychology is still irrationally bullish giving opportunity for professional traders to make some volatility bucks.
Analysis is invalidated if price breaks $0.273 upgrading the count to wave 4 completing at the current wave (a) bottom.
Safe trading
Hedera (HBAR): Looks Good For Another 15% Upside MoveAnother BOS that caught our attention happened on HBAR coin, where recently after the local breakout we are seeing a smaller struggle, which might send the price back for a quick retest, where we will be sitting in one of our entry zones. forlong position.
The second one is the other green line, which would mean. we form another BOS (on top of the current BOS). Seems good so as long as we are above the 4 hr 200 EMA, we are bullish!
Swallow Academy


HBAR Momentum Hbar has gained some momentum lately. This is the ideal rally setup.
It has also yet to see real price discovery past .5
Large trade already opened.
DYOR, I believe this coin has a ton of potential.
Hederas' Council consists of entities like Google, IBM, Boeing Through VentureX, Standard bank.. Just to name a few.
But you all don't care about that.

Hedera 2025 All-Time High · Simple Analysis Bullish ConfirmedHedera is about to close five weeks green. Five weeks green and we only have a minor advance, relatively speaking. Some 100%. Back in late 2024 five weeks green resulted in more than 800% growth. Huge difference, but after the fifth week growth stopped. This time it will be different.
We already have five weeks of bullish action and this is only portion of the entire bullish period, just a small part. This can continue for months, then a stop and one final jump. Or this can start now and just keep on going until it peaks and that's it, nor more growth until the next bullish phase. So we would see a bear market after the completion of the bull market and the only bullish action would be corrections within the bear market. Right now market conditions are extremely bullish.
We have a long-term lower high. In early 2025 the action peaked below the 2021 all-time high. The wave that is developing now will break this barrier and produce a new all-time high. This is very easy to predict, market conditions are bullish.
The interesting part will be to see how far up Hedera will go. We can use this project, since it is definitely going to be one of the first to peak, to know how the rest of the market will perform. Easy we have between 200% and 400% potential for growth.
I hope you are being entertained and I really hope you enjoy the content. If you do, give me a follow @MasterAnanda
Namaste.

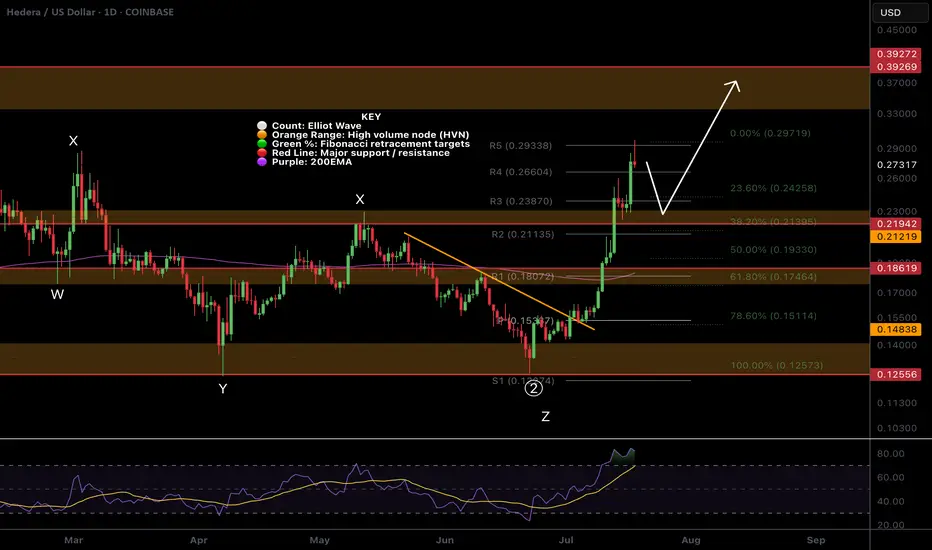
$HBAR Wave 4 finishing soon?CRYPTOCAP:HBAR Hedera appears to have completed wave 4 with the test of the High Volume Node support at the 0.382 Fibonacci retracement.
Wave 5 has an expected target of the High Volume Node resistance at $0.4 before a larger retracement in wave 2 aligning with my summer pump august / September dump view.
Analysis is invalidated below $0.1933 at the 0.5 Fib retracement and will be updated to a wave 2 instead of 4.
Safe trading

Hedera Update · Keep Holding · No Selling, YetHedera (HBAR) looks awesome. The action and chart right now is one of the best in the market. I love the fact that the candles are moving straight up. This can be equated to how FUN Token (FUN) has been performing in the past month. What one does, the rest follows.
The most interesting signal comes from MA200. Trading is happening above this level and that's all we need to know. When HBARUSDT broke above it, any bullish potential and bullish signals become fully confirmed. It is not a question of "if" anymore but instead a done deal. Growth is expected to happen for a period ranging between 3-6 months once this signal shows up.
This means you can see a strong retrace in a month and still, you remain calm and hold because you know higher prices are still possible. This means that if you see a correction after three months, you can take profits of course but still know that the top is not in. It will take a while before the entire bullish process is complete.
The top is not only calculated based on time duration but also on price levels and marketwide action. Depending on how the rest of the market is doing; looking at Bitcoin and at what price the pair in question is trading can help us confirm if the top is in. For now you just keep on holding.
Each chart/project/pair needs to be considered individually. If your technical analysis ability is lacking, you can always contact me and I will publish an update for you. If you publish news articles, videos, trade-signals or even TA, you can come to me for confirmation, ideas or just inspiration and I will take care of the rest. Once you have your update you can decide what actions to take. It is still early in this game.
The initial portion of the bull market is long gone. Here it started in November 2024, you can see it as the "market bottom." We are on the second portion now in 2025. The year started with a correction and the correction ended in April-June with a very strong higher low. Projects like this one reveal super-strength compared to the rest of the market, it happens with the top 100.
If you consider some of the smaller projects I've been sharing, you see double-bottoms compared to 2024, 2023 and even 2022 and even new all-time lows. Here the low in 2025 is far away from November 2024 and this is good news. That is why I say that each chart/pair needs to be considered individually because conditions are not the same for each project. The market has now thousands of good projects and tens of thousands of trading pairs. It is impossible to say how one will move based on the other because they are just too many and too far away.
The bigger picture and the general bias, yes, bullish all across. Exact resistance and support levels, where to sell, where to buy; should I continue to hold? This is what needs to be considered individually.
Your support is appreciated.
If you enjoyed, please follow.
Namaste.

$HBAR Pull Back Started, What is the target?CRYPTOCAP:HBAR doing extremely well, the R5 daily pivot point has been hit and a pull back should be expected before continuation!
It appears wave 3 is now complete and wav4 i expected to pull back to the 0.382 Fibonacci retracement which adds confluence to the High Volume Node in the same place at $0.22 our previous take profit #2 target.
Daily RSI is overbought but no bearish divergence yet! Price behaviour can often pop above the swing high just made to trap new buyers before dumping hard! Watch out for that, that would be the bearish divergence print also.
The next take profit is $0.39
Safe trading
Hbar breaking upwar from fallingwedge/pennantAlso in a smaller double bottom setup here. *not financial advice*

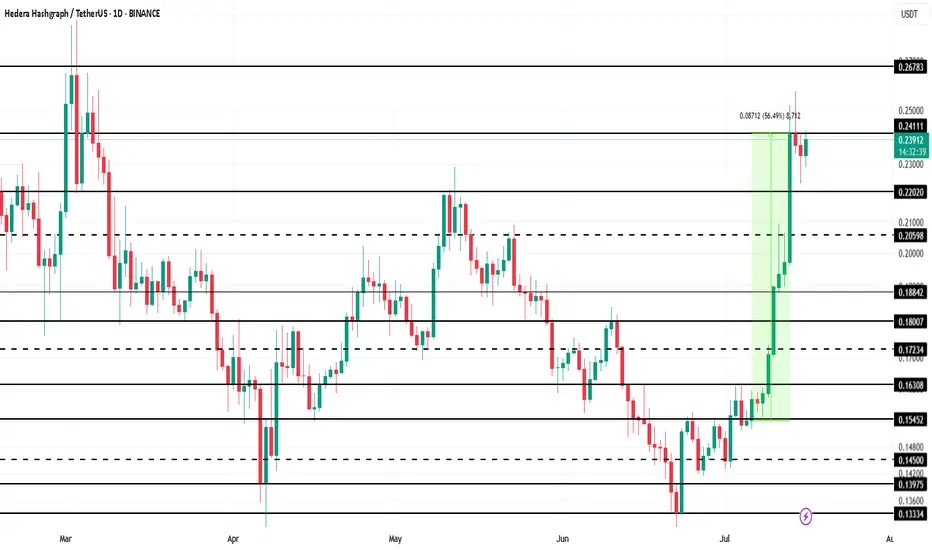
HBAR Price Drop To $0.20 Likely; $53 Million Liquidation AheadBINANCE:HBARUSDT price currently sits at $0.235, encountering resistance at $0.241. Despite its recent rally, the broader market conditions are pulling it down, and the next major support level is at $0.220 . If the altcoin fails to hold above this level, it could slide towards $0.200.
Looking at the liquidation map, there is a real possibility of significant losses for $BINANCE:HBARUSDTtraders. The map shows that if the price drops to $0.20 or lower, approximately $53 million worth of long positions would be liquidated . This would create a wave of selling pressure and potentially drive the price down further.
In the event of a surge in bearish sentiment or increased selling pressure, BINANCE:HBARUSDT could fall below $0.220 , hitting the psychological support level at $0.200. A drop below this critical level would likely trigger the $53 million worth of liquidations, further exacerbating the decline.
However, if BINANCE:HBARUSDT manages to hold above $0.220 and successfully breaches the $0.241 resistance, there could be an opportunity for a rally. A successful bounce off $0.220 could push HBAR towards $0.267 , providing some relief to traders and reinforcing its bullish outlook.
I have been waiting to get my signal on HBAR and finally got it!Trading Fam,
I know my crypto portfolio is getting destroyed as I prepare for a future altcoin run towards the latter half of this year. And it sucks. Bitcoin hodl'ers definitely look like the true champions at this point outpacing us altcoin traders by a huge margin. However, I've been through this before. Multiple times. And I know that when they run, altcoins will more than make up for our losses and pay massive dividends. We simply have to remain patient and stick to our strategy which is to continue to look for those great entries into some of our larger cap altcoins. So, that is what I'll do until one of two things occurs: A) either my portfolio dies completely or B) I am able to prove that altcoin traders can eventually beat the Bitcoin hodl'ers. It will be option "B". That's my final answer.
You get to watch all this unfold. And fortunately for you, I am the guinea pig. If you want to join me in these trades, you have that option. If you want to sit by and watch this entertainment, which admittedly hasn't been pretty as of late, you can do that too. But, in my heart of hearts, I believe our strategy will eventually pay off.
With that said, I've long been waiting for my indicator to give me the signal on this outstanding altcoin, HBAR. I mean, it's been months. The last time it flashed green for me we went from 12 cents to 24 cents. Unfortunately, my cash reserves were locked up in other trades. Today is different.
I've entered this trade at around 15 cents. My first target will be 17 cents. My final target will be 23 cents giving us more than 50% profit if achieved.
On the technical side, you can see that we have entered a beautiful area of large liquidity. This is where buyers typically step in. My bet is that they will do so again to break us to the upside of that descending trendline taking us at least to our VRVP point of control on this chart (yellow line).
I know that it is not easy trading alts in this volatile political/geopolitical global environment we have somehow sadly inherited. But I have to remain optimistic that the collective good in man will eventually prevail over the corrupt and mostly misanthropic characters we call "leaders". Once these tides begin to shift and show, massive energy will propel us onward and upward into the future. I believe cryptocurrency will help in this shift. What we will then witness will be like nothing we've seen before. This remains my hope as I continue to tread these perilous trading waters.
✌️ Stew

$HBAR Weekly Pivot Time...In classic CRYPTOCAP:HBAR fashion what a powerful move this week! Moves like this leave me skeptical of continuation straight away as you often get a pretty decent pullback afterwards before the next leg up. However how many times have you seen a move like this that completely unwinds weeks later and goes lower?
Wave (3) looks truly underway after wave (2) tested the High Volume Node and 'Golden Pocket' 0.50.618 Fibonacci retracement as support on weekly bullish divergence from the RSI.
The weekly pivot is now resistance and it already proving itself. If price continues the all time high is next resistance and price has a weekly R5 pivot target of $1.2 while the Fibonacci extension targets have a minimum of $5.2..
Analysis is invalidated below $0.12
Safe trading

Hedera: How To Catch The Altcoin That Will Move NextWhich one is going to move next? That's the question and here is the answer: Look for those with a confirmed bullish setup.
There are hundreds and hundreds of trading pairs. We go by the saying, "everything will grow." But not everything grows the same day nor at the same time. So which ones are the ones more likely to move next?
Here is a simple example: HBARUSDT.
Hedera is trading daily above EMA55, EMA89 and EMA233. While it has already five days green, this one is more likely to move next vs others that are trading below those moving averages. That is what I mean by a confirmed bullish setup.
You can also use MA200 and other indicators such as the RSI and MACD. For example, if the action is happening above a strong Fib. level, this can also be of value. If the RSI is very strong compared to other pairs, this is also good. The more strong bullish signals combined the higher your chances of finding the right one.
My suggestion?
Do not try to catch the next big move. It is better to develop a plan, find the pairs that fit your criteria then buy and hold. Chasing pairs can turn into blind gambling game. It is better to trade on a plan focused on the long-term.
Thank you for reading.
Namaste.

TradeCityPro | HBAR Rebounds Sharply After Trendline Breakout👋 Welcome to TradeCity Pro!
In this analysis, I’m going to review the HBAR coin for you—one of the RWA and Layer1 crypto projects, currently ranked 16 on CoinMarketCap with a market cap of 9.95 billion dollars.
📅 Daily Timeframe
On the daily chart, as you can see, after a bullish rally toward the end of 2024, HBAR entered a corrective phase and is currently still in this correction.
✨ A major support zone (highlighted on the chart) was established, and a range box was formed between this zone and 0.21765 where price had been consolidating.
💥 There was also a descending trendline within this box that the price recently broke through, triggering strong bullish momentum. The price has now even broken above the 0.21765 level.
✔️ A significant increase in buying volume has entered the market, and with RSI entering the Overbuy zone, this move looks poised to continue even more sharply.
🔔 If this bullish momentum persists, the next targets are 0.26221 and 0.38402. If you already have an open position, these levels could be suitable for partial profit-taking.
🛒 If you're looking to buy this coin in spot, the breakout and confirmation above 0.21765 is a decent entry. However, the current stop-loss range is quite wide, so reaching a good risk-to-reward ratio might take longer with this trigger.
📈 The next potential spot triggers are 0.26221 and 0.38402. A breakout above 0.38402 would likely signal the start of a new major bullish leg.
📝 Final Thoughts
This analysis reflects our opinions and is not financial advice.
Share your thoughts in the comments, and don’t forget to share this analysis with your friends! ❤️

$HBAR Shooting Up in Wave 3CRYPTOCAP:HBAR is flying off the High Volume Node and 0.5 Fibonacci retracement with Elliot wave 3 characteristics keeping the count alive.
Price is testing the weekly pivot point which should act as resistance for the time being but a break straight through will demonstrate a very bullish trend. Traders should be cautious about entering here.
RSI confirmed a weekly bullish divergence
Safe Trading
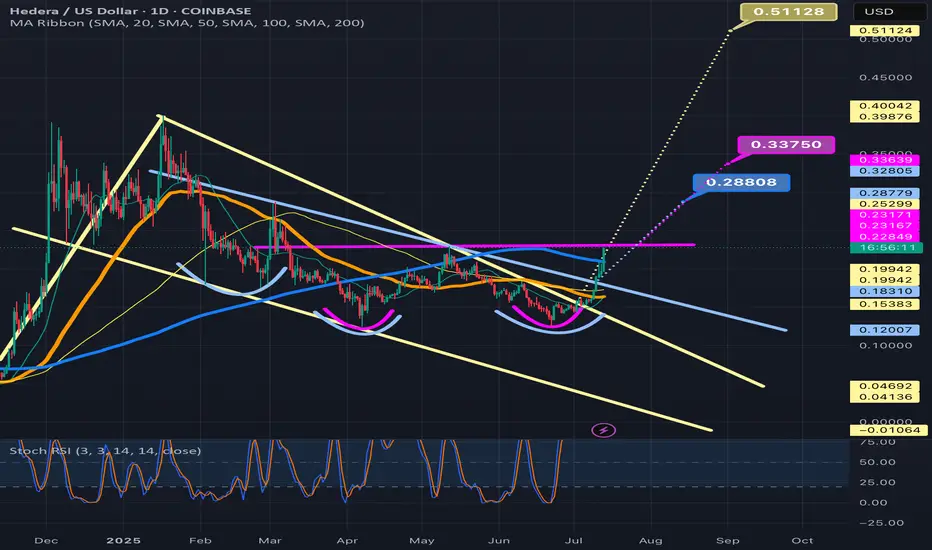
A linear Chart version of the current HBAR bull patternsIt just dawned on me that I had my chart on logarithmic for the previous 2 posts I amde about HBARUSD. As usual, the chart patterns on the log chart tend to have much higher breakout targets than the version of the chart patterns that appear on the linear chart. As soon as I realized this I went back in and adjusted the patterns to their linear chart erosions. The inverse head and shoulders remained mostly the same but the bullflag/desceding channel has now morphed into a falling wedge/bullish pennant. As you can see the breakout target for all 3 patterns is a much lower price than what the price targets were on the logarithmic chart. That’s not to say that the logarithmic targets are invalid, I think what will most likely occur Ike usually is both chart’s targets will be validated, it will likely just take much longer for the logarithmic chart’s targets to be reached as is how things usually pan out. *not financial advice*
Weekly timeframe version of previous HBARUSD postWanted to show my previous hbar idea which was on the daily time frame on the weekly as well so I could fit the pole of the bullflag in the frame here. I will put a link below to my daily time frame version of this post which goes into slight more detail about each pattern and also the Nvidia hbar news. *not financial advice*

HBARUSD has 3 bullish patterns stacked on top of eachotherThe inverse head and shoulders in the light blue, the light tan is the bull flag, and the pink is the double bottom. Currently price is above the Bullflag and the Inverse head and shoulders pattern. The bullflag also counts as a descending channel pattern as well. We just recently retested the neckline of the inverse head and shoulders as exact wick support which is a good sign. All 3 should provide eachother with the bullish confluence needed for them to be validated, but in addition to this technical bullishness we have some fundamental bullishness occurring just recently too as NVIDIA just announced their new Blackwell chips — claiming them to be the future backbone of AI infrastructure — which are integrating verifiable compute which has its fundamental trust layer built on Hedera. This also provides great bullish confluence and heightens the probability these 3 chart patterns will all be validated and reach their full targets. I will keep updating this post as they do so. *not financial advice*
