Instructions on how to potentially use the SIG[TP/SL (1H-4H-1D)]It's a HF algorithm for the 1H,4H,1D Time-Frames. Which means whenever the instrument reaches the open price, the algo might give a lot of signals and sometimes it might give plenty of reverse signals. In order to use the specific algo in the best possible way, here's a helpful guide on how to potentially use it:
1)Wait for the instrument to reach the open price.
2) ALWAYS, Follow the signals, e.g: We are at the open price. If it indicates buy signal, then open a long position. If for example 5 seconds later (again at the open price) it indicates a sell signal, then reverse the long position into a short position, and keep doing it until it gives a signal, that will be followed by a good sized candle.
3) The safest way is to close the trade when the price reaches the potential TP1.
4) Happy Trading!
*The text above is not an investment advice, and it does not guarantee any profit.
HFT

Hashflow Hits Bottom... Notice The Waves... The Large Bull RunNotice the waves... It all starts in January 2023 with a strong advance. 243% total growth. Mid-February 2023 we have a price peak and this signals the start of a bearish trend. Notice the waves...
It all starts with a large wave. As the downtrend unravels, the waves become smaller. Then we have a medium wave and finally a small wave.
As the market hits bottom, you guessed it, 7-April 2025, there is a very strong increase in trading volume. This uptick in volume signals that the bottom is in. Once the bottom is in we can prepare for a change of trend. Long-term growth.
Now we will have the same dynamics but in reverse. First a small wave... The initial bullish breakout. Then a medium wave and finally a large wave which is the end and the bull run.
Namaste.

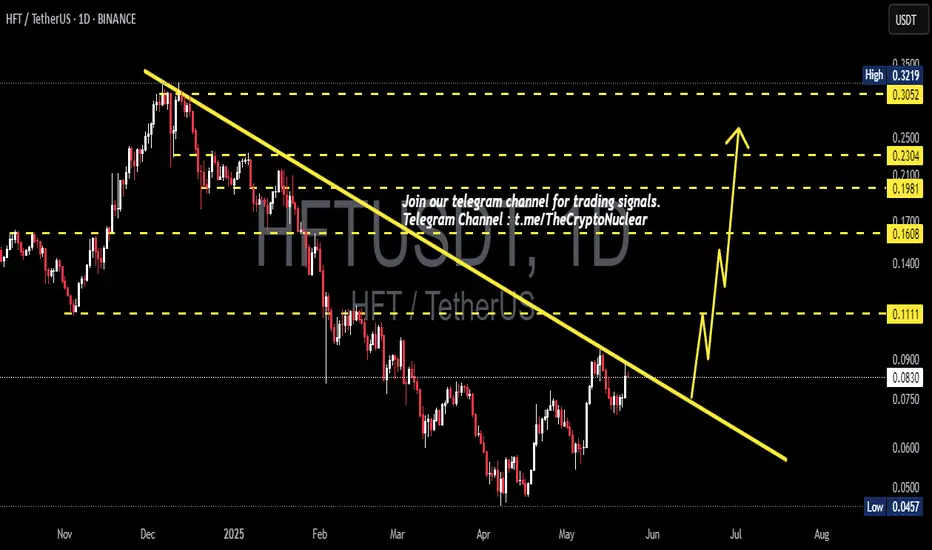
HFTUSDT 1D AnalysisHFT ~ 1D Analysis
#HFT Buy after successfully breaking through this resistance line if you still have confidence in this coin with a short-term target of at least 10%+.
High-Frequency Trading (HFT) in Forex and StocksHigh-Frequency Trading (HFT) in Forex and Stocks
High-Frequency Trading (HFT) has garnered significant attention due to its transformative impact on markets, reshaping the way they operate, influencing liquidity, price discovery, and overall efficiency. In this FXOpen article, we focus on high frequency forex and stock trading, its definition and its specific applications, pointing out the opportunities and challenges that this trading method presents.
High-Frequency Trading: An In-Depth Analysis
High-frequency trading represents a dynamic and swiftly evolving facet of the financial world. Understanding the basic HFT concept can help traders develop and employ advanced trading strategies.
Definition
At its essence, high-frequency trading is characterised by the swift execution of a substantial number of orders within exceptionally brief time intervals, often measured in milliseconds or microseconds. Traders engaged in HFT within the market leverage robust algorithms and state-of-the-art technology to scrutinise extensive sets of market data, facilitating swift and informed trading decisions. At the heart of HFT is its ability to harness even the slightest price differentials, allowing traders to take advantage of market inefficiencies that may elude traditional counterparts.
Key Features
The key attributes of high-frequency trading encompass remarkable speed, elevated order-to-trade ratios, and a dedicated focus on exploiting short-term fluctuations in the market. The primary objective is to execute a considerable volume of orders with precision, enabling traders to capitalise on momentary opportunities. This approach aligns with the broader domain of algorithmic trading, where pre-programmed instructions are believed to guide strategic decision-making for potentially efficient market participation.
HFT isn’t very common for retail traders. Usually, it’s done by institutional investors as this method requires significant funds and advanced software.
Strategies Employed in HFT Forex and Stock Trading
High-frequency trading encompasses a variety of strategies, each designed to exploit specific market conditions.
- Market Making involves the continuous quoting of buy and sell prices for currency pairs and stocks. HFT investors aim to capture the bid-ask spread swiftly, contributing to market liquidity. By providing liquidity, market makers facilitate seamless transactions on HFT trading platforms and play a crucial role in the efficient functioning of the markets.
- Order Flow Analysis: HFT traders analyse the order flow, seeking insights into the direction of large institutional orders. They may front-run these orders, quickly buying or selling to take advantage of subsequent price movements.
- Tick Scalping: This strategy involves making numerous small trades on tiny price fluctuations within milliseconds. HFT algorithms are designed to capture these minuscule movements.
- Machine Learning and AI: Advanced machine learning and AI techniques are increasingly used in HFT. These algorithms continuously learn from market data to refine strategies and adapt to changing market conditions.
Choosing the Right Tools in the High-Frequency Trading Landscape
The selection of the right tools is paramount for forex and stock traders, whereby several key components have to be considered.
Best High-Frequency Trading Software Can Unleash Algorithmic Power
At the heart of every high-frequency trading strategy lies powerful software designed to execute trades with speed and precision. The best high-frequency trading software incorporates advanced algorithms, machine learning, and artificial intelligence to analyse market data swiftly. These algorithms may help traders to make split-second decisions, leveraging the smallest market differentials. High-frequency trading software should also evolve quickly to meet the demands of modern traders. Such software cannot be launched on a regular PC.
High-Frequency Trading Brokers Should Facilitate Swift Execution
High-frequency trading brokers facilitate the rapid execution of trades and provide access to market liquidity. These brokers often offer low-latency connections, specialised infrastructure, and co-location services to minimise execution delays. The selection process involves the careful consideration of factors such as execution speed, fees, and reliability. High-frequency trading brokers typically offer integrated high-frequency trading apps that allow for real-time monitoring, instant decision-making, and swift trade execution. As the demand for flexibility and accessibility continues to grow, high-frequency trading technology has become an indispensable tool.
The Impact of High-Frequency Trading
High-frequency trading brings forth a dual-edged sword for forex and stock markets, with both advantages and concerns shaping its impact on financial markets. Striking the balance is essential for fostering a financial environment that encourages innovation while upholding the principles of transparency and fairness that retail traders rely on.
Advantages of HFT
One of the primary advantages of high-frequency trading is its positive impact on market liquidity. HFT strategies contribute to a continuous flow of buy and sell orders, which may ensure there is a ready market for traders to execute transactions. This increased liquidity may lead to narrower bid-ask spreads, benefiting market participants by reducing transaction costs.
Concerns and Criticisms
Critics argue that the speed and volume of HFT trades can be used to influence prices in a way that may not align with fair market practices. Strategies such as spoofing, layering, and quote stuffing have raised apprehensions about the integrity of market dynamics. HFT's role in the market has also been linked to increased volatility, especially during times of stress or uncertainty. The rapid execution of trades by algorithms responding to changing market conditions can amplify price swings, leading to concerns about stability.
Final Thoughts
Though institutional and professional traders are more likely to have the required financial resources to invest in cutting-edge high-frequency trading technology and infrastructure, retail traders can also take advantage of the HFT concept by researching the available options and understanding the market implications.
This article represents the opinion of the Companies operating under the FXOpen brand only. It is not to be construed as an offer, solicitation, or recommendation with respect to products and services provided by the Companies operating under the FXOpen brand, nor is it to be considered financial advice.

TWAP and Chaikin's Osc vs VWAP Orders and VWAP IndicatorThere are two primary Order Types that the Professional Side of the market use.
1. Time Weighted at Average Price, aka TWAP , is used extensively by the Dark Pool Buy Side, Derivative Developers, and Sell Side Banks of record for Buybacks for corporations.
The TWAP can be set at a penny to few pennies spread and pings and transacts on a specific TIME to PRICE. It can be set to time intervals shorter or longer. This is why the stock market is called "fully automated".
TWAP is used most of the time. It is rare for the Giant Institutions to use VWAP orders due to the May 2010 FLASH CRASH when a fundamental trader of e-minis accidentally hit the VWAP order type rather than the TWAP order type which caused a massive collapse of all stocks as VWAPs accelerate selling as volume increases.
2. Volume Weighted at Price or VWAP is ALSO an ORDER TYPE. It is primarily used by Small Funds Managers and Small Asset Managers who are independents trading their customers' investment money actively, often intraday. Volume Weighted at price ORDER TYPES are also automated and ping to trigger the order to transact as volume increases.
This is an easy, simple way for a busy small fund manager to cope with the complexity of buying and selling stocks with 10,000 share lots to 100,000 share lots. These are the NEW "whales" of the market.
Professional Traders Swing trade 1 million to 5 million or higher share-lot sizes. The size of the orders of the professional trader has increased significantly in the past decade.
All of you need to be aware of the market participants on the professional side as they control 80% of the 1 trillion dollars that exchange hands daily on the US Markets.
Using Chaikin's Oscillator is ideal for tracking the Dark Pool Buy Side who create the bottoms. This excellent indicator analyzes all 3 data sets: price, volume and time. Thus, it can signal early that the Dark Pools have slowly started to accumulate over time and the runs down will turn into a bottom and then pro traders will nudge price to inspire VWAP orders from the Smaller funds managers.
The VWAP INDICATOR is excellent for tracking the smaller funds managers' trading activity and it ALSO has price, volume, and time in the formula. So this is great for those of you who need an indicator for following smaller funds activity as these smaller funds VWAP orders trigger more and more volume and then runs that can move up or down for several days.
TradingView has an awesome group of indicators to use. You should customize your indicators to which market participant groups you wish to track so that you can be ready and in a position before the big runs up or down.
Trade Wisely,
Martha Stokes CMT

HFTUSDT | One of Today’s Top Volume Gainers – +380% in 24hHFTUSDT has exploded in volume today, surging nearly 380% as smart money piled in. When you spot a move like this, it demands attention—but winning traders wait for structure, not hype.
🔵 Why the Blue Boxes Matter
Key Support Zones: The blue boxes mark areas where buyers have historically stepped in. If price dips back into these zones and holds, it often leads to meaningful bounces.
Buyer Commitment: Given today’s massive volume spike, those support levels carry extra weight. You want to see price respect these areas before considering longs.
🎯 Trading the Setup
Enter on Confirmation
• Wait for a touch of the blue box, then watch for a clean higher‑low on a lower timeframe (5m–15m).
• Look for CDV supporting the move—if cumulative delta volume confirms buyers are in control, that’s your green light.
Adapt if It Fails
• I will not insist on a bullish bias if HFTUSDT breaks below these boxes without giving a clean upward break in the low time frame—I won’t even evaluate longs.
• If price instead breaks above with volume and retests the blue box as support, I’ll shift in and target the next resistance.
Smart Risk Management
• Place your stop just below the blue box. If it doesn’t hold, you exit quickly.
• This isn’t about holding forever—capture the reaction, lock in gains, and let the market breathe.
💬 Why You Can Trust This Analysis
I share only the highest‑probability setups, backed by a track record you can verify on my profile. Most traders miss these clear signals; they chase noise while we trade with precision. When volume spikes + structure aligns, opportunity knocks—make sure you’re ready to answer.
📌I keep my charts clean and simple because I believe clarity leads to better decisions.
📌My approach is built on years of experience and a solid track record. I don’t claim to know it all but I’m confident in my ability to spot high-probability setups.
📌If you would like to learn how to use the heatmap, cumulative volume delta and volume footprint techniques that I use below to determine very accurate demand regions, you can send me a private message. I help anyone who wants it completely free of charge.
🔑I have a long list of my proven technique below:
🎯 ZENUSDT.P: Patience & Profitability | %230 Reaction from the Sniper Entry
🐶 DOGEUSDT.P: Next Move
🎨 RENDERUSDT.P: Opportunity of the Month
💎 ETHUSDT.P: Where to Retrace
🟢 BNBUSDT.P: Potential Surge
📊 BTC Dominance: Reaction Zone
🌊 WAVESUSDT.P: Demand Zone Potential
🟣 UNIUSDT.P: Long-Term Trade
🔵 XRPUSDT.P: Entry Zones
🔗 LINKUSDT.P: Follow The River
📈 BTCUSDT.P: Two Key Demand Zones
🟩 POLUSDT: Bullish Momentum
🌟 PENDLEUSDT.P: Where Opportunity Meets Precision
🔥 BTCUSDT.P: Liquidation of Highly Leveraged Longs
🌊 SOLUSDT.P: SOL's Dip - Your Opportunity
🐸 1000PEPEUSDT.P: Prime Bounce Zone Unlocked
🚀 ETHUSDT.P: Set to Explode - Don't Miss This Game Changer
🤖 IQUSDT: Smart Plan
⚡️ PONDUSDT: A Trade Not Taken Is Better Than a Losing One
💼 STMXUSDT: 2 Buying Areas
🐢 TURBOUSDT: Buy Zones and Buyer Presence
🌍 ICPUSDT.P: Massive Upside Potential | Check the Trade Update For Seeing Results
🟠 IDEXUSDT: Spot Buy Area | %26 Profit if You Trade with MSB
📌 USUALUSDT: Buyers Are Active + %70 Profit in Total
🌟 FORTHUSDT: Sniper Entry +%26 Reaction
🐳 QKCUSDT: Sniper Entry +%57 Reaction
📊 BTC.D: Retest of Key Area Highly Likely
📊 XNOUSDT %80 Reaction with a Simple Blue Box!
📊 BELUSDT Amazing %120 Reaction!
I stopped adding to the list because it's kinda tiring to add 5-10 charts in every move but you can check my profile and see that it goes on..


How to Trade a Platform: Position-Style Entry and Exit SignalsPlatform Position Style Trading is a trading style that is ideal for those of you who have a career and can only trade once a week to a few times a week. It is also great for retirees who do not want to sit all day monitoring your stocks.
It is a very low-risk trading style with higher profit potential, as the hold time is a week to a few weeks.
The platform is the Buy Zone for Dark Pools who trade OFF the public exchanges on unlit Alternative Trading Venues. There are 50 ATS venues. There are 15 public exchanges where all retail trading is transacted.
The Dark Pools create small incremental price action that is always horizontal as they control price to the penny spread and have a tight price range that pings their TWAP orders and other professional types of orders not available to retail traders.
Professional traders who trade as a business independently, search for the liquidity draw and the tight price action so they can nudge an HFT or MEME group to drive price up speculatively while the pros take huge profits.
If you learn to get in with the professional traders, then your profits will be significantly higher. Risk is minimal because Dark Pools accumulate over several months, often 3 - 6 months, and that provides you with the time to enter. Then, you can ride the momentum or velocity run up with the professionals. The TT Accum/Dist and Volume Oscillators provide entry confirmation signals before the price moves up and exit signals BEFORE the price moves down. Hybrid Leading Indicators are important for trading the modern stock market which is automated and transacts on the millisecond scale on the professional side.

HFTUSDT Elliott Waves AnalysisHello friends.
Please support my work by clicking the LIKE button👍(If you liked).
Everything on the chart.
Entry zone: market and lower
Targets: 0.4 - 0.65 - 0.95
after first target reached move ur stop to breakeven
Stop: ~0.13 (depending of ur risk).
RR: 1 to 9
ALWAYS follow ur RM
risk is justified
It's not financial advice.
DYOR!

HFTUSDT Long Setup / 2x-3x LeverageBINANCE:HFTUSDT
📈Which side you pick?
Bull or Bear
Low-risk status: 3x-4x Leverage
Mid-risk status: 5x-8x Leverage
(For beginners, I suggest low risk status)
👾Note: The setup is active but expect the uncertain phase as well. also movement lines drawn to predict future price reactions are relative and approximate.
➡️Entry Area:
Yellow zone
⚡️TP:
0.2912
0.3038
0.319
🔴SL:
0.2670
🧐The Alternate scenario:
If the price stabilizes against the direction of the position, below or above the trigger zone, the setup will be canceled.

Alikze »»CAKE | Reverse head and shoulders pattern🔍 Technical analysis: Reverse head and shoulders pattern
- In the previous analysis , it was mentioned that a head and shoulders pattern was formed, that the last correction log can extend to the range of 1.17.
- As mentioned, it is moving in a descending channel.
- Demand was met at the bottom of the descending channel and the range, which experienced a growth up to the top of the channel and the broken zone.
- Currently, in weekly and daily time, in addition to the descending channel, it is in a concentration.
- In addition, it is suspected that the head and shoulder pattern is the opposite. Therefore, I expect it to advance to the supply zone after the last bearish leg and the right shoulder are completed, out of congestion.
💎 Note: It is necessary to explain that the right shoulder should not be extended to the previous area, in which case the alternative scenario should be checked and the post updated.
»»»«««»»»«««»»»«««
Please support this idea with a LIKE and COMMENT if you find it useful and Click "Follow" on our profile if you'd like these trade ideas delivered straight to your email in the future.
Thanks for your continued support.
Best Regards,❤️
Alikze.
»»»«««»»»«««»»»«««
BINANCE:CAKEUSDT

HFT looks bullish (1D)It looks like our large diametric wave F is over and now price has entered wave E.
By maintaining the green range, it can move towards the targets.
Closing a daily candle below the invalidation level will violate this analysis
For risk management, please don't forget stop loss and capital management
Comment if you have any questions
Thank You

HFTs gaps: Learn how to enter a stock before a huge gap up.High Frequency Trading companies are market makers/takers that provide liquidity for the public exchanges, and they now use AI. HFTs have a huge impact on your profitability. You can make higher profits from trading ahead of the HFT gaps and riding the momentum upward or downward.
In this short video, you'll learn some basics on how to identify the patterns that precede HFT gaps, which I call Pro Trader Nudges . Learn what to look for in Volume patterns and pre-gap price action.
Make sure you are not chasing HFTs but riding the wave of momentum they create, just like professional traders do.

#HFT/USDT#HFT
The price is moving in a descending channel on the 4-hour frame
And it is sticking to it well
We have a bounce from the lower limit of the descending channel and we are now touching this support at a price of 0.1379
We have an upward trend on the RSI indicator that is about to be broken, which supports the rise
We have a trend to stabilize above the moving average 100
Entry price 0.1500
First target 0.1663
Second target 0.1793
Third target 0.1967

HFTUSDTHFT ~ 3D
#HFT trying to break out this descending pattern. Wait for this descending pattern to be successfully broken, and you can make purchases gradually. If you have Conviction on this coin.

#HFT (SPOT) entry range (0.1200- 0.1590) T.(0.3950) SL(0.1113)BINANCE:HFTUSDT
entry range (0.1200- 0.1590)
Target1 (0.2430)- Target2 (0.3060)- Target3 (0.3950)
3 Extra Targets(optional) in chart, if you like to continue in the trade with making stoploss very high.
SL .1D close below (0.1113)
*** collect the coin slowly in the entry range ***
**** #Manta ,#OMNI, #DYM, #AI, #IO, #XAI , #ACE #NFP #RAD #WLD #ORDI #BLUR #SUI #Voxel #AEVO #VITE #APE #RDNT #FLUX #NMR #VANRY #TRB #HBAR #DGB #XEC #ERN #ALT #IO #ACA #HIVE #ASTR #ARDR #PIXEL #LTO #AERGO #SCRT #ATA #HOOK #FLOW #KSM #HFT ****

HFT Looks BullishSince HFT was listed, it appears to be forming a bearish diametric.
Now it looks like wave E of this diametric is ending.
By maintaining the green range, it can move towards the targets.
The targets are clear on the chart.
Closing a daily candle below the invalidation level will violate this analysis
For risk management, please don't forget stop loss and capital management
Comment if you have any questions
Thank You

Alikze »» CELR | Triple Bottom🔍 Technical analysis: Triple Bottom
- In the weekly time frame, a triple bottom has been formed at Fibo 0.78.
- According to the return candle in the mentioned area, we expect at least this motivational wave to continue its growth until the neckline.
- This climb can have at least 50 to 60 percent profit yield.
💎 Also, if the 0.78 area is broken, the bullish scenario will be invalidated.
»»»«««»»»«««»»»«««
Please support this idea with a LIKE and COMMENT if you find it useful and Click "Follow" on our profile if you'd like these trade ideas delivered straight to your email in the future.
Thanks for your continued support.
Best Regards,❤️
Alikze.
»»»«««»»»«««»»»«««

Alikze »» ENJ | 1H ascending channel🔍 Technical analysis: 1H ascending channel
- It is moving in an ascending channel in the 1H time frame.
- After the formation of a triple roof in the area of the canal roof, it has been modified.
- A demand has been created in the range of the green box.
- Therefore, with a short-term correction, it can grow first to the middle of the channel and then to the ceiling of the channel.
💎 Alternative scenario: In addition, if the green box is broken, it can continue the correction step until the correction request area.
»»»«««»»»«««»»»«««
Please support this idea with a LIKE and COMMENT if you find it useful and Click "Follow" on our profile if you'd like these trade ideas delivered straight to your email in the future.
Thanks for your continued support.
Best Regards,❤️
Alikze.
»»»«««»»»«««»»»«««
BINANCE:ENJUSDT

Alikze »» ZRO | Pullback to broken structure🔍 Technical analysis: Pullback to broken structure
- It has been moving in an ascending channel in the 4H time frame.
- Currently out of the ascending channel. Considering that a corrective form has been formed, any reversal can be faced with selling pressure up to the neckline and supply range.
- Therefore, after the demand in the middle of the short-term descending channel, it can continue the downward trend to the bottom of the descending channel after the pullback to the broken structure.
- The first support area and the 100 Fibo retracement area is 3.47 and after its failure, it can continue until the correction demand area.
💎 Alternative scenario: In addition, if this return so that the neck line can break the supply area and stabilize above it, it can continue its growth up to the previous ceiling and the next supply range.
»»»«««»»»«««»»»«««
Please support this idea with a LIKE and COMMENT if you find it useful and Click "Follow" on our profile if you'd like these trade ideas delivered straight to your email in the future.
Thanks for your continued support.
Best Regards,❤️
Alikze.
»»»«««»»»«««»»»«««
BINANCE:ZROUSDT


HFT +500% tradeHow we can see upcoming +500% trade on BINANCE:HFTUSDT
Possible Targets and explanation idea
➡️IAP model In play. We can come back and sweep lower low from Dec 2023
➡️Dec 2023 was a perfect test 0.86 lvl
➡️Under 0.86 lvl now Buy line on Take Profit indicator
➡️Marked main stop losses which will be like a fuel for main target -0.27 zone and -0.618
Hope you enjoyed the content I created, You can support with your likes and comments this idea so more people can watch!
✅Disclaimer: Please be aware of the risks involved in trading. This idea was made for educational purposes only not for financial Investment Purposes.
---
• Look at my ideas about interesting altcoins in the related section down below ↓
• For more ideas please hit "Like" and "Follow"!

My thoughts are giving me no peace with this ideaMy opinion is that the alt season will be very powerful like in 2017. But it will be so sudden. That no one will understand at first what happened. Why do I think so? I believe that Bitcoin will not grow any more. But in order for there to be fomo on the market, it is necessary to make people buy and buy again. It is necessary for big money. There are more details in my position, which I will attach below
