Gold Update: 27 AprilGold seems to accelerate to the downside. In this video I take a look at a potential target and why the DXY gives us a reason to be very worried.
Ichimoku Cloud

BTC Update: 26 AprilBitcoin provides us with a very good risk-reward ratio to try a long position. In this video I explain a bullish setup.

$BNX - Ichimoku breakout + downtrend breakoutBNX is breaking the downtrend and breaking out of the ichimoku cloud
this can be a good trade as the next resistance is at about a 10% distance from the current price
I'm entering if I see a good close of this 4h candle
let me know what you think or if you see anything I didnt see!

SPY Update, 25 AprilIs the inverted head & shoulders pattern about to fail? In this video I take a look at the current structure and explain potential targets.

Weekly Analysis BTC via Ichimoku by TheSocialCryptoClubGood weekend,
As usual, here is our analysis of the week looking at a glance at the daily chart of BINANCE:BTCUSDT using the Ichimoku Kinko Hyo indicator with traditional settings. We used additional indicators that we have developed and released Open Source, you can find them at the end of the analysis.
Trend:
As described last week, exactly 7 days ago Kumo turned red and currently has a thickness of about 1.85%.
The market is in a downtrend situation - confirmed by Tenkan and Kijun and the price is below the Kumo, below the Tenkan on both daily and weekly timeframes - and has a sideways bias.
The Kijun Trend indicator always indicates the search for short positions.
Heikin-Ashi:
After three green candles, now a series of particularly "strong" red candles have taken the price in and below the Kumo, confirming a moment of indecision.
Supports and resistances:
- 75000.00 from Fibonacci
- 67000.00 from historical high
- 66001.41 from the all-time high of Chikou
- 51800.00-52600.00 from Ichimoku Flat/cusp areas of the Chikou
- 49000.00-51000.00 Fibonacci, Psychological Threshold and Kijun Weekly
- 44400.00-45600.00 by areas Ichimoku Flat/Chikou Cusps
- 41200.00 by Ichimoku Flat/Cuspid Chikou areas
- 39400.00 from Ichimoku Flat/Cuspid areas of Chikou
- 37000.00 from Ichimoku to Chikou Plains/Cuspid areas
- 35000.00 from Ichimoku Chikou flat/peak areas
- 33500.00 from Ichimoku Flat/Cuspid areas of Chikou
- 30300.00 by areas Ichimoku Flat/Cuspids of Chikou
For the various static price structures it is possible to refer to the chart where the structures identified by the flat moments of Tenkan, Kijun, Senkou Span A and Senkou Span B on different timeframes are plotted, also Chikou price for the daily time frame.
Also, recall that the various Ichimoku lines serve as dynamic price structures: the Tenkan Sen (short term), the Kijun Sen (medium term) as well as the Senkou Span A and Senkou Span B (long term).
Fibonacci:
The Fibonacci levels still show us a long-term positive sentiment and puts the 0 on the upside at 75000.00. The price is back below the 0.618 level.
Conclusion:
BTC is in a downtrend with a sideways bias on the daily and weekly time frames. Last week's Kumo volatility, as indicated in concert by the various indicators and the Kumo itself, has turned from support to resistance.
The well-known exponential moving averages often used in the Crypto market on the 200, 50 and 20 periods also confirm the downtrend.
From a fundamental point of view, a bullish impulse is possible on the week to launch a BTC Spot ETF.
It is important to evaluate the closing of the week and during the week on the following price structures:
- Bullish: 41250.00
- Bearish: 39400.00
Altcoin Cycle:
For Bitcoin Dominance and Altcoin Cycle we can consider the weekly variation:
- Total cryptocurrency market capital: Decreased
- BTC dominance: Increased
- Price of BTC: Decreased
- Alt Cycle Expectation: Marked Downtrend ccc
Thanks for your attention, happy to support the TradingView community.
Indicators used:
Analysis Tool
Kijun Trend Indicator
Ichimoku Support and Resistance
Chikou Support and Resistance

THETA - cypher pattern + ichimoku breakoutthe price formed an inverse butterfly pattern (or cypher pattern)on 4h chart and we can expect some upside if we fix above the ichimoku cloud
theta is quite a good project which I honestly personally enjoy and like
im invested in it, but this could be a good swing trade expecting at least a 7%
let me know what you think about this idea
I'm entering the trade if a 4h candle closes above the ichi cloud, just to let you know
i want to be transparent so let this be a loss if I'm wrong!
let me know if you enjoyed this analysis and feel free to ask for other pairs to analyze in the comments or feel free to message me if you have any questions or ideas to share!

$BTC - just a retest?BTC is currently retesting the 39K support zone
this has been a major level of support during the last days so this must be held if we dont want to enter another downtrend
yesterday's rsi divergence played out as always, bringing the price down this time
The price also fixed below the ichimoku cloud, leaving more space for a downtrend
we can open some good short positions if the 39K support is lost, but let's hope this is just a retest

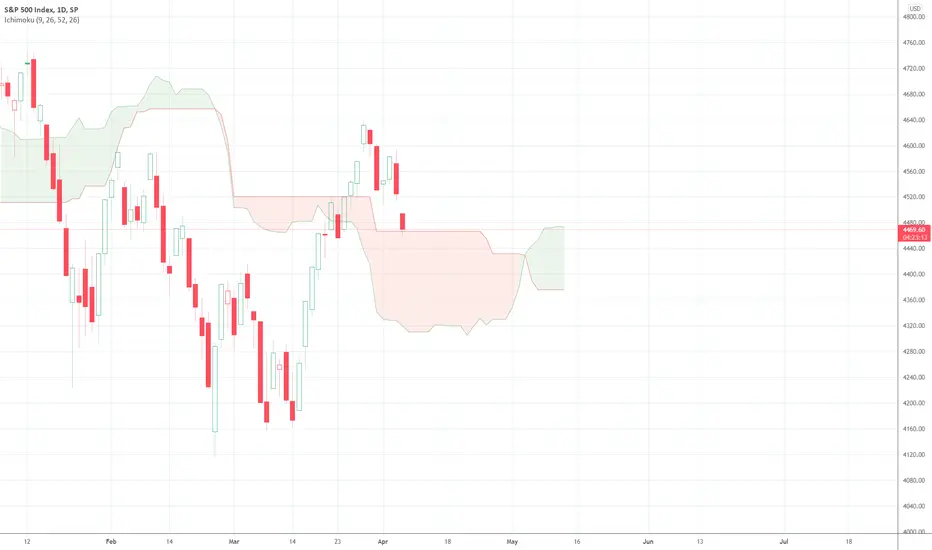
SPX Daily CloudSPX daily bouncing on a massive cloud. This is an absolute must hold for the market...
$AMZN Daily Cloud Break AMZN breaking daily cloud as we speak.
Could be good for a swing trade if market can hold
Bought 3240 C 4/22 for $5.05

USDCADLooking for a bearish continuation for USDCAD. Price pulled back to during the London session. I took the trade and only risk 15 pips on this one


EURUSD 1H analysisWhat do you guys think about this chart analysis? I used an ichimoku cloud as a base combined with a parralel downtrend channel to identify points of interest, and ultimately drew a fib retracement for potential peaks.

Atom Cosmes 4 jours pour attaquer le twistMettre un stop loss en cas de cassure des plus bas de hier,
Tp avec un ratio 2.5 au twist en cas de rejet.

Bitcoin prend appuie sur la TK wComme annoncé il y a quelques jours, le bitcoin vient de prendre appuie sur la Tenkan W 41300
Est-ce une bonne entrée? OUI Mais Je veux une réaction sur ce prix et pas clôture en dessous

Atom. Twist en approche, c'est maintenant ! Atom. Twist en approche, le prix va certainement prend le twist pour enfin décoller.

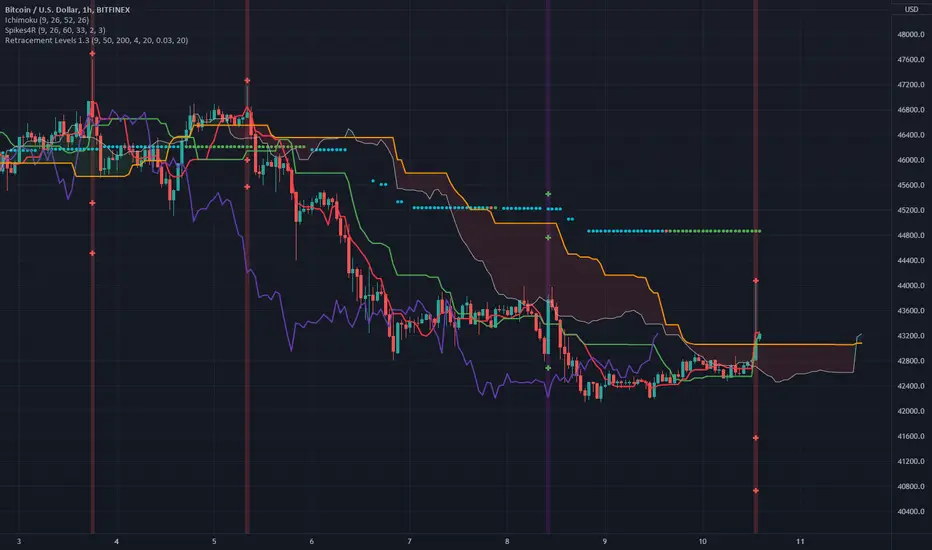
Bitcoin Hour SpikeBitcoin just triggered a price volatility spike on the hourly timeframe. This sets up a potential breakout to the upside as clearing the spike high would signal a trend change and possible reversal of the recent down move.

FB Daily Cloud Let's try the cloud again..... FB testing daily cloud. Also a huge gap at 291. Also RSI divergence...
Got the 295 call for 2.38

Making A Signal In Tradingview Pinescript In Under 20 MinutesHave you ever wanted to combine two technical analysis indicators into a single signal to find your own way of making profit? This video is a tutorial where I take two stock Tradingview Pinescript indicators and combine them into a signal that makes it easier for the user to spot with their eyes when an even occurs on a chart. By following along I hope the viewer can learn the basic process of repeating this for their own research!

Ichimoku cloud on INFYIchimoku has given a short indication for INFY with target at 1832 and sp at 1893

TriasTrias is looking good. Breaking out of the Kumo if it keeps above we can see some heavy price action. My personal indicators say that it’s time to fly.

Dego ready to launchDego just broke out of the Kumo on the daily TF. Volume is rising and the price action needs to keep up. Expecting some fireworks. #ichimoku trend analysis

Idée de trade XTZ analyse avec Ichimoku$xtz
La lagging span à enfin cassé à la hausse.
Nous sommes entrain de travailler la SSB avec la LS (voir si elle fait son rôle de support) la tenkan n'est pas loin ET nous sommes sur la MM7. BON POINT D Entré.
#Cryptos #trading #ichimoku #Bitcoin #btc #cryptocurrency #xtz
