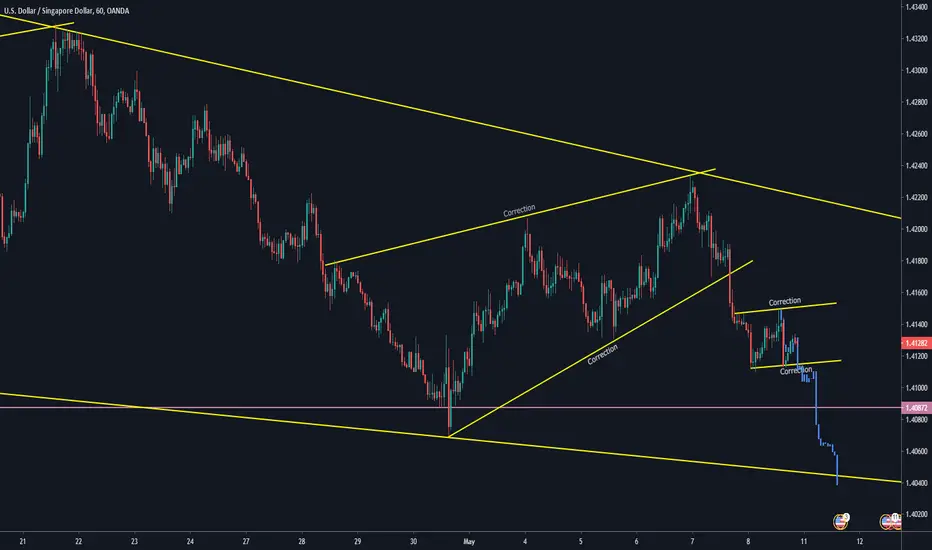
#USDSGD - Short after break of correction Waiting for a break of the correction and double bottom to the downside and will then be looking to enter a short position on this
Impulsecorrectioncontinuation
#EURAUD - Short on the break If i get a break of this correction to the downside i will open a position as soon as it comes along

#GBPCAD - Long - Correction finishedGBPCAD looking like a long after an impulse up.. Corrective phase looks finished

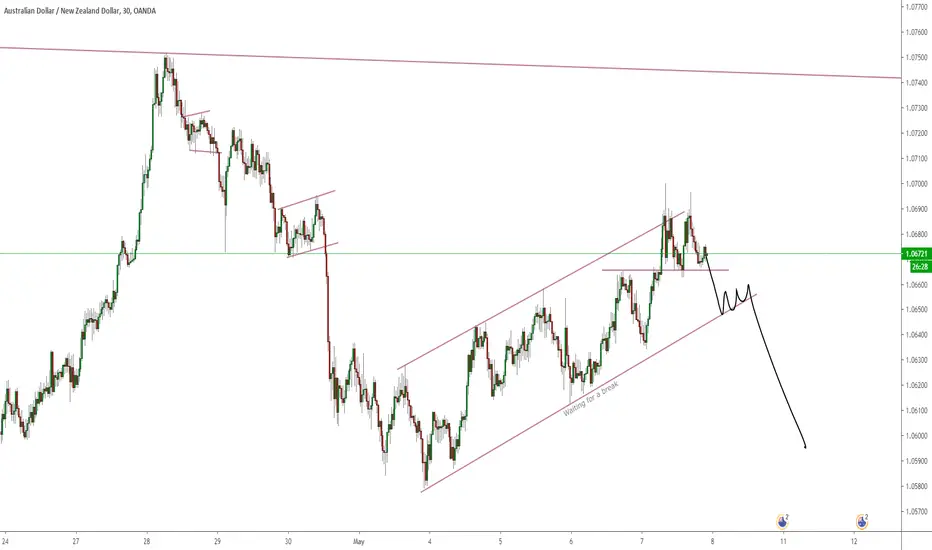
#AUDNZD - Short if i get a bearish impulseIf price can somehow give me a bearish impulse move... I will wait upon a correction before looking to go short
ETHBTC Bounce baby bounceLow is swept
If price doesnt break the current lvl and later get rejected, bears are in treat, I'll look for short entry.
On the other hand if this lvl gets confirmed as support, this could be the best trade of the year for me!


SHORT GBP/CAD1 Rules in Trading
Impulse Correction Continuation
Here we have a nice Consolidation of Price waiting for the the bears to go hard on this one.
Wait for the stocastic and get in

#AUDUSD - Short again soon #ForexBroke a big horizontal support. Waiting to see if its a false break out or.. to see if again we get that corrective pattern structure for an even bigger move to the downside.
Any questions feel free to comment or drop me a message

#EURCAD - Long After Correction #ForexBelieve that the correction with this pair has put in its first bottom.. just looking for a bit more sideways movement, before another impulse move to the upside.
Any questions feel free to comment or drop me a message

#AUDCHF - Short After Correction #ForexWith already being short, I am simply waiting for some sideways movement on a lot of the AUD pairs the beginning of next week.
If a corrective pattern does form and I get a reason to enter I will go short and bring my current positions stop loss to the same place my new one would be.
Any questions feel free to comment or drop me a message

Very Important that How Impulse and Correction WorksDo You know that how impulse and correction market structure actully works, in this example you can understand more better.
ThankYou

EUR/NZD : Sell Trade PlanLooking For Sell in downside , Trend is Bearish in short term period
ThankYou

NZDCAD Continuation Looking to get into the continuation of the bearish momentum on this pair, a retracement looks to be occurring, I will have to wait for market open to see if price has begun its move lower or if it could possibly form a tight flag first. Either way this looks a very good setup on this pair.

ORBEX: EURUSD Triangle Wave Hints to Short-Term UpsideEURUSD triangle structure seems to suggest that we have a little more upside correction left before turning lower.
The test could take place near 1.13, the 78.6% Fibonacci and also a price/trendline intersection. Both MACD and the RSI support short-term bulls!
If successful, the chances of reaching a fresh multiyear low would increase.
Trade safe
Stavros Tousios
Head of Investment Research
Orbex
This analysis is provided as general market commentary and does not constitute investment advice

ORBEX: EURAUD Correction Likely To Lead To Further Upside!EURAUD could move higher to complete minor wave 2 above 1.6800 levels. Before continuing higher, it is necessary to complete the minute correction that started at 1.6800 top.
With a low at 1.618% FE at 1.5900 round level, which is also a double bottom level, the correction could have either ended as a single zigzag or has another bearish leg down between 1.59-1.55.
Look for a valid break above 1.6300 top but before reaching there focus on whether a potential upside is limited to 1.6240 -the 50% FR of 1.6435-1.6045 (minute x wave top to current low price).
Stavros Tousios
Head of Investment Research
Orbex
This analysis is provided as general market commentary and does not constitute investment advice.

ORBEX: CADCHF - Primary C Expected to End Near 0.7950!It looks like the corrective wave (2) of the bullish minor degree has ended at 0.7434 with an open complex w,x,y minute pattern. The recent upside looks impulsive (awe could expect a more complex pattern with a flat likely to appear) and fresh highs could be expected once a valid breakout of minor 1 top is seen.
In the short-term, we could receive a deeper pullback before continuing higher to take out minute wave ( iii ) near 0.77 round level. Or, we could get there first and then receive a pullback for a retest of minor 1 top.
Minor wave 3 is expected to end near 0.7764 and as part of the intermediate impulse to the upside, minor 5 has a medium-term potential near 1.79.
Intermediate wave 5 is part of the A,B,C primary correction (A: 0.7958, B: 0.7222)
This opportunity would be invalidated below 0.7350. A break below 0.7430 would be an early sign of invalidation!
Stavros Tousios
Head of Investment Research
Orbex

ORBEX: EURUSD - Are We Going Lower After Minor 4's Completion?It looks like the corrective minor wave 4 has ended a tad above the strong 1.1025 resistance, taking our breakeven stops. The recent attempt to push prices higher is most likely done for now and fresh lows could be expected.
Minor wave 5 is expected to end below the most recent low of 1.0880, where intermediate wave 3 will also see its end. The intermediate wave 3 is part of the primary A,B,C zigzag with waves A and B at 1.13 and 1.1816, respectively. C will finish this correction with an intermediate 5.
The minute upside correction is part of a bullish flag which could have prices sliding down to 1.07/1.06 medium-term
This opportunity would be invalidated above 1.1063 in the short-term, but in the medium-term, we could see an upside completing a deeper correction closer to minute wave 1 low near 1.1195. A break above the latter would most likely invalidate bears in the longer-term.
Stavros Tousios
Head of Investment Research
Orbex


SWISS FRANC CURRENCY INDEX (SXY) DAILY TIMEFRAME SHORTThe Swiss Franc currency index is currently moving in a series of lower highs and lower lows, characteristic of a downtrend. The price is clearly moving downwards with brief correctional pauses as shown by the ascending wedges and bear flag chart patterns. I am targeting a short trade toward the 97.8 area, which will be my profit taking zone. This area represents a potential buy zone as it is the bottom of the correctional structure. I certainly hope history repeats itself with this trade and the 90% rule sticks out!!!.
A break above 100 might change my bias a bit, but currently i am targeting the 07.8 price level for profit-taking.

BEST BUY DAILY TIMEFRAME SHORTPrices dropped sharply before forming an ascending wedge, which topped out at the 76 price level. Now, price has already broken out of this corrective structure to the downside and is making a continuation move, with two opportunities to scale in already gone. But you can still jump in with proper risk management and target the bottom of the corrective structure, at the 48.17 price level. May the bears pounce on unsuspecting buyers lol!!

NVIDIA DAILY TIMEFRAME SHORTPrices have been tumbling down recently, having broken out of a corrective structure in the form of a bear flag pattern. This pattern was a good way for prices to blow off some steam, after the massive sell-off. Now we expect the prices to go towards the bottom of the corrective structure (bear flag pattern). This is a classic setup and there is no need to say much because price says it all. May the bears take over the world!!!
Target: 125.33

GBP/CAD SHORT 1-HOUR TIMEFRAME CONTINUATION (SCALING IN)Price formed another corrective structure in the form of a bear flag pattern after sellers struggled to hold ground. Now it has just broken to the downside and we are expecting further down movement. Things are a bit slow this week especially after the bank holidays yesterday. Risk management should be on point always. The technicals of this trade are;
Stop Loss: 1.70764
Target: 1.69140

NASPERS (NPN) DAILY TIMEFRAME SHORT The stock price is moving in a series of impulses and corrections , as it nears the ascending trendline. Possible targets are around the 271 330, which represents the bottom of the bear flag pattern. The price has already broken through the bear flag pattern and is moving closer to the target area.
