US100 Free Signal! Sell!
Hello,Traders!
US100 taps into a well-defined horizontal supply zone after a strong bearish displacement, confirming smart money distribution. Price failed to reclaim the supply cluster and is now respecting bearish order flow, with downside liquidity resting below recent lows.
--------------------
Stop Loss: 25,283
Take Profit: 24,891
Entry: 25,123
Time Frame: 4H
--------------------
Sell!
Comment and subscribe to help us grow!
Check out other forecasts below too!
Disclosure: I am part of Trade Nation's Influencer program and receive a monthly fee for using their TradingView charts in my analysis.
Index

USDCAD reached a key daily demand zone (61.8% Fib)Expanded analysis (for the idea details)
Context & setup
Price has dropped sharply into a well-defined daily demand/congestion zone (≈ 1.3765–1.3714) and is currently testing the lower boundary. This area lines up with a key 61.8% retracement cluster and a multi-timeframe support region — a clear confluence of supply/demand and Fibonacci support.
Why this matters
The move into the zone is a strong liquidation leg; the first reaction here will tell us whether buyers are stepping in.
If price shows a clean bullish rejection (wicks, close back above the zone, or a bullish engulf), the probability of a corrective swing higher increases.
The 200/100-type moving averages and higher-timeframe structure act as resistance above, making this a high-reward countertrend/swing setup if buyers defend the zone.
Trade idea (example, for discussion — not trading advice)
Entry: buy area 1.376 – 1.379 after a confirmed bullish price action signal.
Stop loss: below 1.366 (monthly lower invalidation level).
Take profits: partial at 1.4026 (short-term swing target / area of interest), final at 1.4128 (monthly 61.8 / higher resistance).
Invalidation: clear daily close below 1.366 would invalidate the long idea and favors continuation lower.
Risk management & notes
Use position sizing so that the stop equals an acceptable percentage of your account. Aim for positive R:R (this plan targets ~2–4R depending on exact entry).
Watch for news and liquidity events — large catalysts can blow through technical zones.
Wait for a clean price-action confirmation before committing full size.
Summary
This is a classic demand-zone vs. fib confluence trade: if buyers defend 1.3765–1.3714, expect a corrective rally toward 1.402–1.413. If the zone breaks decisively, look for continuation toward 1.366 and below.
Not financial advice. Trade your plan and respect risk.
OANDA:USDCAD FX:USDCAD FOREXCOM:USDCAD BMFBOVESPA:CAD1! TFEX:USD1!

Dow Jones Rebound Ahead! Buy!
Hello,Traders!
US30 has reacted strongly from a well-defined horizontal demand area, confirming smart money accumulation. Bullish displacement broke prior structure, leaving inefficiencies below. Continuation toward resting buy-side liquidity and higher targets is favored. Time Frame 5H.
Buy!
Comment and subscribe to help us grow!
Check out other forecasts below too!
Disclosure: I am part of Trade Nation's Influencer program and receive a monthly fee for using their TradingView charts in my analysis.

IS NIFTY IS READY TO GO UP?On the weekly timeframe, Nifty is currently trading at the support of its rising trendline and has also formed a rejection candle from this area. However, at the same time, the index is positioned near a major resistance zone, which is a strong historical selling area.
This creates a critical situation for the market. The key question now is whether the trendline support will be strong enough to hold Nifty, or whether sellers will dominate from this resistance zone.
If the market opens with a downside gap on Monday, there is a high probability of further decline towards lower support levels. Although bulls have made a strong attempt to keep the market elevated, bearish pressure may still overpower if selling momentum increases near this zone.
Overall, price action around the trendline support and the resistance zone will be crucial in determining the next directional move.
This analysis is for educational purposes only and not financial advice.

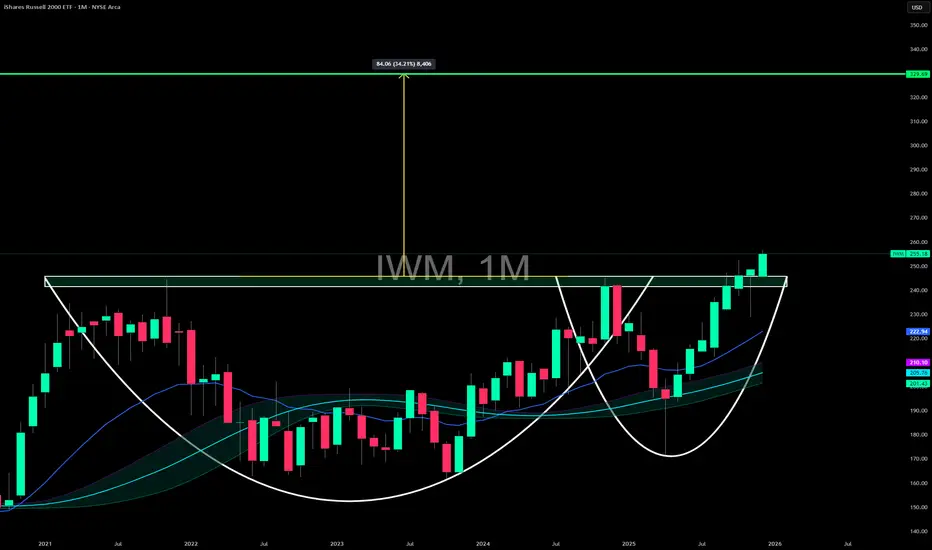
MASSIVE move inbound...🚨 AMEX:IWM is coiling for a MASSIVE move.
We’re breaking out of a 4-year Cup & Handle on the monthly chart—one of the most powerful continuation patterns you can get.
📈 Measured move? ~$330.
Yes… $330.
This checks every box:
• 4 years of underperformance vs. AMEX:SPY and NASDAQ:QQQ
• Small–mid caps are among the most undervalued in the entire market
• Rate cuts are rocket fuel for risk-on segments like AMEX:IWM
• Broad participation = healthier market = Russell strength
This is the breakout I’ve been waiting on.
🔥 Small caps might finally be waking up.
Buckle up.
ALI BABA : SELL OR BUY ??The last time that the price was around 100 $ was at the IPO (2014) and then between AUG 2016- JAN 2017
TOTALL ASSET :
IPO(2014) : 41.27 B
2016: 73.55 B
2017: 114.01 B
2020: 257.86 B
2021 :276.25 B (UNTIL Q3)
GROSS PROFIT :
IPO(2014) : 8.12 B
2016: 14.05 B
2017: 20.66 B
2020: 42.09 B
2021: Q1 + Q2 +Q3 =37.25 + Q4(9.03)(IF WE CONSIDER SAME AZ Q4 OF 2020) = 46.28 B
P/E FORWARD = 7.40 !!!
P/S =2.12 !!!
P/CASH FLOW = 0.10
P/B = 1.79
RETURN ON ASSET = 3.86%
QUICK RATIO = 1.65
DEBT / ASSET RATIO = .08
All these items show the prices are not permanent.

Massive WALL STREET Short At All Time High Price is testing the all time high while a head and shoulders formation is visible on the Daily, indicating potential distribution at resistance
On H4, momentum is overbought and price has remained range bound for approximately four sessions, signaling reduced follow through on the upside
Sentiment appears fragile amid discussion of an AI driven excess, and risk appetite is moderating into strength
Harmonic confluence is present, with a deep crab on H1 and a crab on H4 aligning near current levels to define a potential reversal zone
Multi-timeframe momentum is stretched up to H4; bearish RSI divergence is present on H1 and H4, with H4 showing roughly a 15-point divergence while price holds flat
Repeated failures at the all-time high confirm supply; this level continues to cap advances and strengthens the resistance profile
The H1 trend has transitioned from flat to lower, shifting near-term bias to the downside within the broader range
Cross-market context is consistent, as major US indices are also near record highs and failing to extend, which adds intermarket confirmation
Risk parameters are defined with a stop above 48,250 or above the all-time high at 48,425, which would invalidate the reversal thesis
Initial downside objective is 47,300, corresponding to the next significant support and consistent with an H4 scale pullback
Position management should consider partial profit taking at interim supports and a reduction in risk if RSI resets higher without corresponding price weakness

how dollar index look like now!!This is a long-term structural analysis of the U.S. Dollar Index (DXY).
While no analyst can predict the exact future path of price, studying major structures, liquidity zones, long-term channels, and timing cycles can provide a meaningful macro perspective.
In this chart I highlight:
• Key liquidity pools and distribution/accumulation zones
• Long-term ascending and descending channels
• Major Fibonacci confluence zones
• Structural breaks and mitigation blocks
• Possible multi–year corrective cycles
• Time cycles that have previously aligned with major turning points
The overall idea suggests that DXY may be entering a macro inflection point, where both bullish and bearish scenarios become highly sensitive to structural confirmation.
A deeper correction remains possible if price loses the mid–range support zone, while a reclaim of upper structure could extend the bullish cycle first.
This is not a prediction — it’s a roadmap.
Price will choose its own path, but having a broader structural view helps traders understand where major reactions may occur over the next several years.

U.S. Dollar Index Gearing Up for a Powerful Upswing!💵 DXY — U.S. Dollar Index | Profit Pathway Setup (Swing Trade)
🧭 Bias: Bullish (Confirmed Setup)
📈 Market Type: Index (USD Strength Focus)
🧠 Strategy Style: Layered Limit Entry with SMA Pullback + Triangular MA Breakout
🎯 Trade Plan Breakdown
📊 Setup Insight:
The DXY (U.S. Dollar Index) has confirmed a bullish momentum as price reclaims above the Simple Moving Average (SMA) and breaks through the Triangular Moving Average (TMA) resistance zone — signaling potential continuation strength for the dollar.
📥 Entry Zone (Layering Strategy):
My “Thief Strategy” approach uses multiple limit layers for precision stacking entries:
Buy Limit Layers: 99.00 → 99.50 → 100.00
(You can extend or adjust layers based on your own conviction and risk appetite.)
🛑 Stop Loss:
My Thief SL sits near the recent lower low wick for structure protection → 98.50
💬 Note: Dear Ladies & Gentlemen (Thief OG’s) — I’m not recommending my exact SL.
You manage your own risk — make money, take money, your call.
🎯 Target (Take Profit):
The moving average line is acting like a police barricade — strong resistance area, potential overbought trap zone. Be smart and escape with profits near 102.00.
💬 Note: Dear Ladies & Gentlemen (Thief OG’s) — TP is flexible.
Lock profits where you’re satisfied; don’t let greed arrest your gains. 🚓💰
🌐 Correlated Market Watch
Keep an eye on these correlated pairs & assets for confirmation signals or divergence clues:
💶 $EUR/USD → Inverse correlation (DXY up → EUR/USD down)
$XAU/USD (Gold) → Often moves opposite to USD strength
💷 FX:GBPUSD → Mirrors EUR/USD volatility when DXY surges
BITSTAMP:BTCUSD → Weakens when DXY strengthens due to liquidity shifts
💹 FX:USDJPY → Supports bullish dollar narrative if yield spreads widen
These pairs can help you validate sentiment and timing entries better — especially during London & New York sessions when DXY liquidity peaks.
🧩 Technical Key Points
✅ SMA pullback confirms bullish continuation zone
🔺 Triangular Moving Average breakout shows renewed strength
🧱 99.00–100.00 acts as accumulation floor
🚨 102.00 remains resistance barricade zone (potential trap)
⏰ Best observed during London/NY overlap for volatility cues
✨ “If you find value in my analysis, a 👍 and 🚀 boost is much appreciated — it helps me share more setups with the community!”
⚠️ Disclaimer: This is a Thief-style trading strategy — just for fun and education. Not financial advice. Trade wisely and manage risk like a pro.
#DXY #USDollarIndex #ForexTrading #SwingTrade #TechnicalAnalysis #TradingIdeas #PriceAction #SMAStrategy #MovingAverages #CurrencyTrading #DollarStrength #ForexSignals #TradingStrategy #MarketAnalysis #ChartPatterns #BullishSetup #RiskManagement #ForexCommunity #TradingView #DXYAnalysis

Wheat — moving downWe’re starting to move down.
The first target is the 15,200–15,400 range.
The main one is 14,300. We could even drop lower, but it’s too early to say for sure.
---
Please subscribe and leave a comment.
You’ll get new information faster than anyone else.
Together, we’ll grow and become wealthier.
---

US100 Free Signal! Buy!
Hello,Traders!
US100 shows price reacting inside a horizontal demand zone, with a clean liquidity sweep beneath recent lows. Structure suggests a retest of demand before expansion, aiming toward the next intraday target above.
--------------------
Stop Loss: 25,115
Take Profit: 25,601
Entry: 25,309
Time Frame: 5H
--------------------
Buy!
Comment and subscribe to help us grow!
Check out other forecasts below too!
Disclosure: I am part of Trade Nation's Influencer program and receive a monthly fee for using their TradingView charts in my analysis.

FireHoseReel | USDT Dominance Is Loading a Market Shakeout🔥 Welcome To FireHoseReel !
Let's dive into DominanceUSDT Structure .
🎯 After breaking its bullish curve, USDT Dominance formed a higher low on the 4H timeframe compared to the previous bottom.
A sharp drop alongside a strong Bitcoin rally was needed to break its supports — but that scenario did not happen.
🌪 USDT.D has now broken its descending trendline and is facing resistance at 6.073%.
A breakout above this zone could restart a broader market correction and trigger a retest of the 4H high.
🧮 On the 1H timeframe, RSI has formed an overbought level.
A momentum break above this zone could drive USDT dominance sharply higher.
💡 Summary: USDT dominance still has bullish strength.
If it continues to move upward, our short position triggers could become active.
🛞 Risk Management & Disclaimer
Please remember to always use proper risk management and position sizing. Nothing in this analysis is financial advice. The market can change quickly, so always trade based on your own strategy, research, and risk tolerance. You are fully responsible for your own trades.

US100 Bullish Bias! Buy!
Hello,Traders!
US100 is expanding from the demand zone after a clean mitigation and a shift in structure, with liquidity resting above the recent swing highs. Market is poised to draw toward the next premium target as inefficiencies get filled. Time Frame 5H.
Buy!
Comment and subscribe to help us grow!
Check out other forecasts below too!
Disclosure: I am part of Trade Nation's Influencer program and receive a monthly fee for using their TradingView charts in my analysis.

Pound makes post-Budget gains versus the dollarThe UK’s autumn Budget on 26 November has generated considerable volatility for GBP/USD. After an initial dip, the pound has strengthened versus the US dollar to around $1.3230 at the time of publication.
Ahead of the Budget at 12.30pm (UK time) today, GBP/USD found support near the trend line at $1.3120. Now, the pair is showing signs of renewed strength. If the pound stays above $1.3190, it could continue to strengthen towards the next resistance area near $1.3330. The relative strength index (RSI) – a key gauge of momentum – has risen above 50, suggesting that sentiment towards the pound may be turning more bullish.
One could even argue that GBP/USD has formed a double bottom, and that today’s rise above $1.3190 may have confirmed the breakout, potentially propelling the pair towards $1.3330.
From there, the technical chart shows little in the way of overhead resistance until the $1.3430 area. That said, if volatility persists and GBP/USD dips back below $1.3190, the market may interpret that as a failed breakout attempt. In that scenario, the pair could slip below $1.3020. Should that happen, there is very little support for cable until around $1.27. But currently, with momentum improving and key support levels holding, the setup seems to support the pound’s continued strength versus the dollar.
Written by Michael J. Kramer, founder of Mott Capital Management.
Disclaimer: CMC Markets is an execution-only service provider. The material (whether or not it states any opinions) is for general information purposes only and does not take into account your personal circumstances or objectives. Nothing in this material is (or should be considered to be) financial, investment or other advice on which reliance should be placed.
No opinion given in the material constitutes a recommendation by CMC Markets or the author that any particular investment, security, transaction, or investment strategy is suitable for any specific person. The material has not been prepared in accordance with legal requirements designed to promote the independence of investment research. Although we are not specifically prevented from dealing before providing this material, we do not seek to take advantage of the material prior to its dissemination.

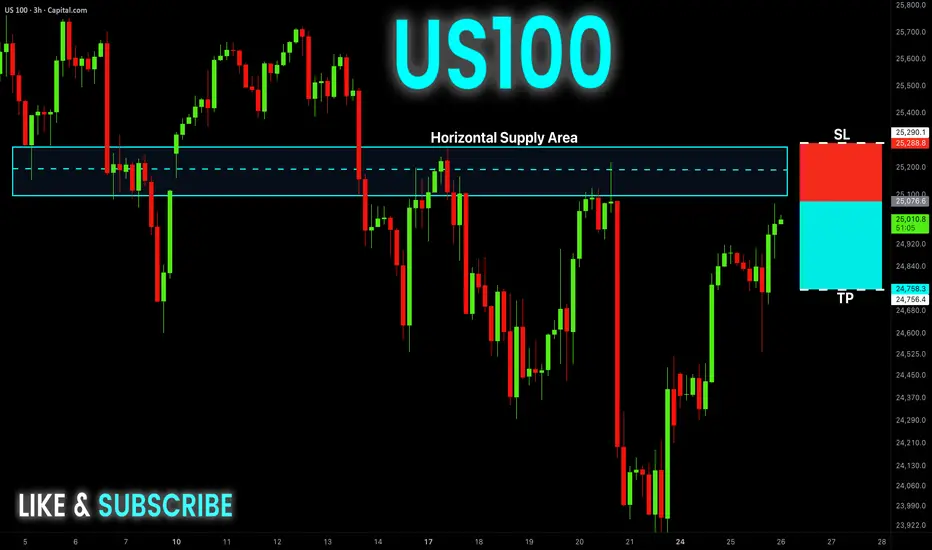
US100 Free Signal! Sell!
Hello,Traders!
US100 has swept internal liquidity and is now approaching the horizontal supply but hasn’t retested it yet. If the retest confirms distribution, SMC flow favors a drop toward the next sell-side liquidity zone.
--------------------
Stop Loss: 25,288
Take Profit: 24,756
Entry: 25,076
Time Frame: 3H
--------------------
Sell!
Comment and subscribe to help us grow!
Check out other forecasts below too!
Disclosure: I am part of Trade Nation's Influencer program and receive a monthly fee for using their TradingView charts in my analysis.
DXY FREE SIGNAL|LONG|
✅DXY has tapped the higher-timeframe demand and formed bullish displacement after clearing sell-side liquidity. A refined entry inside the mitigation zone aligns with algo order-flow targeting the buy-side liquidity above.
———————————
Entry: 99.773
Stop Loss: 99.641
Take Profit: 99.967
Time Frame: 2H
———————————
LONG🚀
✅Like and subscribe to never miss a new idea!✅

SPX500 Short
Deep crab pattern completes on M15, mapping a potential reversal zone.
Multiple tops formed on M15 and M30 at the same area, reinforcing overhead supply from the prior day’s high that price could not break.
RSI reached overbought on M15 and M30, indicating crowded long positioning.
Approximately 20 points of RSI bearish divergence across M15 and M30, consistent with a weakening advance.
H4 has turned down after last week’s rebound and now aligns with a downside continuation view.
Daily slope is flattening and price is trading beneath it, suggesting the early stages of a broader reversal can develop if sellers follow through.
Bias is short of the reversal zone identified by the deep crab and repeated tops.
Stop loss set at 50 pips to cap risk if resistance fails.
First target at 6,600, which is 100 pips from entry, with room to manage partials at nearby structure if momentum confirms.
Several US indices and other global indices are printing similar topping behavior and momentum fades, adding intermarket confluence to the short idea.

US500 - Oversold at Triple Confluence… Bounce Incoming?US500 is approaching a major oversold zone, where three powerful elements intersect at the same point:
• The lower bound of the falling red channel
• The blue long-term trendline
• The orange structure zone acting as demand
⚔️This alignment creates a strong confluence area, a spot where buyers usually step in to absorb selling pressure and trigger corrective moves.
As long as the index holds above this zone, we can expect the possibility of a bullish correction toward the upper trendlines. But if this area fails, the structure would weaken and open the door for deeper downside.
Right now, all eyes are on this confluence… will the US500 bounce from the oversold zone, or break through it? 🤔
⚠️ Disclaimer: This is not financial advice. Always do your own research and manage risk properly.
📚 Stick to your trading plan regarding entries, risk, and management.
Good luck! 🍀
All Strategies Are Good; If Managed Properly!
~Richard Nasr.

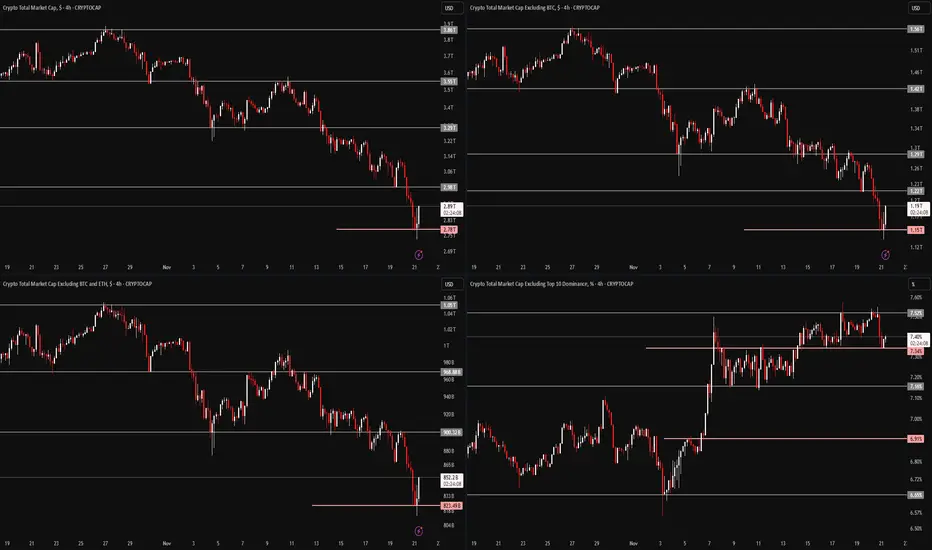
FireHoseReel | Crypto Index Overview🔥 Welcome FireHoseReel !
Let’s dive into the analysis of Four major crypto Index.
🔶 TOTAL (Crypto Market Cap) – 4H Timeframe
On the 4-hour timeframe of TOTAL, we can see a strong correlation with Bitcoin’s chart. After approaching the $4T zone, the total market cap went through a deep correction, testing multiple support levels and eventually breaking them.
It’s now sitting around $2.78T, marking a $1 trillion drop, which is something unprecedented in the crypto market.
The current support lies at $2.78T, and this level aligns closely with the upper resistance of USDT dominance, creating an important confluence. If this confluence strengthens, TOTAL may continue moving downward while USDT dominance pushes higher.
The major resistance for TOTAL is the $3T zone, and a breakout above it could create a pullback to the recent Bitcoin decline.
🔶 TOTAL2 (Altcoin Market Cap Excluding BTC) – 4H Timeframe
On the 4-hour timeframe of TOTAL2, we see a strong correlation with Ethereum’s chart.
TOTAL2 dropped from around $1.5T down to nearly $1T, following the recent sell-off in Bitcoin and Ethereum. It tested its supports and eventually lost them.
Currently, TOTAL2 is positioned near $1.15T, and breaking below this level could lead to a deeper correction in Ethereum.
On the other hand, reclaiming and breaking above $1.22T may push TOTAL2 upward and act as an early signal for a new bullish wave (mostly a pullback) in Ethereum and its ecosystem projects.
🔶 TOTAL3 (Altcoin Market Cap Excluding BTC & ETH) – 4H Timeframe
On the 4-hour timeframe of TOTAL3, the chart aligns with the performance of the top 10 altcoins.
TOTAL3 previously hovered around $1.05T and has experienced a milder decline compared to TOTAL and TOTAL2. It is currently sitting at its major support near $832B, testing a multi-timeframe support zone.
A breakdown of this level could extend the correction across the top altcoins.
However, breaking above the $900B area could generate a pullback and corrective wave against the recent downside leg, signaling potential upward movement.
🔶 OTHERS Dominance (others.d) – 4H Timeframe
On the 4-hour timeframe of OTHERS.D, we’re looking at one of the most important crypto indicators, especially in times like this. This index helps us understand when the altcoin bull market (altseason) may begin and when it's time to start building spot portfolios.
Despite the market volatility, OTHERS.D has held itself inside a stable 4H trading range and is currently reacting to the midline of its 1H range.
If Bitcoin dominance had increased during this period, altcoins could have faced an even deeper correction. However, on-chain data shows that altcoins are receiving far more attention compared to previous years.
A breakout above 7.52% on this indicator could be an early signal of a potential upcoming altcoin bull run.
🛞 Risk Management & Disclaimer
Please remember to always use proper risk management and position sizing. Nothing in this analysis is financial advice. The market can change quickly, so always trade based on your own strategy, research, and risk tolerance. You are fully responsible for your own trades.
SPX 500: Bullish Rebound to 6760?FX:SPX500 is priming for a bullish rebound on the 4-hour chart , where price has pulled back to a critical support zone following a sharp decline, forming a potential bounce setup amid a broader uptrend—highlighted by the rebound pattern near key levels that could ignite buying if buyers defend against further downside. This confluence at the support offers a high-reward long opportunity in the index's volatile range.
Entry zone between 6530-6550 for a buy position. Target at 6760 🎯near the resistance zone, delivering a risk-reward ratio greater than 1:4 .Set a stop loss on a close below 6500 📊 to manage risk effectively. Watch for confirmation via a strong bullish candle with rising volume above the entry, capitalizing on the index's resilience despite recent pressures🌟.
Fundamentally , the S&P 500 closed at around 6646.7 on November 19, 2025, down over 2% in November amid economic concerns and high valuations, particularly in AI stocks, with the index dipping below its 50-day moving average for the first time since April—yet historical patterns suggest a median 15% upside to 7710 over the next year if it follows median rebounds. Earnings growth remains robust at 16.9% YoY, beating estimates, supporting potential recovery despite tariff worries. 💡
📝 Trade Setup
🎯 Entry Zone (Buy): 6530 – 6550
🎯 Target:
• TP: 6760 (major resistance)
❌ Stop Loss: Close below 6500
⚖️ Risk-to-Reward: Greater than 1:4
What's your outlook on this rebound? Drop your thoughts below! 👇

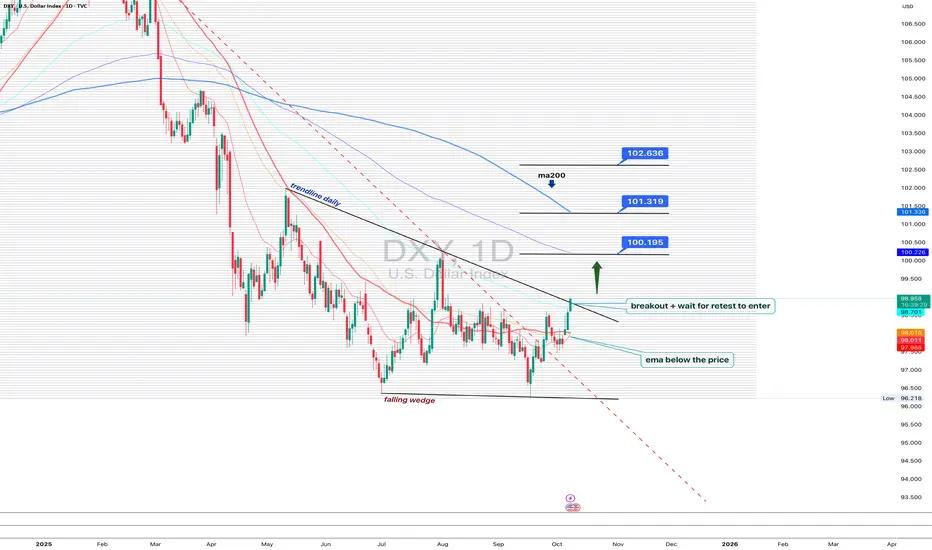
DXY 1D - dollar waking up, but patience is keyOn the daily chart, the US Dollar Index is showing the first signs of recovery: a falling wedge breakout and trendline breach hint that bulls are slowly reclaiming control. Price has moved above the EMA, a short-term bullish signal.
Still, MA200 remains above, reminding us that the broader trend is not yet flipped. The ideal play here - wait for a retest of the breakout trendline to confirm buyers’ strength before jumping in.
If price holds above 99.70, the next upside targets sit around 100.19, 101.31, and 102.63.
But keep in mind - DXY loves to test patience. False breakouts are its favorite sport.
Right now, the dollar looks ready to wake up, but maybe hit the snooze button one last time before the real move begins.
HK50 Long Setup at 25,875Crab pattern completes on M30 and H1, marking a potential reversal zone near current price.
Triple bottom visible on M30 and H1, reinforcing a well defined support shelf.
RSI is rising as the triple bottom forms, which supports the idea of accumulation rather than a weak bounce.
Daily trend remains up, so a rebound aligns with the higher time frame bias.
Timeframes up to H4 are oversold, which suggests short term selling pressure is stretched and vulnerable to mean reversion.
Stay alert to a possible regime shift toward bearish conditions. If market tone deteriorates, prioritise defense and faster exit.
RSI divergence of about 18 points on M30, indicating buyers are stepping in while downside momentum fades.
Look for a momentum confirmation trigger, for example, an M30 higher low or an H1 close above the most recent swing high.
Entry: 25,875 at or just above the reversal zone.
Stop loss: 25,650 to avoid crowding structure while cleanly invalidating the setup if broken.
First target: 26,475, which aligns with nearby resistance and a conservative mean reversion objective.
Secondary decision point: monitor price behavior as M15 and M30 approach overbought. If thrust is weak, scale partials and tighten risk.

us30 bullishDow Jones can start its bullish move from 46,411 toward 46,681, keeping in mind the critical level at 46,298. CMCMARKETS:US30
