S&P500: Flash dump continues, short bias remains!
📝 1. Market Context
BLUEBERRY:SP500 Yesterday’s analysis highlighted the weakness after the market failed at resistance. Today, that scenario was confirmed with a flash dump and a sequence of strong red candles, signaling sellers remain firmly in control. The short-term structure continues to print lower highs and lower lows, which clearly reflects the dominance of the bearish trend.
🟥 2. Resistance Zone
The 6,651 – 6,658 area (red zone on the chart) continues to act as a critical resistance. This zone is reinforced by 4 levels of resistance combined with moving averages (MA). Moreover, the latest bounce is still contained within a large red candle, signaling that buyers lack the strength to shift momentum.
Each time price tested this zone, it faced strong rejection. As long as the market trades below this red zone, the dominant trend remains bearish.
📉 3. Bearish Trend & Downside Targets
Currently, the market has confirmed the bearish trend by consistently forming lower highs. This is already the third bearish leg since the downtrend began – and according to wave logic, the third leg often turns out to be the strongest one, provided resistance at 6,658 holds.
• Immediate target: 6,629 – 6,615 (a key support cluster that previously rejected price).
• If broken: selling pressure could push the market further down toward 6,578 and even 6,560 – both strong technical and psychological support levels.
✅ 4. Conclusion
The S&P500 has confirmed its bearish trend with a flash dump. The 6,651 – 6,658 area remains the critical resistance, and as long as price stays below this zone, sellers have the upper hand. The bearish scenario remains valid with the first target at 6,629 – 6,615, and if this support fails, the move could extend toward 6,578 – 6,560.
Please like and comment below to support our traders. Your reactions will motivate us to do more analysis in the future 🙏✨
Index

DXY Dollar Heist: Can You Escape @100?🔥 DXY Dollar Index Bank Heist Plan (Swing Trade) 🔥
Asset: DXY Dollar Index 💵Plan: Bullish 📈Thief Trading Style: Layered Limit Order Strategy 🕵️♂️
🏦 The Heist Plan 🏦
Dear Thief OG's, Ladies & Gentlemen, get ready to pull off the ultimate DXY heist! 💰 We're using the Thief Layering Strategy to stack multiple limit orders and maximize our loot. Follow the plan, adjust to your risk, and let’s escape with the cash! 🚨
📈 Entry: The Break-In
Strategy: Deploy multiple buy limit orders to layer your entries like a master thief 🕴️. Suggested levels:
98.00 💸
98.20 💸
98.40 💸
98.60 💸
Flexibility: Add more layers based on your risk appetite or market conditions 📊.
Pro Tip: Set an alert on TradingView to catch the breakout or pullback at these levels 🚨.
🛑 Stop Loss: The Escape Route
Thief SL: Set at 97.50 to protect your stash 🛡️.
Risk Management: Adjust SL based on your lot size, risk tolerance, and number of layered entries ⚖️.
Warning: Don’t get caught! This is a high-stakes heist—stick to your risk plan 🔥.
🎯 Target: The Getaway
Police Barricade: Resistance at 100.30 🚓—watch out!
Our Target: Take profits at 100.00 to escape with the loot before the market traps you 🏃♂️💨.
🧠 Why This Heist?
The DXY is showing bullish momentum based on real-time market data 📡:
Macro Factors: Strong USD demand driven by economic indicators (check COT reports, geopolitics, and intermarket analysis) 🌍.
Technical Setup: Layered entries align with swing trade pullbacks and key support zones 📉.
Scalpers 👀: Stick to quick long-side trades with trailing SL to lock in profits 💰.
⚠️ Trading Alerts: Stay Sharp!
News Releases: Avoid new trades during high-impact news to dodge volatility traps 🚫.
Position Management: Use trailing stop-loss to secure your profits and stay safe 🛡️.
💪 Boost the Heist!
Hit the Boost Button to power up our Thief Trading Style! 🚀 Every like and view strengthens our crew, helping us rob the market with precision. Let’s make money and vanish like pros! 🤑
Stay tuned for the next heist plan, Thief OG’s! 🕵️♂️🎉

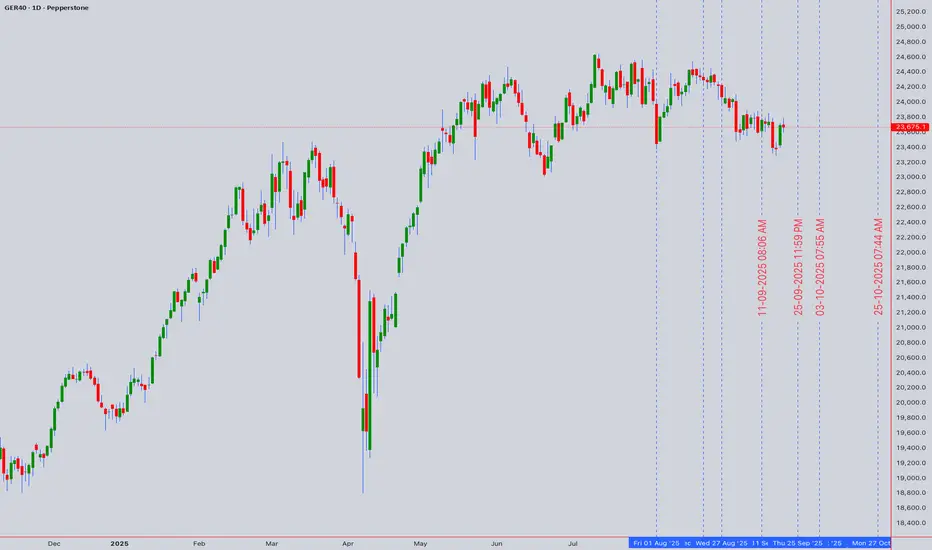
GER40 (DAX40) Technical Forecast📊🇩🇪 GER40 (DAX40) Technical Forecast – Intraday & Swing Outlook
Asset Class: GER40 CFD (DAX40)
Current Close: 23,675.1 (20th Sept 2025, 12:50 AM UTC+4)
🔎 Technical Setup
🕯 Candlesticks: Strong rejection tails at resistance, suggesting supply pressure.
🌊 Elliott Waves: Market in corrective wave phase after strong rally.
📐 Harmonics: Possible Bearish Gartley forming near 23,950 zone.
📊 Wyckoff: Distribution signs emerging after extended markup.
📏 Gann Angles: 23,800 key pivot (time & price convergence).
☁️ Ichimoku: Price testing Kijun resistance; cloud support below 23,400.
📈 Indicators
💪 RSI (H1): 65 – nearing overbought zone.
📉 RSI (Daily): Neutral → potential downside risk.
🎯 Bollinger Bands: Pinching – volatility expansion expected.
⚖️ VWAP (Weekly): 23,520 – magnet level.
📊 MA Cross: Short-term EMA threatening bearish crossover.
⏱ Intraday Outlook
🕒 Key Levels:
🟢 Buy Zone: 23,420 – 23,480 (bounce setup).
🔴 Sell Zone: 23,800 – 23,950 (rejection expected).
🎯 Targets:
Upside: 23,720 → 23,840 → 23,950
Downside: 23,520 → 23,400 → 23,250
⚡ Bias: Range-bound with bearish tilt near highs.
📆 Swing Trading Outlook
🟢 Swing Buy Entry: 23,200 – 23,300 (strong demand zone).
🎯 Upside Swing Targets: 23,850 → 24,100 → 24,350
🔴 Swing Sell Entry: 23,900 – 24,050 (supply area).
🎯 Downside Swing Targets: 23,400 → 23,050 → 22,750
📉 Bias: Bearish divergence forming – possible correction if 23,900 rejects.
🌐 Market Context
⚠️ Eurozone slowdown + ECB policy risks may cap upside.
📊 US indices correlation → keep an eye on US500/NAS100.
🛢 Energy price spikes = potential drag on DAX industries.
📝 Trading Plan
✔️ Intraday traders: Sell rallies into 23,800–23,950 🔻
✔️ Swing traders: Accumulate near 23,200–23,300 🟢
✔️ Manage risk: Always place tight stops below support or above resistance.
🔥 Conclusion:
DAX40 (GER40) faces stiff resistance at 23,900. Intraday range traders can fade extremes, while swing traders prepare for a correction towards 23,200 support before the next big move.
For individuals seeking to enhance their trading abilities based on the analyses provided, I recommend exploring the mentoring program offered by Shunya Trade. (Website: shunya dot trade)
I would appreciate your feedback on this analysis, as it will serve as a valuable resource for future endeavors.
Sincerely,
Shunya.Trade
Website: shunya dot trade
US500 (S&P500) Projection📊 US500 (S&P500) Forecast | Intraday & Swing Outlook 🚀📉
Asset Class: US500 CFD (SPX, SPY, S&P500)
Current Closing Price: 6,661.8 (20th Sept 2025, 12:50 AM UTC+4)
🔎 Market Overview
The S&P500 remains highly volatile as it consolidates near all-time highs. Both bullish continuation and reversal traps are emerging.
We integrate Elliott Wave 🌊, Ichimoku ☁️, Gann 🔺, and VWAP 📏 tools to frame trade setups.
⚡ Intraday Technical Levels
Immediate Support: 6,635 – 6,610 🟢
Key Resistance: 6,690 – 6,725 🔴
VWAP Zones: Anchored support at 6,628 📏
RSI: Neutral (52) → room to swing both sides 📈📉
🎯 Intraday Trade Ideas
Buy (Scalp): 6,620 – 6,635 🛒
Target: 6,670 → 6,690 🚀
Stop Loss: Below 6,600 ❌
Sell (Scalp): 6,690 – 6,710 🛑
Target: 6,645 → 6,625 📉
Stop Loss: Above 6,730 ❌
⏳ Swing Trading Outlook
Swing Support: 6,580 – 6,520 📉
Major Resistance: 6,750 – 6,820 🚀
Ichimoku Cloud: Bullish bias (daily/weekly) ☁️
Wave Count: Elliott suggests Wave 4 consolidation before Wave 5 breakout 🌊
🎯 Swing Trade Ideas
Buy (Swing): 6,580 – 6,600 🛒
Target: 6,720 → 6,800 🚀
Stop Loss: 6,520 ❌
Sell (Swing): 6,750 – 6,820 🛑
Target: 6,640 → 6,600 📉
Stop Loss: 6,860 ❌
📐 Pattern Watchlist
⚠️ Potential Bull Trap: Above 6,725 – rejection zone
⚠️ Head & Shoulders risk: Breakdown below 6,580
📏 Gann Levels: Time cycle indicates critical reversal window next week
☁️ Ichimoku Twist: Signals momentum shift by month-end
📌 Strategy Recap
🎯 Intraday Bias: Range trade → watch VWAP flips 📊
📈 Swing Bias: Bullish above 6,600, bearish below 6,580 🔑
⏳ Patience Key: Avoid chasing breakouts without volume confirmation 📉📊
🧭 Conclusion
The US500 (S&P500) is at a make-or-break zone.
✅ Buy dips near 6,600
❌ Sell rallies into 6,750 – 6,820
🔮 Expect volatility as macro events drive direction
📊 Stay disciplined, trade the levels, and adapt quickly 🚀📉
For individuals seeking to enhance their trading abilities based on the analyses provided, I recommend exploring the mentoring program offered by Shunya Trade. (Website: shunya dot trade)
I would appreciate your feedback on this analysis, as it will serve as a valuable resource for future endeavors.
Sincerely,
Shunya.Trade
Website: shunya dot trade
📝 TRADING CHECKLIST
Before entering any position:
- ✅ Confirm volume supports move
- ✅ Check RSI for divergences
- ✅ Verify multiple timeframe alignment
- ✅ Set stop loss before entry
- ✅ Calculate position size
- ✅ Review correlation with DXY/SPX/US30
- ✅ Check economic calendar
- ✅ Assess market sentiment
⚠️Disclaimer: This post is intended solely for educational purposes and does not constitute investment advice, financial advice, or trading recommendations. The views expressed herein are derived from technical analysis and are shared for informational purposes only. The stock market inherently carries risks, including the potential for capital loss. Therefore, readers are strongly advised to exercise prudent judgment before making any investment decisions. We assume no liability for any actions taken based on this content. For personalized guidance, it is recommended to consult a certified financial advisor.

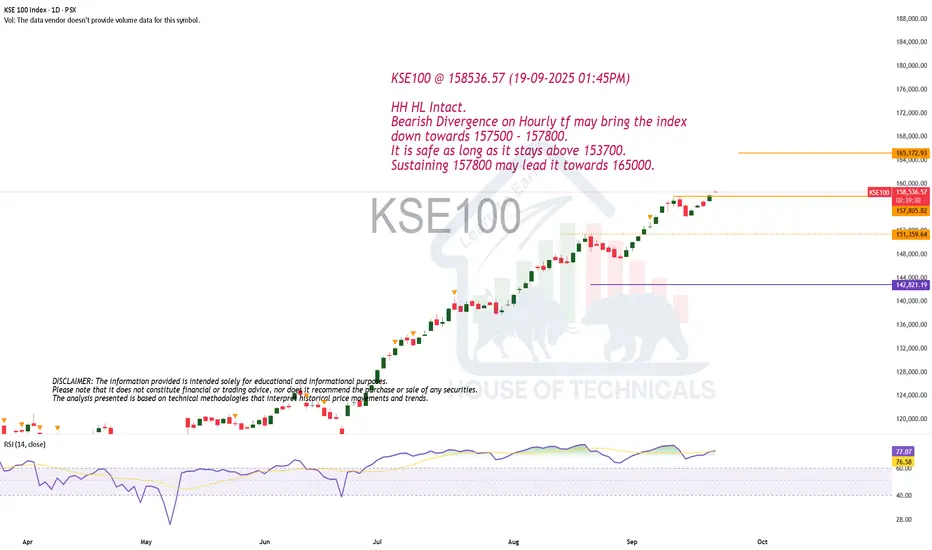
HH HL Intact.KSE100 @ 158536.57 (19-09-2025 01:45PM)
HH HL Intact.
Bearish Divergence on Hourly tf may bring the index
down towards 157500 - 157800.
It is safe as long as it stays above 153700.
Sustaining 157800 may lead it towards 165000.
GBPUSD LONGPrice is sitting at a strong demand area
RSI is above 40 line suggesting potential strong area
Trade SAFE

dowjones must goes to 46047Based on the analysis, Dow Jones has the potential to continue its upward movement from the 45,868 range. The price level of 45,809 serves as a warning zone for this decision.
If this area holds, the target could reach the peak of 46,100. CMCMARKETS:US30

SHORT ON NASNAS has created a nice rising channel (bearish reversal pattern) and is starting to push outside of the channel to the downside.
I will be selling nas to the previous low looking to catch 800-900 points.

DXY Bearish Breakout! Sell!
Hello,Traders!
DXY is trading in a
Downtrend and the
Index made a bearish
Breakout of the key
Horizontal level of 97.200
So we are bearish biased
And we think that a
Further price decline is
Likely to happen
Sell!
Comment and subscribe to help us grow!
Check out other forecasts below too!
Disclosure: I am part of Trade Nation's Influencer program and receive a monthly fee for using their TradingView charts in my analysis.

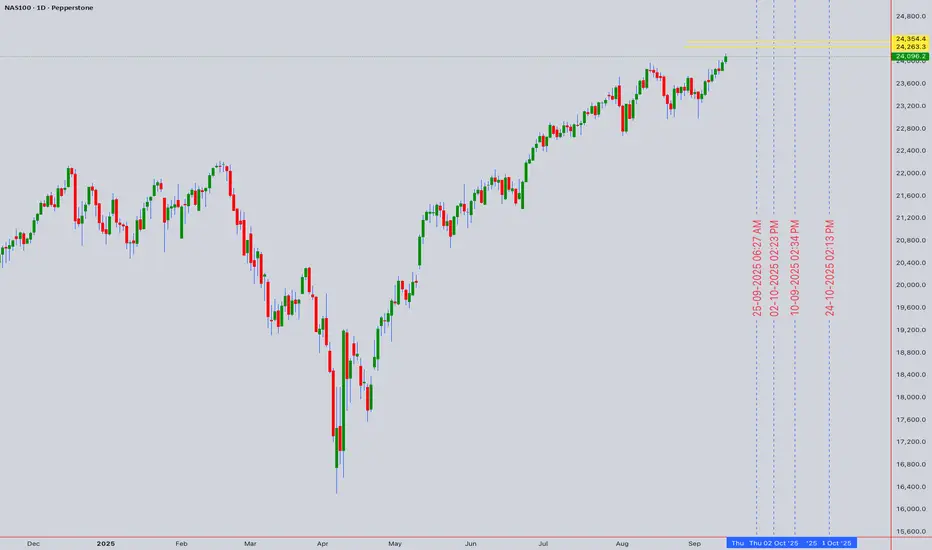
NAS100 Forecast & Projection📊 NAS100 Forecast | Intraday & Swing Outlook 🚀📉 (11th Sept 2025)
🕵️ Market Context
NAS100 closed at 24,096.
Global equities remain volatile due to inflation, Fed policy outlook, and tech earnings season.
Short-term sentiment: Neutral to Slightly Bullish.
Swing sentiment: Bullish while above 23,500 key support.
🧩 Technical Framework
Candlesticks: Bullish engulfing spotted on H4, suggesting buyers defend 23,800 zone.
Elliott Wave: Current move resembles Wave 3 extension with corrective pullbacks near 23,750–23,900.
Wyckoff: Distribution signs absent, market in late accumulation.
Gann Analysis: 24,200–24,250 forms a key resistance square.
Ichimoku Cloud: Price above Kumo (H4/D1), bullish confirmation if 24,300 breaks.
Support/Resistance:
Major Support: 23,500 / 23,750
Major Resistance: 24,300 / 24,750
📈 Indicators Snapshot
RSI (H1): 58 → room to climb before overbought.
Bollinger Bands: Price hugging upper band → momentum bullish, risk of overextension.
VWAP (D1): Holding above daily VWAP → bullish bias intraday.
MA Cross: 50 EMA > 200 EMA (Golden Cross) → swing uptrend intact.
⚡ Intraday Levels & Strategy
🔑 Buy Zone: 23,820 – 23,900 (pullback entry).
🎯 Targets: 24,150 / 24,300 / 24,450.
🛑 Stop Loss: Below 23,700.
⚠️ Bear Trap Alert: A dip under 23,800 with quick rebound signals strong accumulation.
🌀 Swing Trading Levels & Strategy
🔑 Buy Zone: 23,500 – 23,700.
🎯 Medium-Term Targets: 24,600 / 25,000 / 25,500.
🛑 Stop Loss: Below 23,300 (weekly close).
📌 If 24,750 breaks → bullish continuation toward 25,800.
❗ If 23,500 breaks → swing bias shifts bearish to 22,800.
📊 Pattern Watch
🦅 Head & Shoulders invalidated (bullish continuation favored).
🦋 Harmonic Bullish Gartley forming near 23,750 (PRZ zone).
🚨 Watch for Bull Trap above 24,300 → confirmation needed before chasing longs.
🧭 Final Outlook
Intraday Bias: Buy dips toward 23,820–23,900.
Swing Bias: Accumulate above 23,500 for 25,000+.
Market remains buy-the-dip mode while above 23,500.
Risk management 🔑: Keep SL tight as volatility persists.
💡 NAS100 traders should balance intraday momentum with swing accumulation zones. The broader structure favors upside continuation, but resistance at 24,300 must break cleanly for momentum to sustain.
For individuals seeking to enhance their trading abilities based on the analyses provided, I recommend exploring the mentoring program offered by Shunya Trade. (Website: shunya dot trade)
I would appreciate your feedback on this analysis, as it will serve as a valuable resource for future endeavors.
Sincerely,
Shunya.Trade
Website: shunya dot trade
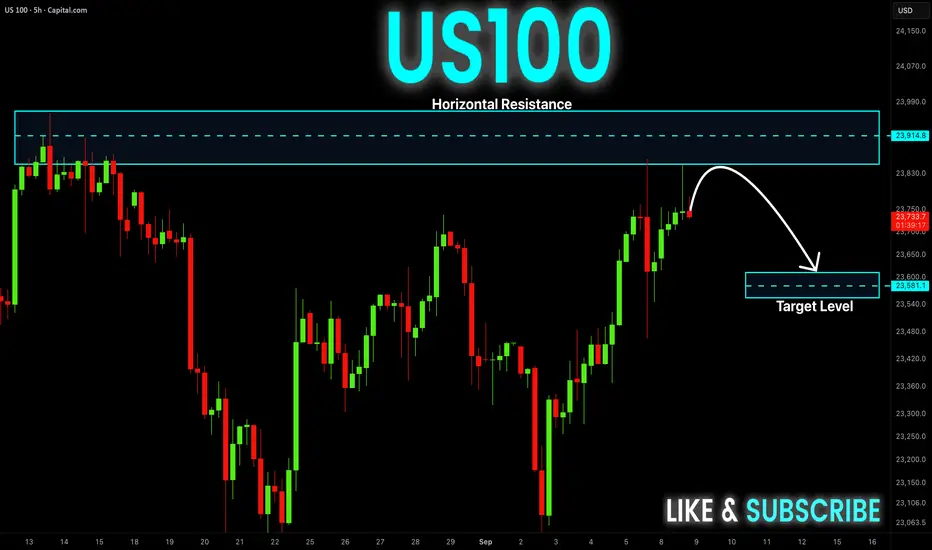
US100 Strong Bullish Bias! Buy!
Hello,Traders!
US100 keep trading in
A strong uptrend and
The index is now trying
To breakout the key
Horizontal level of 23,940
So IF the breakout is
Confirmed we will be
Expecting a further
Bullish move up
Buy!
Comment and subscribe to help us grow!
Check out other forecasts below too!
Disclosure: I am part of Trade Nation's Influencer program and receive a monthly fee for using their TradingView charts in my analysis.

SPX500 - 10% historical gains aheadThe Fed is shifting gears – and history shows what usually follows. Looking back at the past 21 Fed cutting cycles since 1957, the S&P 500 delivered +9.6% average returns within 12 months after the first cut.
This rally wasn’t just luck:
+6.1% from multiple expansion as valuations re-rate higher
+3.5% from earnings growth as financial conditions ease
Technically, the SPX500 has just broken out of consolidation and remains in a strong upward channel. Momentum is aligned with history – positioning the index for another leg higher. 🚀
If history rhymes, we could be looking at double-digit gains over the next year. The risk/reward couldn’t be clearer.
>> The white box shows you what a +10% gain would mean.
👉 Are you positioned for the next Fed-cut bull leg?
Stay safe and happy trading,
Meikel

SPX500 Holds Above 6,527 Ahead of U.S. PPI DataSPX500 – Overview
Global equities rose early Wednesday as bets for a Federal Reserve rate cut next week strengthened after more weak U.S. jobs data. Traders now await the release of U.S. PPI today and CPI tomorrow, which may spark short-term volatility, though few expect them to alter the Fed’s plans.
Technical Outlook:
📈 The index remains in a bullish trend, with potential to set a new ATH near 6,550. A confirmed breakout above this level could open another bullish leg.
📉 To confirm bearish momentum, price would need to close a 1H candle below 6,527, exposing downside targets at 6,518 → 6,506.
Key Levels:
Pivot: 6,527
Resistance: 6,550 – 6,566
Support: 6,518 – 6,506

US100 Resistance Ahead! Sell!
Hello,Traders!
US100 keeps growing
In an uptrend but the
Index will soon hit the
Horizontal resistance
Of 23,970 from where
We will be expecting a
Local bearish correction
Sell!
Comment and subscribe to help us grow!
Check out other forecasts below too!
Disclosure: I am part of Trade Nation's Influencer program and receive a monthly fee for using their TradingView charts in my analysis.
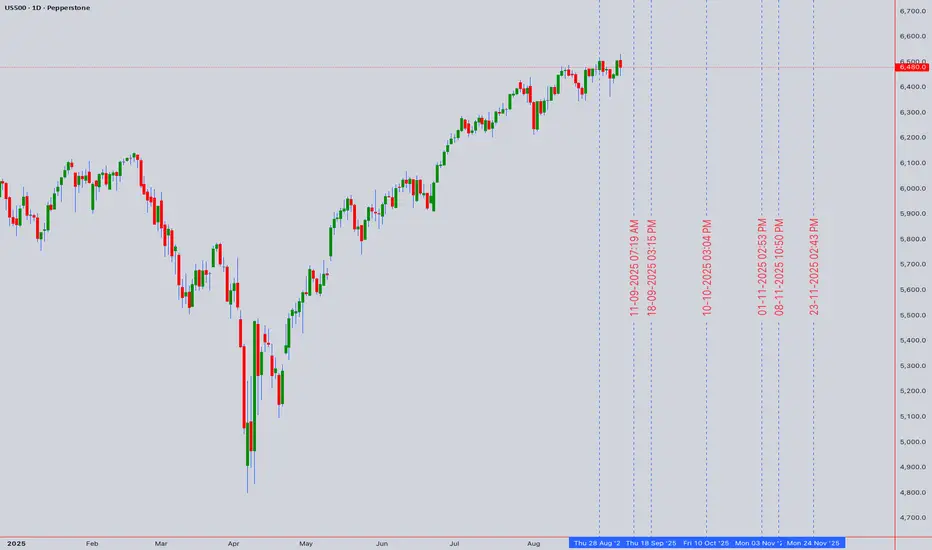
S&P 500 At Critical Juncture - 6,500 Breakout or Major RejectionUS500 Technical Analysis: 🎯 At Critical Juncture - 6,500 Breakout or Major Rejection? ⚖️
Asset: US500 (S&P 500 CFD)
Analysis Date: September 5, 2025
Current Closing Price: 6,480.0 (as of 12:59 AM UTC+4)
Timeframes Analyzed: 1H, 4H, D, W
Executive Summary & Market Outlook 🧐
The US500 is knocking on the door of a historic milestone, trading within striking distance of the 6,500 level. 🚪 This represents a massive psychological and technical barrier. The index is in a strong bullish trend but is displaying classic signs of short-term exhaustion and overextension. The price action here is critical: a decisive breakout could unleash a new wave of buying towards 6,600+, while a rejection could trigger the most significant pullback in weeks. This analysis provides a clear roadmap for intraday traders 🎯 and swing traders 📈 navigating this pivotal moment.
Multi-Timeframe Technical Analysis 🔍
1. Trend Analysis (Daily & 4-Hour Chart):
Primary Trend: 🟢 Bullish. Price is well above all major Daily Moving Averages, which are sloping upwards in bullish alignment.
Short-Term Trend: 🟡 Bullish but Fragile. The rally has been relentless, leaving the price extended and vulnerable to a sharp, news-driven correction.
2. Key Chart Patterns & Theories:
Ascending Wedge / Bull Flag? 🤔: The recent consolidation near the highs could be interpreted as a small bull flag (pausing before breakout) or the end of an ascending wedge (bearish reversal). The next major candle will likely resolve this.
Elliott Wave Theory 🌊: The rally from the last major low is a clear five-wave impulse. We are likely in the final stages of Wave 5. This suggests the completion of a cycle and warns that a larger corrective phase (Wave 4 or A-B-C) is the next probable move. A typical retracement target is the 38.2% Fibonacci level of the entire Wave 3 move.
Ichimoku Cloud (H4/D1) ☁️: Price is trading far above the Cloud on daily charts, confirming the strong bullish trend. However, this also signals a significant over-extension from mean support, increasing mean reversion risk.
Gann Theory ⏳: The 6,500 level is a key psychological and mathematical resistance. A decisive break and close above it could open the path to the next Gann angle target.
3. Critical Support & Resistance Levels:
Resistance (R1): 6,500 - 6,520 (Key Psychological & Technical Ceiling) 🚨
Resistance (R2): 6,600 (Projected Target)
Current Closing Price: ~6,480
Support (S1): 6,400 - 6,420 (Immediate Support & Prior Breakout Zone) ✅
Support (S2) : 6,300 - 6,320 (Major Support - 38.2% Fib & 21-day EMA) 🛡️
Support (S3): 6,200 (50-day EMA & 50% Fib Retracement)
4. Indicator Consensus:
RSI (14-period on 4H/D): Reading is between 68 and 72, signaling overbought conditions. 📛 This warns of weakening momentum and increased downside vulnerability. A bearish divergence on the 4H chart would be a strong short-term sell signal.
Bollinger Bands (4H) 📏: Price is hugging the upper band, a sign of strong momentum. A move back to the middle band (~6,400) would be a healthy and expected development.
Moving Averages: The bullish alignment (EMA8 > EMA21 > EMA50) is perfect. The EMA 21 on the 4H chart acts as dynamic support and is a key level for the bullish thesis.
Volume & VWAP : Volume has been inconsistent on the most recent push higher, a potential bearish divergence 📉 suggesting a lack of strong conviction from large players at these exact levels.
Trading Strategy & Forecast 🎯
A. Intraday Trading Strategy (5M - 1H Charts):
Bearish Scenario (Rejection Play) ⬇️: Given overbought conditions, this is a high-probability setup. Watch for bearish reversal candlestick patterns (e.g., Bearish Engulfing, Evening Star 🌟, Doji) at or near the 6,500 resistance.
Entry: On confirmation of rejection (e.g., a break below a 1H support low).
Stop Loss : Tight, above 6,520.
Target: 6,420 (TP1), 6,400 (TP2).
Bullish Scenario (Breakout Play) ⬆️: If buyers break through with force, wait for a pullback to the breakout level for a better entry.
Entry: On a re-test of 6,500 as new support.
Stop Loss: Below 6,480.
Target: 6,550 (TP1), 6,600 (TP2).
B. Swing Trading Strategy (4H - D Charts):
Strategy: PATIENCE IS KEY. The risk/reward for new long entries at this resistance is poor. 🚫
Ideal Long Zones: A pullback to 6,320 would be an optimal entry to add long positions for the next leg up in the primary bull trend. A shallower pullback to 6,400 could also offer an opportunity. ✅
Bearish Risk: A daily close below 6,300 would signal a deeper correction is underway, potentially targeting the 6,200 support zone.
Risk Management & Conclusion ⚠️
Key Risk Events: High-impact US data (CPI, PPI, NFP) and Fed commentary are paramount. 🔥 The market is highly sensitive to any hint of a shift in monetary policy.
Geopolitical events can also trigger flight-to-safety flows.
Position Sizing: Due to the potential for explosive volatility at this key level, conservative position sizing is non-negotiable. Risk no more than 1% of capital per trade.
Conclusion: The US500 is at a critical inflection point. ⚖️ The bullish trend is intact, but price is exhausted. This is a low-risk-taking zone. Swing traders should be patient for a better entry. Intraday traders can play the range between 6,400 and 6,500 until a decisive break occurs. The most probable outcome is a pullback to recharge before the next major directional move. 📊
Overall Bias: 🟢 Bullish above 6,320 | 🟡 Neutral/Bearish between 6,480-6,500
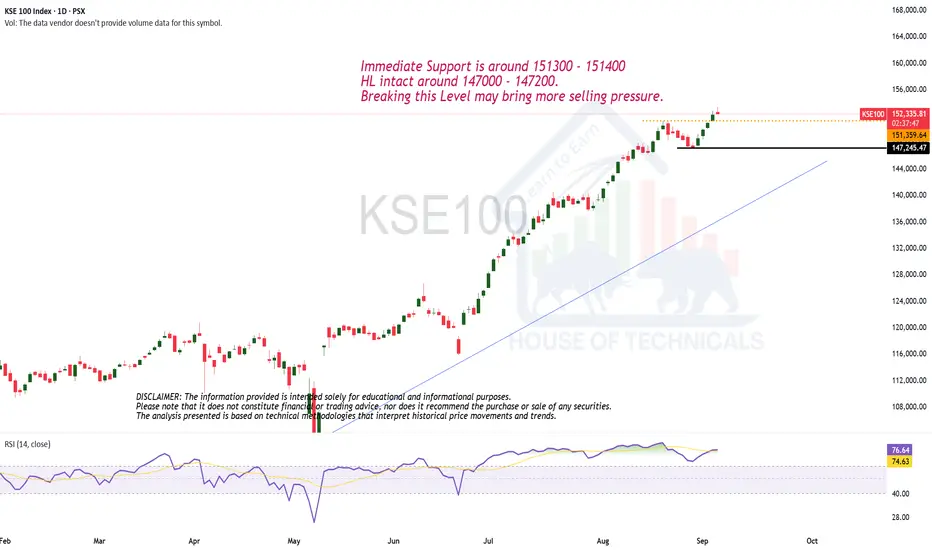
HH HL Still Intact but...Immediate Support is around 151300 - 151400
HL intact around 147000 - 147200.
Breaking this Level may bring more selling pressure.
NIKKEI Rising Support! Buy!
Hello,Traders!
NIKKEI is trading along
The rising support and
The index is going down
Now but as we are bullish
Biased we will be expecting
A bullish rebound and
And a move up after
The retest
Buy!
Comment and subscribe to help us grow!
Check out other forecasts below too!
Disclosure: I am part of Trade Nation's Influencer program and receive a monthly fee for using their TradingView charts in my analysis.

S&P500: Short-Term Pullback Before Next RallyS&P futures initially slipped yesterday but managed to stabilize soon. Our primary outlook is that the ongoing turquoise wave B will continue to move higher, likely topping out just below resistance at 6,675 points. After that, we expect wave C to drive the index directly into the magenta long Target Zone between 6,082 and 5,650 points, where the low of the wave (4) correction should be established. From there, the impulsive wave (5) is expected to begin, pushing the index above the 6,675 points resistance and completing the broader blue wave (III). Alternatively, there is a 35% chance that the index could break out directly above 6,675 points without first reaching the magenta Target Zone. In this scenario, the index would already be forming the alternative wave alt.(5) in magenta.

US INDEX Decisive Moment for next Major MoveThe Dollar has had the bulls and the bears at battle for weeks at the current price action BUT its come to its breaking point where is has to elect a winner BULLS OR BEARS ?
Breaking it down thru each timeframe i believe 98.500 is what we have to break to confirm bullish Rally 103.000-105.000 next targets
On the other hand if we break 97.000 bears have taken over 95.000 next target zone
will look at US30 and EU along w other pairs to see if i can correlate anything

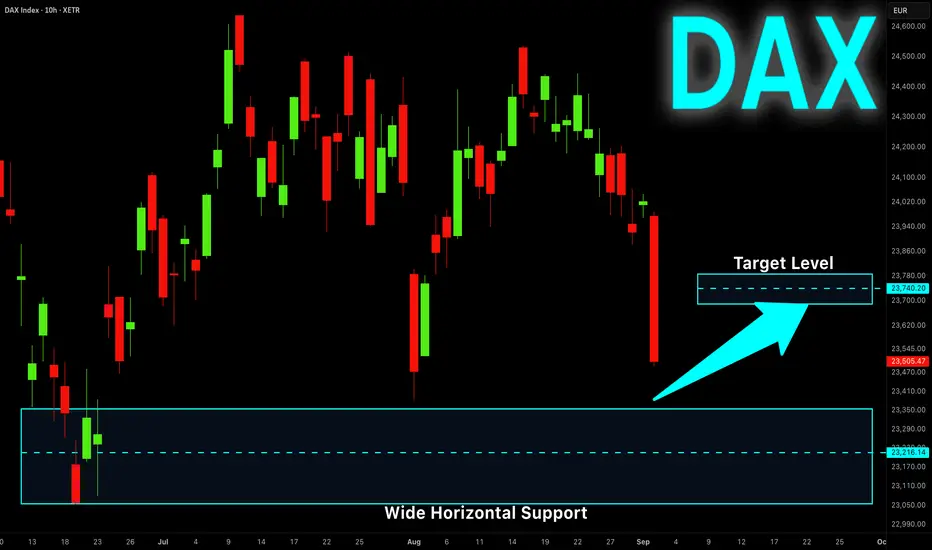
DAX Strong Support Ahead! Buy!
Hello,Traders!
DAX is making a nice
Bearish correction but
The index is generally
In the uptrend and as
The strong horizontal
Demand area is below
Around 23110 from where
We will be expecting a
Bullish rebound and
A move up
Buy!
Comment and subscribe to help us grow!
Check out other forecasts below too!
Disclosure: I am part of Trade Nation's Influencer program and receive a monthly fee for using their TradingView charts in my analysis.
US100 Risky Short! Sell!
Hello,Traders!
US100 made a sharp
Move up and made a
Retest of the horizontal
Resistance of 23,375
From where we will be
Expecting a local bearish
Correction and a move down
Sell!
Comment and subscribe to help us grow!
Check out other forecasts below too!
Disclosure: I am part of Trade Nation's Influencer program and receive a monthly fee for using their TradingView charts in my analysis.

NAS100 LongThis is now oversold on all timeframes, showing sellers exhaustion
There is a deep crab pattern on H4 and H1 displaying a potential reversal zone
There is great support at this level as daily trend is also pointing up
Double bottom on M15 showing divergence
Stoploss of 150 pips

SPY LONG FROM RISING SUPPORT|
✅SPY is trading in an uptrend
Along the rising support line
Which makes me bullish biased
And the index is about to retest the rising support
Thus, a rebound and a move up is expected
With the target of retesting the level above at 650$
LONG🚀
✅Like and subscribe to never miss a new idea!✅
