Technical Analysis Report for the NIFTY 50 INDEX.# NIFTY 50 Technical Analysis: Comprehensive Multi-Timeframe Trading Strategy
Executive Summary
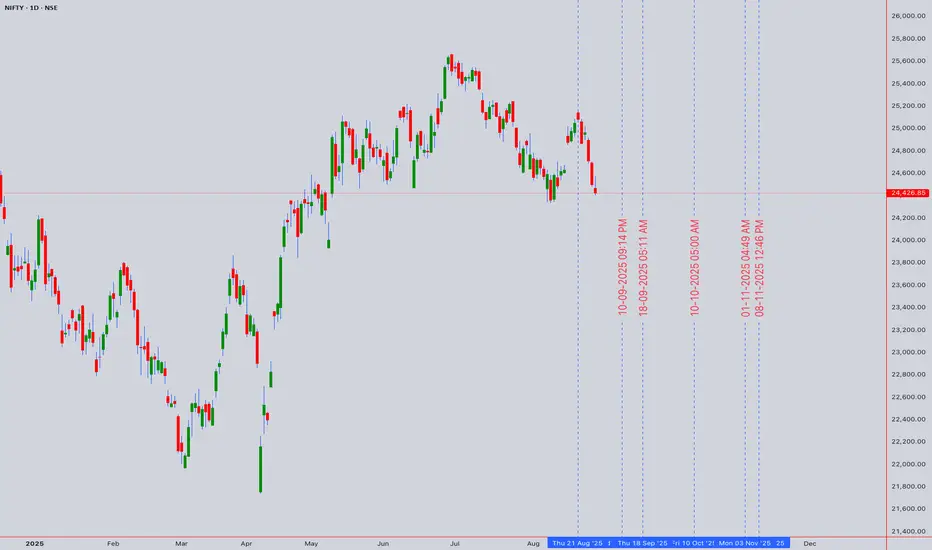
Current Price: 24,433.65 (August 29, 2025, 1:5 PM UTC+4)
Market Sentiment: Cautiously Bullish with Consolidation Bias
Primary Trend: Uptrend with potential for continued advancement
Key Resistance: 25,000 (psychological level and technical confluence)
The NIFTY 50 continues to demonstrate resilience in the face of global uncertainties, maintaining its position above key support levels while approaching significant psychological resistance. The index benefits from accommodative monetary policy with the RBI's recent rate cuts and strong domestic fundamentals, though valuations warrant selective positioning.
Market Context & Fundamental Backdrop
Monetary Policy Environment
The Reserve Bank of India has cut its repo rate by 0.25%, which now stands at 6.25%, marking a significant shift in policy stance. Markets expect the RBI may implement one more 25-bps rate cut in August 2025, especially ahead of the festive season which historically shows multiplier effects on consumer demand.
Economic Fundamentals
India's GDP expanded 7.80 percent in the second quarter of 2025 over the same quarter of the previous year, demonstrating robust economic growth. The RBI expects real GDP to grow 6.5% in FY 2025-26, supported by strong domestic demand and government capital expenditures.
Inflation and Growth Balance
Headline inflation in India is expected to average 4.2% year-on-year in the 2025 calendar year, with food inflation at 4.6% — much lower than estimates of 7%-plus for 2024, thanks to adequate rainfall and good sowing.
Earnings Outlook
Consensus expects 11-12% earnings growth for the Nifty 50 in FY26, with the index trading below 20x price-earnings on FY26 estimates, suggesting reasonable valuations at current levels.
Technical Analysis Framework
Japanese Candlestick Analysis
Weekly Pattern: Spinning top formation indicating indecision at current levels
Daily Pattern: Small-bodied candles with narrow ranges suggesting consolidation
Intraday Patterns: Hammer and doji formations prevalent in 1H and 4H timeframes
Volume Confirmation: Average volume during consolidation phase
Elliott Wave Analysis
Primary Wave Count:
Major Degree: Wave 5 of larger bull market cycle potentially in progress
Intermediate Degree: Subwave 3 of 5 showing extension characteristics
Minor Degree: Currently in subwave 4 correction of intermediate wave 3
Alternative Count: Complex correction (WXY) completion targeting 25,200-25,500
Critical Support: Wave 4 support at 23,800-24,000 maintains bullish structure
Harmonic Pattern Analysis
Active Patterns:
Bullish Gartley: Potential completion zone at 23,950-24,100
ABCD Pattern: Current formation targeting 24,800-25,000
Potential Cypher: Formation developing with D point near 25,100
Fibonacci Analysis:
- 50% retracement of major swing: 24,200
- 38.2% retracement: 24,500 (current consolidation area)
- 1.618 extension target: 24,900-25,000
Wyckoff Method Analysis
Phase Assessment: Accumulation Phase C - Testing supply
Characteristics:
- Volume patterns showing accumulation on weakness
- Price holding above composite operator accumulation zone
- Sign of Strength (SOS) evident on recent advances
Distribution Risk: Monitor for climactic volume above 25,000
W.D. Gann Technical Analysis
# Square of 9 Application
Current Position: 24,433.65 = 156.31° on the Gann wheel
Key Resistance Levels:
- 24,481 (156.5°) - immediate minor resistance
- 24,649 (157°) - intermediate resistance
- 25,000 (158.11°) - major psychological and geometric resistance
Support Levels:
- 24,336 (156°) - immediate support
- 24,025 (155°) - strong support zone
- 23,716 (154°) - major support level
# Time Theory Application
Critical Time Windows:
- September 9-12: 45-degree time angle from recent high
- September 23: Autumn equinox - natural market turning point
- October 8-15: 90-degree time cycle completion
# Price and Time Squaring
Square Root Analysis: √24,433.65 = 156.31
Next Square Levels:
- 157² = 24,649 (key resistance)
- 158² = 24,964 (approaching 25,000)
- 160² = 25,600 (extended target)
Ichimoku Kinko Hyo Analysis
Cloud Configuration:
Tenkan-sen (9): 24,445 - Price slightly below, neutral
Kijun-sen (26): 24,380 - Price above, mild bullish bias
Senkou Span A: 24,412 (cloud top)
Senkou Span B: 24,100 (cloud bottom)
Assessment: Price trading within cloud, indicating consolidation phase with neutral bias pending breakout direction.
Multi-Timeframe Technical Indicator Analysis
5-Minute Chart (Scalping Focus)
RSI(14): 49.2 - Neutral territory with no momentum bias
VWAP: 24,428 - Price oscillating around VWAP
Bollinger Bands: Middle band at 24,430, bands contracting (low volatility period)
Moving Averages: EMA(20) = 24,435, SMA(20) = 24,440
15-Minute Chart (Scalping Focus)
MACD: Near zero line, histogram flat - no clear momentum
Stochastic(14,3,3): 52.1 in neutral zone
Williams %R: -48% indicating no extreme conditions
Volume: Below average, typical for consolidation
Key Intraday Levels:
Resistance: 24,460, 24,490, 24,520
Support: 24,400, 24,370, 24,340
1-Hour Chart (Day Trading)
RSI(14): 54.3 - Slight bullish bias but not overbought
VWAP: 24,415 providing dynamic support
ADX(14): 22.1 indicating weak trend strength (consolidation)
Volume Profile: High volume node at 24,380-24,450
Trading Range:
Upper Boundary: 24,520-24,550
Lower Boundary: 24,320-24,350
Breakout Levels: Above 24,580 (bullish) / Below 24,280 (bearish)
4-Hour Chart (Swing Trading)
RSI(14): 57.8 showing mild bullish momentum
MACD: Positive but flattening, momentum slowing
Bollinger Bands: Price near middle band, bands parallel (range-bound)
Moving Averages: All short-term MAs converging around current price
Swing Levels:
Primary Resistance: 24,650-24,700
Secondary Resistance: 24,900-25,000
Primary Support: 24,200-24,250
Secondary Support: 24,000-24,050
Daily Chart (Position Trading)
RSI(14): 59.4 in bullish territory but not extreme
MACD: Positive with slight bullish divergence
Volume: Consolidation pattern with below-average volume
Pattern: Symmetrical triangle formation approaching apex
Key Daily Levels:
Triangle Resistance: 24,700-24,750 (declining)
Triangle Support: 24,150-24,200 (rising)
Breakout Targets: 25,200 (upside) / 23,600 (downside)
Weekly Chart (Long-term Analysis)
RSI(14): 63.2 showing healthy bullish momentum
MACD: Positive momentum but rate of change slowing
Long-term Trend: Intact uptrend since March 2020 low
Major Resistance: 25,000-25,200 zone
Monthly Chart (Strategic Perspective)
RSI(14): 68.1 approaching overbought levels
Long-term Pattern: Multi-year ascending triangle completion
Major Support: 22,000-22,500 zone
Extended Targets: 26,000-27,000 on sustained breakout
Comprehensive Support and Resistance Analysis
Primary Support Zones
1. 24,380-24,420: Kijun-sen and VWAP confluence zone
2. 24,320-24,350: Previous consolidation low and volume support
3. 24,200-24,250: 50% Fibonacci retracement and psychological level
4. 24,100-24,150: Cloud bottom and structural support
5. 24,000-24,050: Major psychological level and trend line support
6. 23,800-23,900: Elliott Wave 4 support and major trend line
7. 23,600-23,700: Extended support and breakout failure target
Primary Resistance Zones
1. 24,460-24,490: Immediate intraday resistance
2. 24,520-24,580: Short-term resistance and breakout level
3. 24,650-24,700: Triangle resistance and swing high
4. 24,850-24,900: Intermediate resistance zone
5. 24,950-25,000: Major psychological resistance and Square of 9
6. 25,100-25,200: Extended targets and measured moves
7. 25,500-25,800: Long-term bull market targets
Weekly Trading Strategy (September 2-6, 2025)
Monday, September 2, 2025
Market Environment: Post-weekend consolidation, range-bound expected
Primary Strategy: Range trading within established boundaries
Volatility: Low to moderate, typical Monday characteristics
Intraday Setup:
Range: 24,380-24,480
Long Entry: 24,390-24,410
- Stop Loss: 24,360
- Target 1: 24,450 (1:1.5 R/R)
- Target 2: 24,480 (1:2.5 R/R)
Short Entry: 24,470-24,490
- Stop Loss: 24,520
- Target 1: 24,430 (1:1.5 R/R)
- Target 2: 24,400 (1:2.5 R/R)
Swing Consideration: Monitor for breakout preparation above 24,500
Tuesday, September 3, 2025
Market Environment: Increased activity expected, potential trending day
Primary Strategy: Momentum trading with breakout preparation
Key Focus: Volume analysis for sustained directional moves
Trading Scenarios:
Bullish Breakout: Above 24,520 with volume
- Entry: 24,530-24,550
- Stop: 24,480
- Targets: 24,600, 24,650, 24,700
Bearish Breakdown: Below 24,360 with volume
- Entry: 24,350-24,330
- Stop: 24,390
- Targets: 24,280, 24,250, 24,200
Risk Management: Reduce position size by 25% on breakout trades
Wednesday, September 4, 2025
Market Environment: Mid-week volatility, economic data focus
Primary Strategy: News-driven trading with technical confirmation
Event Risk: Monitor for any economic announcements
Scalping Strategy:
High-Frequency Range: 24,400-24,460
Long Scalps: 24,405-24,415, Target: 24,445-24,455
Short Scalps: 24,450-24,460, Target: 24,415-24,425
Stop Loss: Maximum 20 points for scalp trades
Swing Setup: Prepare for potential triangle breakout
Thursday, September 5, 2025
Market Environment: Potential high-volatility day
Primary Strategy: Breakout trading with strong risk management
Focus: Triangle resolution expected
Triangle Breakout Strategy:
Upside Breakout: Above 24,580
- Confirmation: Volume > 1.3x average
- Initial Target: 24,700
- Extended Target: 24,850-24,900
Downside Breakdown: Below 24,280
- Confirmation: Volume > 1.2x average
- Initial Target: 24,150
- Extended Target: 24,000-24,050
Position Management: Trail stops after 50% of target achieved
Friday, September 6, 2025
Market Environment: Weekly settlement, profit-taking likely
Primary Strategy: End-of-week positioning and profit-taking
Focus: Weekly close levels for next week setup
Settlement Strategy:
Bullish Close: Above 24,500 supports next week advance
Neutral Close: 24,350-24,500 maintains consolidation
Bearish Close: Below 24,350 suggests correction risk
Day Trading Approach:
Morning: Follow Thursday's direction initially
Afternoon: Expect consolidation and position adjustments
Last Hour: Avoid large new positions
Risk Management Framework
Position Sizing Guidelines
Risk Per Trade by Timeframe:
5M Scalping: 0.25-0.5% of capital
15M Scalping: 0.5-0.75% of capital
1H Day Trading: 1-1.5% of capital
4H Swing Trading: 1.5-2% of capital
Daily Position Trading: 2-2.5% of capital
Stop Loss Framework
Timeframe-Specific Stops:
5-Minute: 15-25 points maximum
15-Minute: 25-40 points maximum
1-Hour: 40-60 points maximum
4-Hour: 80-120 points maximum
Daily: 150-250 points maximum
Profit-Taking Strategy
Systematic Approach:
Target 1 (40%): 1:1 Risk/Reward
Target 2 (35%): 1:2 Risk/Reward
Target 3 (25%): 1:3+ Risk/Reward
Trailing Stops: Activate after Target 1
Maximum Drawdown Limits
Daily Loss Limit: 3% of trading capital
Weekly Loss Limit: 7% of trading capital
Monthly Loss Limit: 15% of trading capital
Geopolitical and Economic Risk Assessment
Domestic Risk Factors
Monetary Policy:
- RBI rate cut cycle supporting liquidity
- Inflation targeting maintaining credibility
- Banking system stability considerations
Fiscal Policy:
- Government capex supporting growth
- Festive season spending boost expected
- Budget allocation efficiency focus
Corporate Earnings:
- Q2 FY26 earnings season approaching
- Margin pressure from input costs
- Sectoral rotation opportunities
Global Risk Factors
US Federal Reserve Policy:
- Rate cut expectations supporting EM flows
- Dollar weakness benefiting Indian markets
- Global liquidity conditions favorable
China Economic Impact:
- Trade relationship developments
- Commodity price implications
- Regional growth spillover effects
Geopolitical Considerations:
- Regional security stability
- Energy security and pricing
- Trade policy developments
Sector-Specific Risks
Banking & Financial Services:
- Credit growth sustainability
- NPA cycle management
- Interest rate sensitivity
Information Technology:
- Global demand patterns
- Currency hedging strategies
- AI and automation impact
Consumer Discretionary:
- Rural demand recovery
- Festive season performance
- Inflation impact on spending
Sectoral Analysis and Rotation Themes
Outperforming Sectors
1. Banking & Financial Services: Rate cut cycle benefits
2. FMCG: Festive season demand and rural recovery
3. Infrastructure: Government capex and policy support
4. Pharmaceuticals: Export competitiveness and domestic growth
Underperforming Sectors
1. Information Technology: Global demand concerns
2. Metals & Mining: Commodity price volatility
3. Real Estate: Interest rate sensitivity despite cuts
4. Telecommunications: Competitive pressure and capex burden
Rotation Indicators
Growth vs Value: Favoring quality growth at reasonable prices
Large Cap vs Mid/Small Cap: Large cap leadership maintained
Domestic vs Export: Domestic consumption themes outperforming
Advanced Technical Patterns
Ichimoku Trading Signals
Current Setup: Price within cloud, neutral bias
Bullish Trigger: Break above Tenkan-sen with volume
Bearish Trigger: Break below cloud with momentum
Long-term View: Future cloud remains bullish
Gann-Based Strategies
Square of 9 Trades:
- Long: 155° (24,025) targeting 158° (24,964)
- Short: 158° (24,964) targeting 155° (24,025)
- Time Cycles: September 9-12 reversal window
Wyckoff Phase Trading
Current Phase: Accumulation Phase C
Next Phase: Markup expected on successful test
Volume Confirmation: Key for phase transition
Distribution Risk: Monitor above 25,200
Market Microstructure Analysis
Algorithmic Trading Impact
High-Activity Zones: 24,000, 24,500, 25,000 levels
Optimal Entry Times: 9:15-9:45 and 14:30-15:15 IST
Liquidity Patterns: Reduced depth during lunch hours
Order Flow Considerations
Institutional Activity: Accumulation evident below 24,400
FII Flows: Recent buying supporting current levels
DII Participation: Consistent buying on weakness
Technology and Tools Integration
Recommended Platforms
1. TradingView: Advanced charting and technical analysis
2. Zerodha Kite: Real-time execution and portfolio management
3. Bloomberg Terminal: Comprehensive market data and news
4. Refinitiv Workspace: Fundamental analysis integration
Alert Configuration
Price Alerts:
- Triangle breakout: 24,580 (up) / 24,280 (down)
- Psychological levels: 24,500, 25,000
- Support/resistance: 24,200, 24,700
Volume Alerts:
- Unusual volume spikes (>150% average)
- Block deal notifications
- Institutional flow changes
Seasonal and Calendar Considerations
Festive Season Impact
Indian markets are entering the 4-month-long festive season from September, which historically shows positive performance. This period typically sees:
- Increased consumer spending
- Corporate bonus distributions
- Portfolio rebalancing by institutions
- Higher retail participation
Economic Calendar
Key Events:
- RBI Monetary Policy (likely September 17)
- Q2 FY26 GDP data (October/November)
- Inflation data (monthly releases)
- FII/DII flow data (weekly)
Holiday Calendar
- Ganesh Chaturthi (September 7) - Market closed
- Dussehra (October 12) - Market closed
- Diwali (November 1) - Market closed
- Guru Nanak Jayanti (November 15) - Market closed
Conclusion and Strategic Outlook
The NIFTY 50 stands at a critical juncture, consolidating near significant resistance levels while benefiting from supportive monetary and fiscal policies. The technical picture suggests a healthy consolidation phase that could resolve in favor of further upside, particularly given the approaching festive season and improving economic fundamentals.
Key Investment Themes:
1. Triangle Resolution: Current consolidation likely to resolve with directional clarity
2. Festive Season Tailwinds: Historical patterns favor bullish bias into year-end
3. Rate Cut Benefits: Lower rates supporting equity valuations and credit growth
4. Earnings Growth: Expected double-digit growth supporting index advancement
Trading Strategy Priorities:
- Focus on triangle breakout trades with volume confirmation
- Favor range trading until clear directional break
- Maintain disciplined risk management given elevated levels
- Prepare for increased volatility around key events
Medium-term Outlook (1-3 months):
The combination of accommodative monetary policy, strong GDP growth, controlled inflation, and seasonal tailwinds provides a constructive backdrop for Indian equities. Technical analysis suggests potential for advancement toward 25,500-26,000 on sustained breakout above current resistance.
Risk Management Focus:
- Triangle breakdown below 24,280 could target 24,000-23,800
- Global risk-off sentiment remains key external risk
- Valuation concerns at higher levels warrant selectivity
- Currency stability important for FII flow continuation
The analysis incorporates multiple technical methodologies while acknowledging the strong fundamental backdrop supporting Indian markets. Traders should remain flexible and prepared for both continuation and reversal scenarios while maintaining strict adherence to risk management protocols.
---
*This comprehensive analysis combines technical and fundamental factors to provide actionable trading strategies. All recommendations should be implemented within individual risk tolerance parameters and current market conditions. Market dynamics can change rapidly, requiring continuous monitoring and strategy adjustments.*
Index
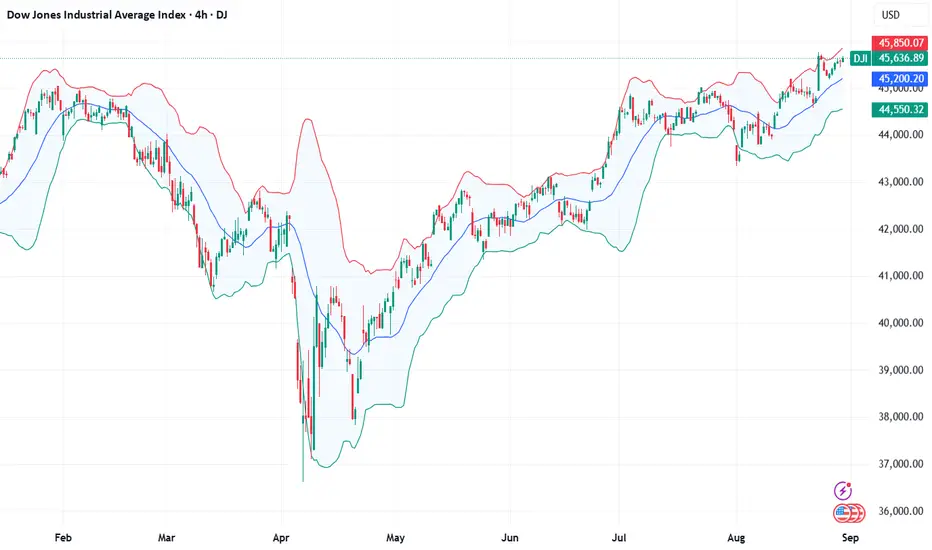
#DJI30 hits record highs: The index just made history!On August 22, 2025, the #DJI30 surged past 45,700, setting a new all-time high. The rally was fueled by growing expectations of a Fed rate cut, with cheap money once again making stocks attractive. Strong earnings reports from industrial and banking sectors, along with new White House infrastructure investment plans, added to the bullish sentiment. A solid labor market and resilient consumer activity continue to ease recession fears, prompting capital to flow out of volatile assets and into blue-chip stocks. As a result, #DJI30 posted a powerful breakout and reinforced its role as a key barometer of U.S. economic strength.
Why the #DJI30 rally may still have room to run:
Easing Fed policy: Lower rates and controlled inflation create favorable conditions for borrowing and investing.
U.S. infrastructure expansion: Government spending on transport, energy, and digitalization supports real-sector companies — the core of #DJI30.
Strong corporate earnings & dividends: Many Dow components offer reliable dividends, making the index attractive amid broader market volatility.
Shift from risky assets: Funds and individual investors are rotating out of crypto and growth stocks into more stable “industrial giants.”
U.S. geopolitical resilience: Despite global tensions, the U.S. remains a “safe haven” for investors, boosting demand for American equities.
The continued rise of #DJI30 is underpinned by robust corporate profitability and the overall resilience of the U.S. economy. The latest earnings season confirmed the strength of major industrial and financial players, while easing inflation and expectations of a Fed rate cut provide a supportive backdrop. #DJI30 remains a reliable gauge of market stability and investor risk appetite worldwide. According to FreshForex, this opens a window of opportunity for long positions on #DJI30.
All eyes on the PCE todayWatching the US dollar reaction carefully today.
TVC:DXY
MARKETSCOM:DOLLARINDEX
Let us know what you think in the comments below.
Thank you.
75.2% of retail investor accounts lose money when trading CFDs with this provider. You should consider whether you understand how CFDs work and whether you can afford to take the high risk of losing your money. Past performance is not necessarily indicative of future results. The value of investments may fall as well as rise and the investor may not get back the amount initially invested. This content is not intended for nor applicable to residents of the UK. Cryptocurrency CFDs and spread bets are restricted in the UK for all retail clients.

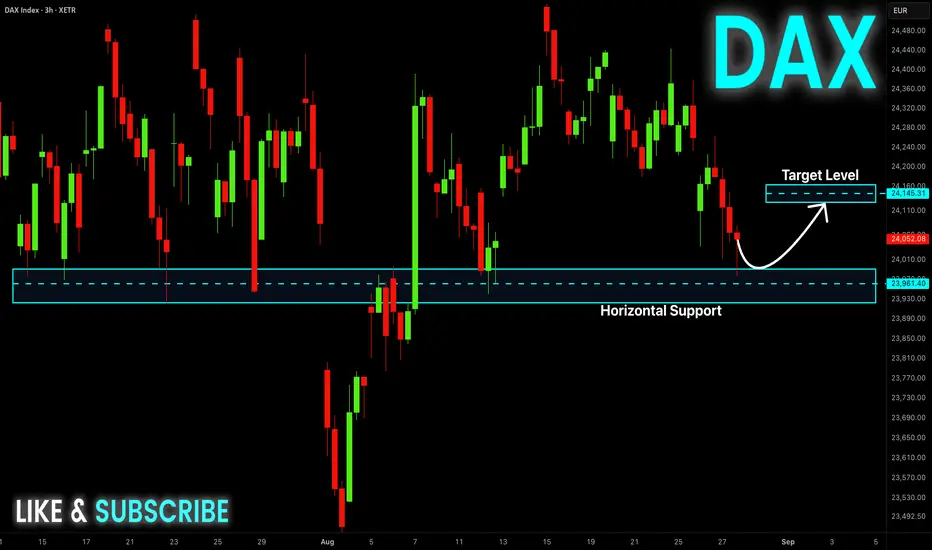
DAX Move Up Ahead! Buy!
Hello,Traders!
DAX is etching closer
Towards the horizontal
Support 23,930 so after
The retest we will be
Expecting a bullish move up
Buy!
Comment and subscribe to help us grow!
Check out other forecasts below too!
Disclosure: I am part of Trade Nation's Influencer program and receive a monthly fee for using their TradingView charts in my analysis.
SNP500 ShortThis is against the H4 trend; however there is very good resistance at this level, as it is the all-time high and contesting the previous week's high.
There is a pattern on M15 to show a potential reversal zone.
Multiple tops on M15 to H1 with divergence and showing the trends flattening out.
This is against the trend so look to get out at M15 oversold

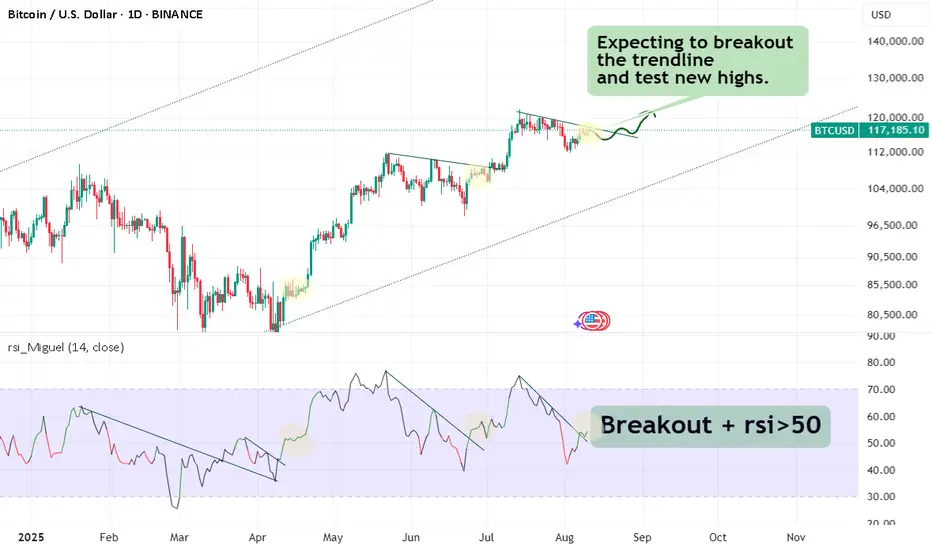
The Dollar's Descent: Understanding Historic WeaknessThe U.S. dollar, long considered the world's premier reserve currency and a symbol of American economic might, finds itself in unprecedented territory as it continues to hover near all-time lows against a basket of major currencies. This sustained weakness represents more than just a numerical decline on foreign exchange charts; it signals a fundamental shift in global economic dynamics, monetary policy effectiveness, and international confidence in American fiscal management. The implications of this historic depreciation extend far beyond currency traders and central banks, touching everything from household purchasing power to geopolitical relationships and the future architecture of the global financial system.
The current situation represents a culmination of multiple converging factors that have been building over several years. The dollar's decline hasn't occurred in isolation but rather as part of a complex interplay between domestic fiscal policies, international trade dynamics, shifting reserve currency preferences, and evolving global economic power structures. Understanding this phenomenon requires examining not just the immediate catalysts but also the deeper structural changes that have eroded the dollar's traditional sources of strength.
The Anatomy of the Dollar's Decline
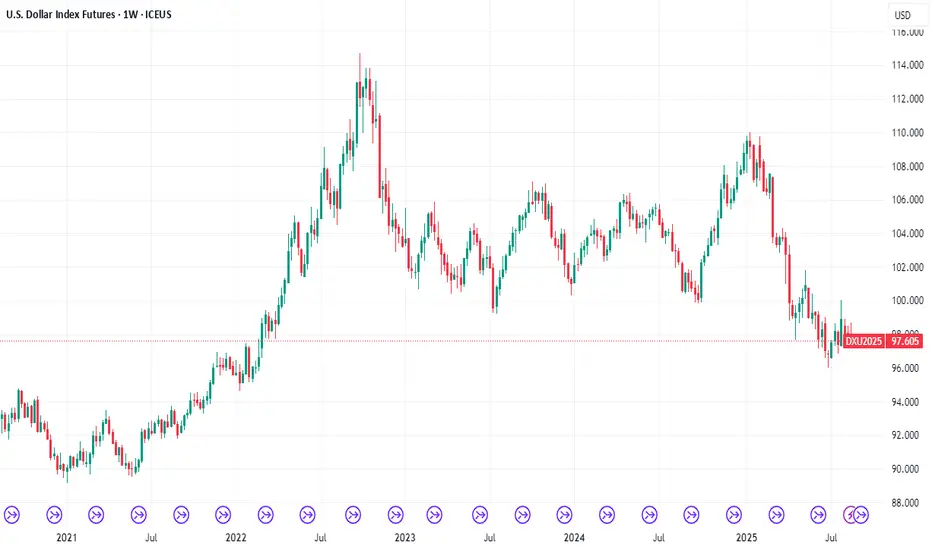
The measurement of the dollar's value against other currencies typically relies on the U.S. Dollar Index (DXY), which tracks the greenback against a weighted basket of six major currencies: the euro, Japanese yen, British pound, Canadian dollar, Swedish krona, and Swiss franc. When analysts refer to the dollar approaching all-time lows, they're observing a sustained depreciation that has pushed this index to levels not seen in decades, with some bilateral exchange rates reaching historic extremes.
The technical aspects of this decline reveal a currency under persistent selling pressure. Foreign exchange markets, which trade over six trillion dollars daily, have witnessed consistent dollar weakness across multiple timeframes and against virtually all major and emerging market currencies. This broad-based depreciation suggests that the issue isn't merely tactical positioning by traders but reflects fundamental concerns about the dollar's intrinsic value and future trajectory.
Several immediate factors have contributed to this weakness. The Federal Reserve's monetary policy stance, particularly its approach to interest rates and quantitative easing, has played a crucial role. While other central banks have moved more aggressively to combat inflation or support their currencies, the Fed's policies have often prioritized domestic economic stability over currency strength. This divergence in monetary policy has created interest rate differentials that make holding dollars less attractive relative to other currencies offering higher yields.
The massive fiscal stimulus measures implemented in recent years have also weighed heavily on the dollar. The expansion of the federal deficit and the dramatic increase in the national debt have raised questions about the long-term sustainability of American fiscal policy. International investors, who must consider currency risk when purchasing U.S. assets, have grown increasingly concerned about the potential for future dollar depreciation as a means of reducing the real burden of this debt.
Trade dynamics have further complicated the dollar's position. The persistent U.S. trade deficit means that more dollars flow out of the country to purchase foreign goods than flow in from exports. This structural imbalance creates constant selling pressure on the dollar as these funds are converted into other currencies. Additionally, the weaponization of the dollar through sanctions and financial restrictions has prompted some nations to seek alternatives for international trade settlement, reducing demand for dollars in global commerce.
Historical Context and Precedents
To fully appreciate the significance of the dollar's current weakness, it's essential to examine historical precedents and the evolution of the dollar's role in the global economy. The Bretton Woods system, established in 1944, positioned the dollar as the world's primary reserve currency, backed by gold and serving as the anchor for international monetary stability. When this system collapsed in 1971, the dollar transitioned to a fiat currency, deriving its value from the strength of the U.S. economy and the confidence of global markets rather than gold reserves.
Throughout its modern history, the dollar has experienced several significant periods of weakness. The stagflation of the 1970s saw the dollar lose considerable value as inflation soared and economic growth stagnated. The Plaza Accord of 1985 deliberately weakened the dollar to address trade imbalances, demonstrating that currency depreciation could be a policy tool rather than merely a market outcome. The financial crisis of 2008 triggered another period of dollar weakness as the Federal Reserve implemented unprecedented monetary easing.
However, the current situation differs from these historical episodes in several important ways. Previous periods of dollar weakness often occurred within a framework where the dollar's fundamental role as the global reserve currency remained unchallenged. Today, that supremacy faces genuine competition from alternative currencies and payment systems. The rise of the euro, the internationalization of the Chinese yuan, and the emergence of digital currencies all represent potential challenges to dollar hegemony that didn't exist during previous cycles of weakness.
The geopolitical context has also shifted dramatically. During past periods of dollar weakness, the United States maintained relatively stable relationships with its major trading partners and allies. Current tensions, trade disputes, and the fragmentation of the global economy into competing blocs have created an environment where dollar alternatives are not just economically viable but politically desirable for some nations. This represents a structural change that could make the current period of weakness more persistent and potentially irreversible in some respects.
Global Economic Implications
The ramifications of the dollar's sustained weakness extend throughout the global economy, creating both opportunities and challenges for different stakeholders. For American consumers, a weaker dollar translates directly into reduced purchasing power for imported goods. Everything from electronics to clothing to automobiles becomes more expensive as the dollar's depreciation increases the cost of foreign-produced items. This imported inflation adds to domestic price pressures, potentially eroding living standards and complicating monetary policy decisions.
American businesses face a mixed picture. Exporters benefit from a competitive advantage as their goods become relatively cheaper in foreign markets, potentially boosting sales and market share. Multinational corporations with significant overseas earnings see those profits translate into more dollars when repatriated, improving their financial results. However, companies reliant on imported inputs face higher costs, and those with international supply chains must navigate increased complexity and currency risk.
The impact on financial markets has been profound and multifaceted. Equity markets have shown remarkable resilience, with some sectors benefiting from the currency tailwind to earnings. However, bond markets face challenges as foreign investors demand higher yields to compensate for currency risk, potentially increasing borrowing costs for the U.S. government and corporate issuers. Commodity markets, traditionally priced in dollars, have seen significant price increases as the weakening currency makes raw materials more expensive in dollar terms.
For emerging markets, the dollar's weakness presents both opportunities and risks. Countries with dollar-denominated debt benefit from the reduced real burden of their obligations, providing fiscal relief and potentially enabling increased domestic investment. However, those nations that have traditionally relied on dollar stability for their own monetary frameworks face uncertainty and potential instability. The shift away from dollar dependence requires careful management and potentially painful adjustments to monetary and fiscal policies.
Developed economies have responded to the dollar's weakness in various ways. The European Union has seen the euro strengthen significantly, creating challenges for European exporters but providing relief from imported inflation. Japan faces particular difficulties as yen strength threatens its export-dependent economy, prompting potential intervention in currency markets. These dynamics have strained international cooperation and raised the specter of competitive devaluations reminiscent of the 1930s.
The Reserve Currency Question
Perhaps the most significant long-term implication of the dollar's sustained weakness concerns its status as the world's primary reserve currency. This privileged position has provided the United States with what former French Finance Minister Valéry Giscard d'Estaing called an "exorbitant privilege" – the ability to borrow in its own currency, maintain persistent trade deficits, and exercise significant influence over global financial conditions.
The erosion of confidence in the dollar threatens this special status. Central banks worldwide have been gradually diversifying their reserves away from dollars, increasing holdings of gold, euros, yuan, and other assets. While the dollar still accounts for the majority of global reserves, its share has been declining steadily. This trend, if it continues, could fundamentally alter the global financial architecture and reduce American influence over international economic affairs.
The search for alternatives has accelerated in recent years. The Chinese yuan's inclusion in the International Monetary Fund's Special Drawing Rights basket marked a significant milestone in its internationalization. Digital currencies, both central bank digital currencies and cryptocurrencies, offer potential alternatives for international trade settlement and value storage. Regional payment systems and bilateral currency swap agreements have proliferated, creating pathways for trade that bypass the dollar entirely.
However, the transition away from dollar dominance faces significant obstacles. The depth and liquidity of U.S. financial markets remain unmatched, providing essential infrastructure for global finance. The rule of law, property rights protection, and regulatory framework in the United States continue to attract international investment despite currency concerns. No single alternative currency currently possesses all the attributes necessary to fully replace the dollar's multifaceted role in the global economy.
Policy Responses and Future Scenarios
Policymakers face difficult choices in responding to the dollar's weakness. Traditional approaches to currency support, such as raising interest rates or intervening in foreign exchange markets, carry significant economic costs and may prove ineffective against structural pressures. The Federal Reserve must balance its domestic mandate for price stability and full employment with the international implications of its policies, a task made more complex by the dollar's global role.
Fiscal policy presents another set of challenges and opportunities. Addressing the structural factors undermining dollar confidence would require difficult decisions about spending, taxation, and debt management. Political polarization and competing economic priorities make comprehensive fiscal reform challenging, yet the consequences of inaction could be severe. The possibility of a dollar crisis, while still remote, has moved from the realm of theoretical speculation to a risk requiring serious contingency planning.
International cooperation could play a crucial role in managing the transition to a new monetary order. Multilateral agreements on exchange rate management, similar to but more flexible than the Bretton Woods system, might provide stability during a period of adjustment. However, the current geopolitical climate makes such cooperation difficult to achieve. The fragmentation of the global economy into competing blocs may accelerate the development of alternative currency systems, further undermining the dollar's position.
Looking ahead, several scenarios could unfold. A gradual, managed decline in the dollar's dominance might allow for smooth adjustment to a multipolar currency system, with several major currencies sharing reserve status. This outcome would require careful coordination and policy discipline from major economies. Alternatively, a more chaotic transition could occur if confidence in the dollar erodes rapidly, potentially triggering financial instability and economic disruption.
The technological revolution in finance adds another dimension of uncertainty. Central bank digital currencies could reshape international monetary relations in ways that are difficult to predict. The adoption of blockchain technology and smart contracts might enable new forms of international trade settlement that don't require traditional reserve currencies. These innovations could either accelerate the dollar's decline or, if led by the United States, potentially reinforce its position through digital dominance.
Conclusion: Navigating Uncharted Waters
The dollar's hover near all-time lows represents more than a cyclical fluctuation in currency markets; it signals a potential inflection point in the global economic order. The convergence of fiscal pressures, monetary policy challenges, geopolitical tensions, and technological disruption has created conditions unlike any previously experienced in the modern era of fiat currencies. The implications extend beyond exchange rates to encompass fundamental questions about economic governance, international cooperation, and the distribution of global economic power.
For investors, businesses, and policymakers, navigating this environment requires careful consideration of both immediate risks and long-term structural changes. Hedging strategies, diversification approaches, and policy frameworks developed during periods of dollar strength may prove inadequate in a world where the greenback's supremacy can no longer be assumed. The ability to adapt to multiple possible futures, rather than betting on a single outcome, becomes essential for managing risk and capturing opportunities.
The social and political implications of the dollar's decline deserve equal attention to the economic aspects. Currency strength has long been intertwined with national prestige and political power. A sustained period of dollar weakness could reshape domestic politics, alter international alliances, and influence the trajectory of globalization itself. The psychological impact of losing reserve currency status, should it occur, would reverberate through American society in ways that extend far beyond financial markets.
As the world watches the dollar's trajectory with a mixture of concern and opportunism, the need for thoughtful analysis and measured response becomes paramount. The current situation demands neither panic nor complacency but rather a clear-eyed assessment of changing realities and proactive adaptation to new circumstances. The dollar's decline may mark the end of one era and the beginning of another, but the nature of that new era remains to be written by the collective actions of governments, markets, and societies worldwide.
The path forward will likely be characterized by increased volatility, structural adjustments, and the gradual emergence of new monetary arrangements. Whether this transition enhances global economic stability or triggers periodic crises will depend largely on the wisdom and cooperation of global leaders. The dollar's current weakness serves as both a warning and an opportunity – a signal that the old order is passing and a chance to build something better in its place. The challenge lies in managing this transition while maintaining the stability and prosperity that the dollar-based system, despite its flaws, has helped facilitate for decades.
In this context, the dollar's hover near all-time lows should be understood not as an isolated phenomenon but as part of a broader transformation of the global economy. The outcomes of this transformation remain uncertain, but its importance cannot be overstated. The decisions made in response to the dollar's weakness will shape international economic relations for generations to come, making this one of the most consequential periods in modern monetary history.
DAX is forming an interesting short-term patternLooking at the technical picture of DAX, we can see that the German index seems to be preparing for a breakout. Maybe Powell's speech could be that catalyst? Let's find out.
XETR:DAX
MARKETSCOM:DE30
Let us know what you think in the comments below.
Thank you.
75.2% of retail investor accounts lose money when trading CFDs with this provider. You should consider whether you understand how CFDs work and whether you can afford to take the high risk of losing your money. Past performance is not necessarily indicative of future results. The value of investments may fall as well as rise and the investor may not get back the amount initially invested. This content is not intended for nor applicable to residents of the UK. Cryptocurrency CFDs and spread bets are restricted in the UK for all retail clients.

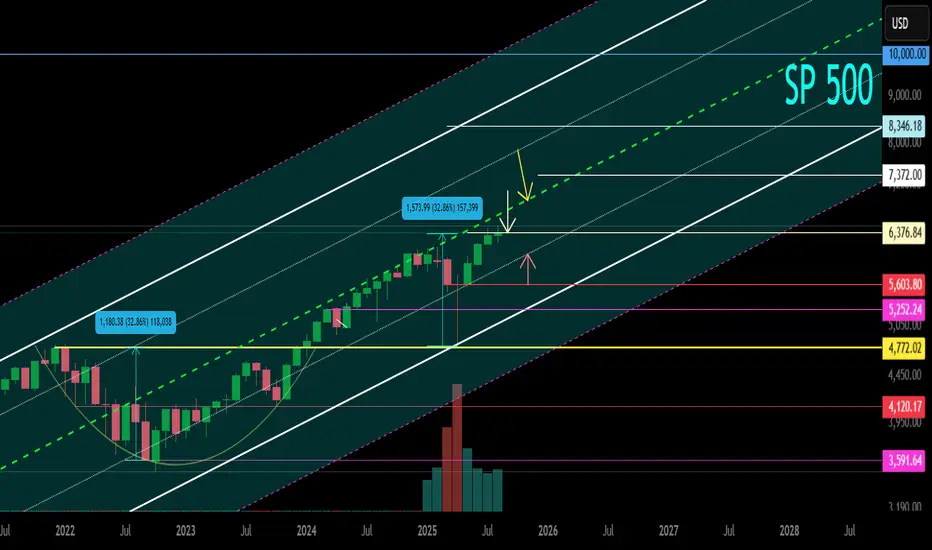
SP500 Secondary trend. Part of the channel. Reversal zone. 2025 Logarithm. Time frame 1 month (less is not necessary). The SP500 index primarily reflects the "health" of the American stock market and the economy as a whole. This is reflected in all markets by the domino effect.
Now, after a huge takeout and recovery, the price is at the maximums of the local trend that has formed, and this is also the maximum of the index as a whole for its entire 100-year existence (before displaying on the chart).
🔄 Locally, the price has run into the resistance of the median of the ascending channel (green dotted line). Now the resistance level of this zone will be formed.
🟢 A breakout of this zone upwards - an exit above the median, promises strong growth and pumping of the stock market as a whole.
🔴 And the reverse process is not a breakthrough and not a consolidation above this zone - consolidation in the range under resistance and above the dynamic support of the internal channel. An extremely negative case is a decline in the lower zone of the channel.
🧠 The chart as a whole shows the channel range itself. Including on both sides, price slippage zones (low probability), as well as key support / resistance levels of this secondary trend that exist, and those that will be formed in the future, but will be key for the development of the trend. This can be an addition to the analysis and formation of tactics and money management in other markets, including cryptocurrency.
NIKKEI Rebound Ahead! Buy!
Hello,Traders!
NIKKEI is trading in a
Strong uptrend and the
Index is making a retest
Of the horizontal support
Level of 42,138 from where
We will be expecting a local
Bullish rebound
Buy!
Comment and subscribe to help us grow!
Check out other forecasts below too!
Disclosure: I am part of Trade Nation's Influencer program and receive a monthly fee for using their TradingView charts in my analysis.

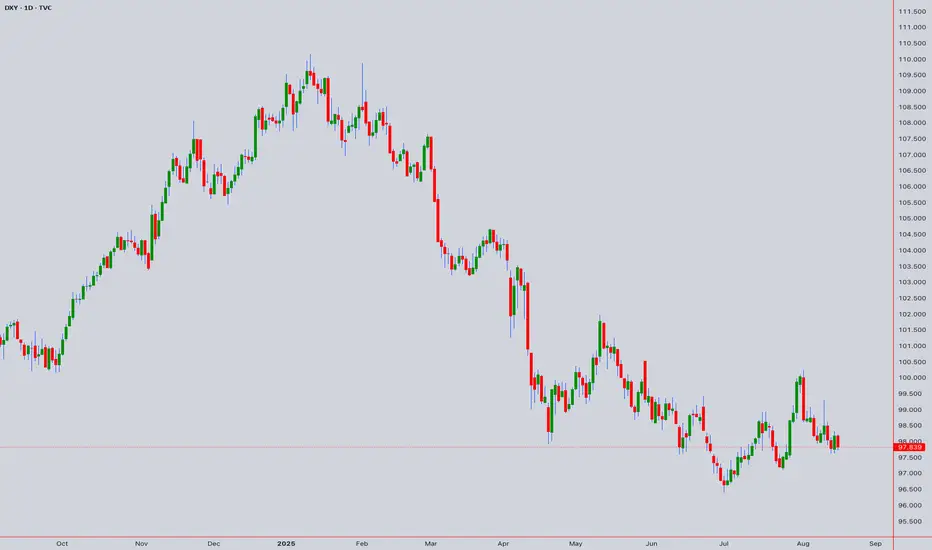
# DXY (US Dollar Index) Technical Analysis & Forecast# DXY (US Dollar Index) Technical Analysis & Forecast
**Base Price:** 97.839 (August 16, 2025 - 12:55 AM)
## Executive Summary
The DXY at 97.839 shows the USD in a consolidation phase near key technical levels. Multiple analytical frameworks converge around critical support/resistance zones, suggesting an imminent directional breakout within the next trading sessions.
## Japanese Candlestick Analysis
### Intraday Patterns (5M-1H)
- **Current Formation:** Doji-like indecision around 97.85 level
- **Key Reversal Zones:** 97.50 (Hammer potential), 98.20 (Shooting Star zone)
- **Momentum Candles:** Watch for Marubozu above 98.00 or below 97.60
- **Evening Star Setup:** Three-candle reversal pattern completion around 98.15
- **Morning Star Potential:** Bullish reversal signal near 97.45 support
### Swing Patterns (4H-Monthly)
- **Engulfing Patterns:** Critical at 98.50 weekly resistance and 97.00 monthly support
- **Harami Cross:** Indecision pattern suggesting range-bound action
- **Piercing Line/Dark Cloud:** Key reversal patterns at major S/R levels
- **Three White Soldiers:** Bullish continuation above 98.00
- **Three Black Crows:** Bearish breakdown below 97.50
## Harmonic Pattern Analysis
### M & W Formations
- **Double Top (M):** Resistance confluence at 98.80-99.00 zone
- **Neckline:** Critical break level at 97.25 for M-pattern completion
- **Double Bottom (W):** Support structure around 96.50-96.80
- **W-Pattern Target:** Bullish objective at 99.20-99.50 on completion
- **Measured Move:** M-top target 96.00, W-bottom target 99.00
### ABCD Pattern Analysis
- **Bullish ABCD:** Current structure suggests C-point at 97.20, D-target 99.80
- **Bearish ABCD:** Alternative count with D-wave completion at 96.20
- **AB=CD Equality:** Time and price symmetry around 98.25 pivot
- **Extension Ratios:**
- 127.2% extension at 99.45
- 161.8% extension at 100.20
- 200% extension at 101.50
## Elliott Wave Analysis
### Primary Count
- **Current Position:** Wave 4 correction of larger degree impulse from 94.50
- **Wave Structure:**
- Wave 1: 94.50 → 96.80
- Wave 2: 96.80 → 95.20
- Wave 3: 95.20 → 98.90
- Wave 4: 98.90 → 97.20 (current)
- Wave 5 Target: 100.50-101.20
### Alternative Count
- **ABC Correction:** Large degree correction from 105.00 highs
- **A-Wave:** 105.00 → 100.80
- **B-Wave:** 100.80 → 99.20 (current)
- **C-Wave Target:** 94.00-95.50
### Time Projections
- **Wave 4 Completion:** 3-5 trading days
- **Wave 5 Duration:** 8-13 days
- **Cycle Completion:** 21-34 days
## Wyckoff Analysis
### Market Structure
- **Phase:** Late accumulation or early distribution
- **Trading Range:** 97.00-99.00 (established range)
- **Point of Support (PS):** 97.20 level
- **Secondary Test (ST):** Current price action around 97.85
- **Sign of Strength (SOS):** Break above 98.50 with volume
- **Last Point of Support (LPS):** Final test around 97.40
### Volume Characteristics
- **Accumulation Signals:** High volume on declines, low volume on rallies
- **Distribution Signals:** High volume on rallies, climactic action above 98.50
- **No Demand:** Weak rallies with declining volume
- **Stopping Volume:** Heavy volume at support levels
## W.D. Gann Theory Analysis
### Time Theory
- **Natural Cycles:** 30, 60, 90, 120-day cycles active
- **Anniversary Dates:** Previous major highs at 105.00 (time squares)
- **Seasonal Pattern:** USD strength typically in Q3-Q4
- **Time Windows:**
- Minor: 7-10 days
- Intermediate: 21-30 days
- Major: 90-120 days
### Square of 9 Analysis
- **Current Position:** 97.839 sits at 347° on the wheel
- **Key Angles:**
- 0°/360°: 98.00 (major resistance)
- 45°: 97.20 (support)
- 90°: 98.80 (resistance)
- 180°: 96.40 (major support)
- 270°: 99.60 (major resistance)
### Price Targets from Square
- **Bullish Targets:** 98.44, 99.25, 100.69
- **Bearish Targets:** 97.21, 96.49, 95.36
### Angle Theory
- **1x1 Angle:** Primary trendline from 94.50 low at 97.60
- **2x1 Angle:** Acceleration line at 98.20
- **1x2 Angle:** Support line at 97.00
- **Fan Lines:** Multiple confluence zones at 97.25, 98.15, 99.05
### Squaring Price and Time
- **Price Squares:** 97.00, 98.00, 99.00, 100.00
- **Time Squares:** 144 hours (6 days), 233 hours (10 days)
- **Geometric Harmony:** 50% level at 97.50, 62% at 98.10
## Ichimoku Kinko Hyo Analysis
### Cloud (Kumo) Analysis
- **Current Position:** Price trading above cloud (bullish bias)
- **Cloud Support:** 97.20-97.40 zone
- **Future Cloud:** Bearish twist in 26 periods around 98.60
- **Cloud Thickness:** Medium strength S/R levels
### Signal Line Analysis
- **Tenkan-sen (9):** 97.75 - short-term momentum line
- **Kijun-sen (26):** 97.55 - medium-term trend line
- **Senkou Span A:** 97.65 (leading span)
- **Senkou Span B:** 97.30 (leading span)
- **Chikou Span:** Confirming current price action strength
### Trading Signals
- **TK Cross:** Tenkan above Kijun (weak bullish)
- **Price vs Kijun:** Above baseline (bullish bias)
- **Cloud Break:** Monitor 97.20 break for bearish signal
## Technical Indicators Analysis
### RSI (Relative Strength Index)
- **14-Period RSI:** 52.8 (neutral zone)
- **Overbought Level:** >70 (watch 98.20+ levels)
- **Oversold Level:** <30 (watch 97.00- levels)
- **Divergence Signals:** Hidden bullish divergence on 4H timeframe
- **Trend Confirmation:** Break above 55 confirms bullish momentum
### Bollinger Bands
- **Upper Band:** 98.45 (immediate resistance)
- **Middle Band (20 SMA):** 97.80 (dynamic support/resistance)
- **Lower Band:** 97.15 (immediate support)
- **Band Width:** Moderate volatility (expansion expected)
- **Squeeze Indicator:** Potential breakout setup forming
### VWAP Analysis
- **Daily VWAP:** 97.72 (key pivot level)
- **Weekly VWAP:** 97.91 (resistance)
- **Monthly VWAP:** 98.15 (major resistance)
- **Volume Profile:** High volume node at 97.50, 98.10
- **VWAP Deviation:** +1 std dev at 98.20, -1 std dev at 97.30
### Moving Averages
- **SMA 20:** 97.78 (short-term trend)
- **SMA 50:** 97.45 (medium-term support)
- **SMA 200:** 96.80 (long-term bullish above this)
- **EMA 8:** 97.85 (immediate dynamic resistance)
- **EMA 21:** 97.70 (key dynamic support)
- **WMA 10:** 97.82 (weighted recent price bias)
## Multi-Timeframe Analysis
### Intraday Analysis
#### 5-Minute Timeframe
- **Trend:** Sideways with upward bias
- **Range:** 97.75-97.95 immediate trading range
- **Scalping Levels:** Buy 97.78, Sell 97.88
- **Breakout Levels:** Above 97.95 or below 97.75
#### 15-Minute Timeframe
- **Pattern:** Ascending triangle formation
- **Apex:** Around 97.90 level
- **Time Target:** Next 2-3 hours for breakout
- **Volume:** Declining (coiling for move)
#### 30-Minute Timeframe
- **Structure:** Higher lows pattern since 97.20
- **Resistance:** 98.00 psychological level
- **Support:** 97.60 swing low
- **Momentum:** Neutral to slightly bullish
#### 1-Hour Timeframe
- **Trend:** Corrective move within larger uptrend
- **Key Level:** 98.20 hourly resistance
- **Support Zone:** 97.40-97.60
- **Next Move:** 4-6 hour window for direction
#### 4-Hour Timeframe
- **Pattern:** Bull flag consolidation
- **Pole:** Move from 97.00 to 98.90
- **Flag:** Current consolidation 97.20-98.20
- **Target:** 99.80-100.20 on upside break
- **Invalidation:** Break below 97.00
### Swing Analysis
#### Daily Timeframe
- **Primary Trend:** Bullish since July 2025
- **Current Phase:** Healthy pullback/consolidation
- **Key Resistance:** 99.00-99.20 zone
- **Major Support:** 96.80-97.00 zone
- **Expected Duration:** 5-8 trading days
#### Weekly Timeframe
- **Long-term Trend:** Sideways to up since Q2 2025
- **Weekly Range:** 96.50-99.50
- **Momentum:** Neutral with bullish undertone
- **Critical Level:** Weekly close above 98.50
#### Monthly Timeframe
- **Macro Trend:** Recovery from 2024 lows
- **Monthly Resistance:** 100.00-101.00 zone
- **Monthly Support:** 95.00-96.00 zone
- **Cycle Position:** Mid-cycle consolidation
## Key Levels & Price Targets
### Critical Support Levels
1. **97.60** - Immediate support (4H swing low)
2. **97.40** - Minor support (Gann angle)
3. **97.20** - Major support (Ichimoku cloud)
4. **97.00** - Key support (psychological + Wyckoff PS)
5. **96.80** - Weekly support (200 SMA)
6. **96.50** - Monthly support (major swing low)
### Critical Resistance Levels
1. **98.00** - Immediate resistance (psychological + Gann square)
2. **98.20** - Minor resistance (previous swing high)
3. **98.50** - Major resistance (weekly level)
4. **98.90** - Key resistance (recent high)
5. **99.20** - Weekly resistance (harmonic target)
6. **100.00** - Monthly resistance (major psychological)
### Price Projections
#### Bullish Scenario (Probability: 55%)
- **Catalyst:** Break above 98.20 with volume
- **Target 1:** 98.80-99.00
- **Target 2:** 99.50-99.80
- **Target 3:** 100.20-100.50
- **Timeline:** 2-3 weeks
#### Bearish Scenario (Probability: 35%)
- **Catalyst:** Break below 97.40 with volume
- **Target 1:** 97.00-96.80
- **Target 2:** 96.50-96.20
- **Target 3:** 95.80-95.50
- **Timeline:** 1-2 weeks
#### Neutral Scenario (Probability: 10%)
- **Range:** 97.40-98.20
- **Duration:** 1-2 weeks
- **Strategy:** Range trading
- **Breakout:** Eventually expected
## Risk Management Framework
### Position Sizing
- **Conservative:** 1% risk per trade
- **Moderate:** 1.5% risk per trade
- **Aggressive:** 2% risk per trade
### Stop Loss Guidelines
- **Intraday:** 20-30 points from entry
- **Swing:** 50-80 points from entry
- **Long-term:** 100-150 points from entry
### Take Profit Strategy
- **Scale out:** 25% at first target
- **Trail stops:** Above key support/resistance
- **Final target:** Risk-reward minimum 1:2
## Trading Strategies
### Intraday Strategy
- **Long Setup:** Break above 98.00 with volume
- **Entry:** 98.05-98.10
- **Stop:** 97.75
- **Target:** 98.45-98.60
### Swing Strategy
- **Long Setup:** Pullback to 97.40-97.60
- **Entry:** Scale in on support test
- **Stop:** Below 97.00
- **Target:** 99.00-99.50
### Momentum Strategy
- **Breakout Play:** Above 98.50 or below 97.00
- **Volume Confirmation:** Required
- **Follow Through:** Next day continuation
- **Risk:** Tight stops due to false breaks
## Market Outlook Summary
The DXY at 97.839 presents a critical inflection point with multiple technical frameworks suggesting an imminent directional move. The slight bullish bias is supported by:
- Elliott Wave suggesting Wave 5 higher
- Wyckoff accumulation characteristics
- Gann time cycles favoring upward movement
- Ichimoku cloud support holding
However, traders should remain vigilant for:
- False breakouts in current range
- Federal Reserve policy changes
- Global economic developments
- Risk sentiment shifts
**Primary Expectation:** Bullish breakout above 98.20 targeting 99.00+
**Alternative Scenario:** Range continuation 97.40-98.20
**Bearish Scenario:** Break below 97.00 targeting 96.50
*Analysis Date: August 17, 2025*
*Next Update: August 19, 2025*
*Key Event Risk: Federal Reserve communications, Economic data releases*
For those interested in further developing their trading skills based on these types of analyses, consider exploring the mentoring program offered by Shunya dot Trade.(world wide web shunya dot trade)
I welcome your feedback on this analysis, as it will inform and enhance my future work.
Regards,
Shunya.Trade
world wide web shunya dot trade
⚠️ Disclaimer: This post is educational content and does not constitute investment advice, financial advice, or trading recommendations. The views expressed here are based on technical analysis and are shared solely for informational purposes. The stock market is subject to risks, including capital loss, and readers should exercise due diligence before investing. We do not take responsibility for decisions made based on this content. Consult a certified financial advisor for personalized guidance.
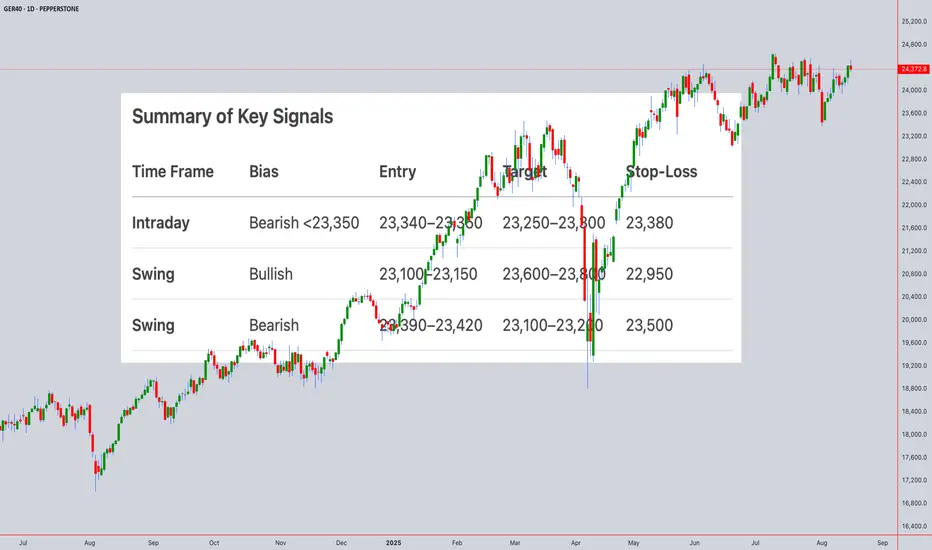
Technical Analysis for GER40 (DAX) Closing Price: 23,372.80 (15th Aug 2025, 11:50 PM UTC+4)
Analysis Methods: Japanese Candlesticks, Harmonic Patterns (ABCD, M/W), Elliott Wave, Wyckoff, Gann Theory (Time/Square of 9/Angles), Ichimoku, RSI, Bollinger Bands, VWAP, Moving Averages (MA/EMA/SMA/WMA).
---------------------------------------------------------------------------------------------
1. Long-Term Trend (Weekly/Monthly)
Elliott Wave:
GER40 is likely in Wave 3 of a broader bull cycle (Wave 1 peak: 22,800, Wave 2 dip to 21,500).
Wave 3 Target: 24,000–24,500 (1.618 extension of Wave 1).
Gann Price Forecasting:
Square of 9: √23,372.80 ≈ 152.90 →
Resistance: 153² = 23,409 (immediate), 154² = 23,716 (swing target).
Support: 152² = 23,104 (daily pivot), 151² = 22,801 (Wyckoff accumulation zone).
Ichimoku (Monthly):
Tenkan/Kijun: Bullish (Tenkan: 22,900 > Kijun: 22,400).
Cloud: Price above thick Senkou Span (22,000–22,500) – structural bullishness.
Moving Averages:
Weekly SMA(100): 22,200 (major support).
Swing Outlook: Bullish. Wave 3 rally targets 24,000–24,500.
2. Medium-Term Swing (4H/Daily)
Harmonic Patterns:
Bearish ABCD on Daily:
A: 23,800 → B: 23,100 → C: 23,550 → D: 23,380–23,420 (1.272 BC extension).
Bullish Crab (W Pattern) forming near 23,100 (0.886 XA retracement).
Wyckoff Phase:
Testing at 23,400:
Upthrust rejection at 23,450 (15th Aug) on low volume.
Spring potential near 23,100 (accumulation signal).
Gann Theory:
Time Window: Aug 18–20 (Square of 9 date cluster) for breakout/reversal.
Price-Time Squaring: 23,372 aligns with Aug 15 – consolidation expected.
Gann Angle: 1x1 angle at 23,300 – close below accelerates selling.
Indicators:
RSI(14) + Bollinger Bands (Daily):
RSI: 64 (neutral, no divergence).
Price testing upper BB(20,2) at 23,450 – expansion hints at volatility.
VWAP (Weekly): 23,250 (swing support).
Swing Trade Setup:
Short near 23,400 (ABCD target) → Target 23,100. Stop-loss: 23,500.
Long near 23,100 (Crab + Gann 151² support) → Target 23,800. Stop-loss: 22,950.
3. Intraday Outlook (5M–4H)
Key Levels:
Resistance: 23,400 (Gann 1x1), 23,450 (weekly high).
Support: 23,300 (VWAP), 23,200 (Ichimoku cloud), 23,100 (psychological).
Indicators:
Ichimoku (1H):
Tenkan: 23,360, Kijun: 23,330 → Price above both (short-term bullish).
Cloud: Bullish (23,280–23,320) – strong support zone.
RSI + Bollinger Bands (4H):
RSI(14): 58 (neutral).
Price near mid-BB(20,2): 23,350 – break below signals bearish momentum.
VWAP + MAs:
VWAP: 23,340 (intraday pivot).
EMA(50): 23,310 (dynamic support).
Candlestick Patterns:
4H Shooting Star at 23,450 (15th Aug) → Bearish reversal confirmed.
1H Bearish Engulfing below 23,380 – adds downside pressure.
Gann Intraday Squaring:
Time Cycle: 8:00–10:00 AM CET (European open) for volatility.
Price Harmony: Close below 23,350 targets 23,300 → 23,250.
Intraday Trade Plan:
Sell below 23,350 → Target 23,300 (VWAP) → 23,250 (Ichimoku cloud).
Buy above 23,400 only with RSI <60 → Target 23,450.
Stop-Loss: 25–30 points risk.
Summary of Key Signals
Time Frame Bias Entry Target Stop-Loss
Intraday Bearish <23,350 23,340–23,350 23,250–23,300 23,380
Swing Bullish 23,100–23,150 23,600–23,800 22,950
Swing Bearish 23,390–23,420 23,100–23,200 23,500
Critical Events Ahead:
Gann Reversal Window: Aug 18–20 (watch for Eurozone CPI/GDP data).
Daily Close >23,450 invalidates bearish ABCD and targets 23,716.
Risk Note: GER40 is sensitive to EU political/energy risks. Use tight stops during news events.
Disclaimer: Technical analysis is probabilistic and based on historical patterns. Fundamental drivers (e.g., ECB policy, German industrial data) may override technical signals. Always use risk management.
For those interested in further developing their trading skills based on these types of analyses, consider exploring the mentoring program offered by Shunya dot Trade . (world wide web shunya dot trade)
I welcome your feedback on this analysis, as it will inform and enhance my future work.
Regards,
Shunya.Trade
world wide web shunya dot trade
⚠️ Disclaimer: This post is educational content and does not constitute investment advice, financial advice, or trading recommendations. The views expressed here are based on technical analysis and are shared solely for informational purposes. The stock market is subject to risks, including capital loss, and readers should exercise due diligence before investing. We do not take responsibility for decisions made based on this content. Consult a certified financial advisor for personalized guidance.
DXY LONG FROM RISING SUPPORT|
✅DXY is trading in an uptrend
Along the rising support line
Which makes me bullish biased
And the pair is about to retest the rising support
Thus, a rebound and a move up is expected
With the target of retesting the level above at 98.000
LONG🚀
✅Like and subscribe to never miss a new idea!✅

NIKKEI Will Keep Growing! Buy!
Hello,Traders!
NIKKEI is trading in a
Strong uptrend and the
Pair made a bullish breakout
Of the key horizontal level
Of 42,500 and the breakout
Is confirmed so we are bullish
Biased and we will be expecting
A further bullish move up
Buy!
Comment and subscribe to help us grow!
Check out other forecasts below too!
Disclosure: I am part of Trade Nation's Influencer program and receive a monthly fee for using their TradingView charts in my analysis.

DXY: Dollar’s ready, but the starter pistol’s still silentDXY is holding in the 97.50–97.60 support zone, an area where buyers have stepped in multiple times. Current market structure suggests possible liquidity accumulation before an upside move. The key tactical trigger is a breakout and close above 98.76, opening the path to 100.28, then 101.84 where historical selling pressure has emerged. The long-term target, if all levels break in sequence, is 104.40. While price remains below 98.76, buyers have no confirmed advantage and any rally remains speculative.
Fundamentally , the dollar lacks unconditional support: US macro data is mixed and Fed policy remains uncertain. However, safe-haven demand and cautious risk positioning by large players create a backdrop for a potential upward correction.
Tactical plan: watch 97.50–97.60, a confirmed break above 98.76 activates a move towards 100.28 → 101.84 → 104.40. Failure to break cancels the idea until a fresh impulse emerges.
The dollar right now is like a boxer before stepping into the ring - warmed up, focused, but waiting for the bell.

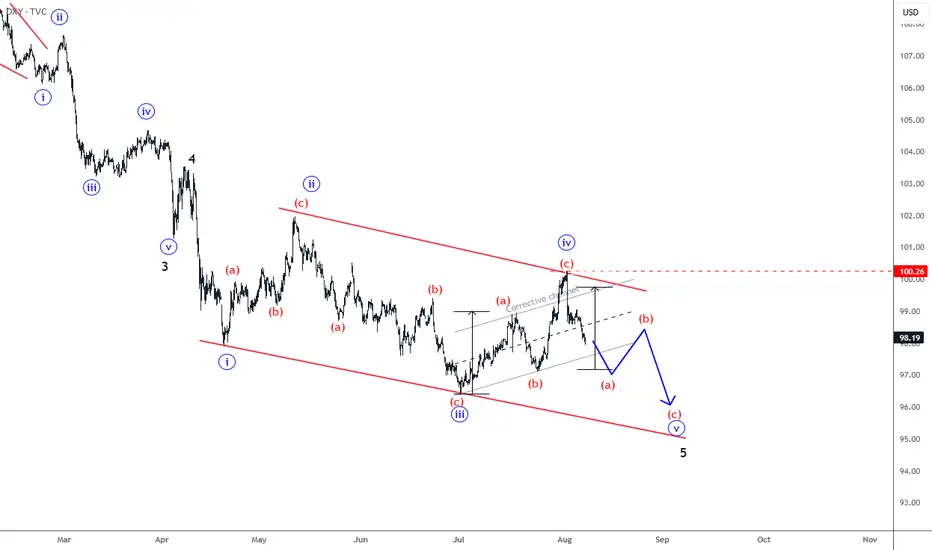
DXY Is Still Bearish; Final Leg Of The Wedge Pattern?DXY Is Still Bearish, but it can be trading in final leg of ending diagonal a.k.a. wedge pattern from technical and Elliott wave perspective.
US Dollar Index – DXY made only a three-wave rise from the lows, which indicates for a correction within downtrend. So recovery can basically still be a fourth wave rally, just a bit deeper one that can still belong to an ending diagonal a.k.a. wedge pattern. Final wave “v” of 5 can be still missing, so be aware of a continuation lower within a new three-wave abc decline, especially if breaks below the lower side of the corrective channel near 97.70 level.
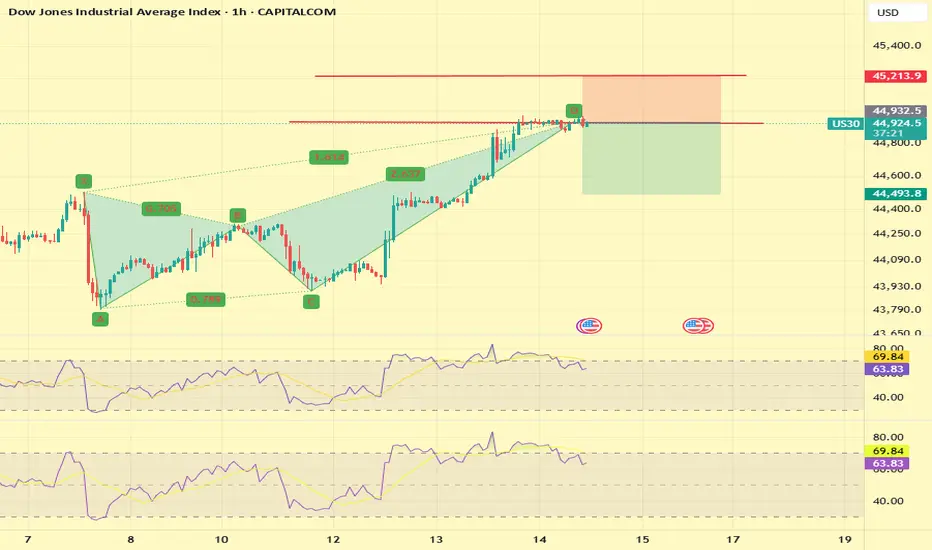
US30 Short This trade is massively overbought on all timeframes and at the all-time high with very good resistance
There is a crab pattern on H1 and H4
Multiple tops on M15 and M30 are showing massive divergence
stoploss above 150 pips
This is against the trend so will have to monitor when it is time to exit
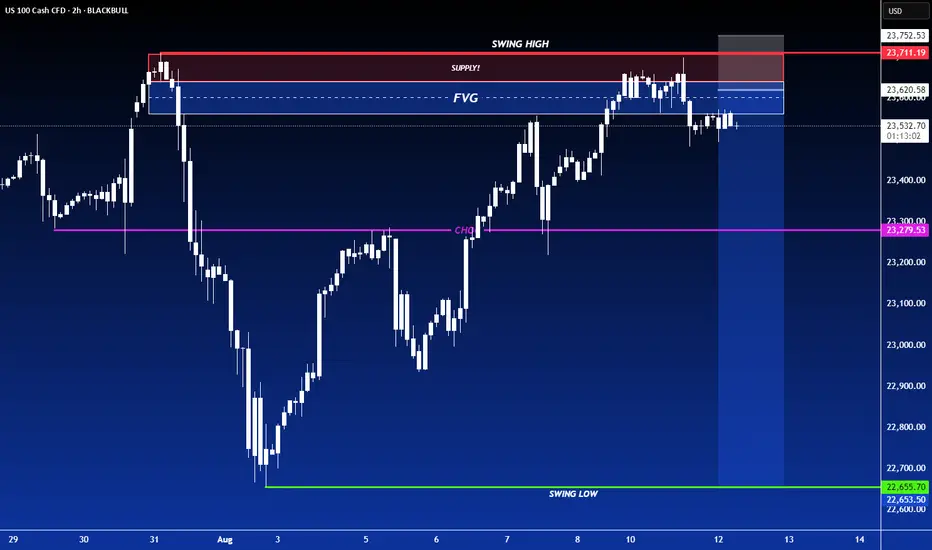
US100 Bullish Breakout! Buy!
Hello,Traders!
US100 is trading in a
Strong uptrend and the
Index made a strong bullish
Breakout of the key horizontal
Level of 23,720 which is now
A support and the breakout
Is confirmed so we are
Bullish biased and we will
Be expecting a further
Bullish continuation
Buy!
Comment and subscribe to help us grow!
Check out other forecasts below too!
Disclosure: I am part of Trade Nation's Influencer program and receive a monthly fee for using their TradingView charts in my analysis.

SHORT ON NAS100NAS has retested a major supply zone after a nice CHOC (Change Of Character)
I will be selling NAS looking to catch over 800-100 points.
DXY (USD) CPI economic news will also be a catalyst to more this trade this morning after 8:30am.
NASDAQ Short This is at the all-time high, showing a lot of resistance
There is an AABCD pattern on H1
All timeframes are overbought
There are multiple tops on M15 and M30 with divergence
Stop loss of 150 pips

Think of RSI like a car’s speedometer: The speed (RSI) changes b"Think of RSI like a car’s speedometer:
The speed (RSI) changes before the position (price) changes direction."
1. What RSI actually is?
RSI (Relative Strength Index) is just a math transformation of price data.
It measures the ratio of recent upward moves to downward moves over a period (often 14 candles) and compresses it into a 0–100 scale.
2. Why RSI sometimes “moves first”
This isn’t magic — it’s because RSI is sensitive to the speed and size of recent price changes, not just direction.
- If price is still going up but at a slower pace, RSI can already start turning down.
- If price is falling more gently than before, RSI can start curling up before price actually reverses.
3. Why traders care about RSI reversals?
- If RSI starts turning down from an overbought level while price is still climbing, it can be an early warning of a possible price top.
- Same for the opposite: RSI turning up from oversold while price still dips can signal an upcoming bounce.
4. RSI above or below 50
50 on the RSI is the “momentum neutral” line.
- When RSI is above 50, recent gains outweigh recent losses → momentum is bullish.
- When RSI is below 50, recent losses outweigh recent gains → momentum is bearish.
5. The “delay” you see
The delay is more about your eyes than the math:
- RSI smooths recent price moves (average gains/losses), so it reacts slightly ahead to changes in momentum.
- Price must actually reverse for you to “see” it, but RSI reflects that change in momentum first.
- Think of RSI like a car’s speedometer:
The speed (RSI) changes before the position (price) changes direction.
6. How to deal with noise* in RSI?
Use higher timeframes (1D, 1W, 1M) to confirm signals from small charts.
*Noise in trading = small, random price movements that don’t reflect the bigger trend.
On a 1-minute or 5-minute chart, there’s a lot of this — caused by scalpers, bots, spreads, liquidity gaps, and normal market “chatter.”
DAX WILL GO UP|LONG|
✅DAX is going up now
And the index made a
Breakout of the key horizontal
Level of 24,100 which is
Now a support then
Made a retest and a is now
Making a rebound already so
We are bullish biased and we
Will be expecting a further
Bullish move up
LONG🚀
✅Like and subscribe to never miss a new idea!✅

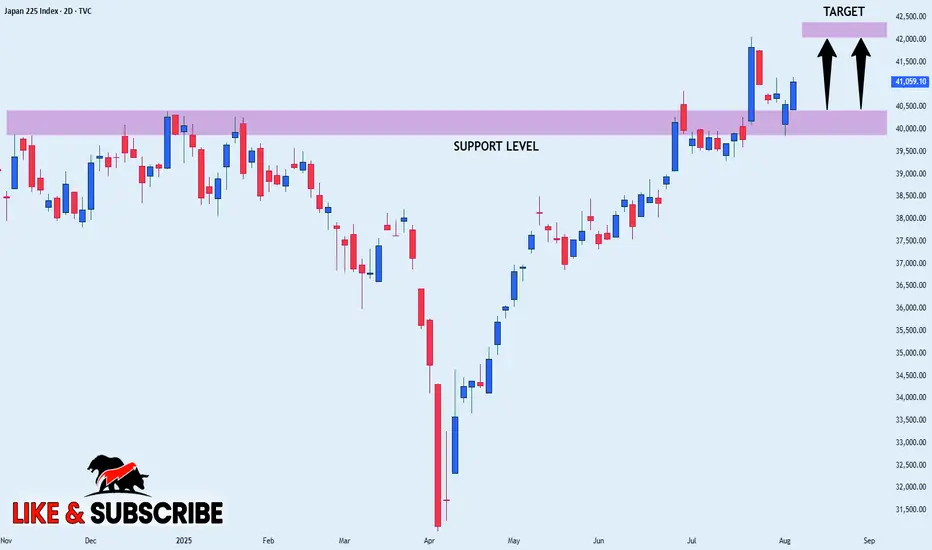
NIKKEI WILL KEEP GROWING|LONG|
✅NIKKEI is trading in an uptrend
And the index was making a bearish correction
But it has now retested a horizontal support level of 40,500
From where we are already seeing a bullish
Reaction and I am expecting the index to go further up
LONG🚀
✅Like and subscribe to never miss a new idea!✅
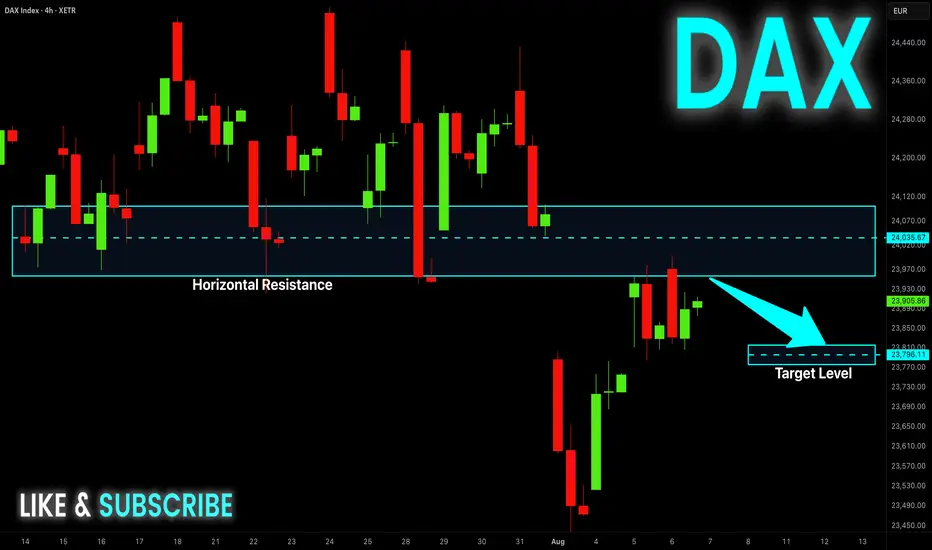
DAX Potential Short! Sell!
Hello,Traders!
DAX went up nicely
But is now about to hit
A horizontal resistance
Around 24,000 so after
The retest we will be
Expecting a local pullback
Sell!
Comment and subscribe to help us grow!
Check out other forecasts below too!
Disclosure: I am part of Trade Nation's Influencer program and receive a monthly fee for using their TradingView charts in my analysis.