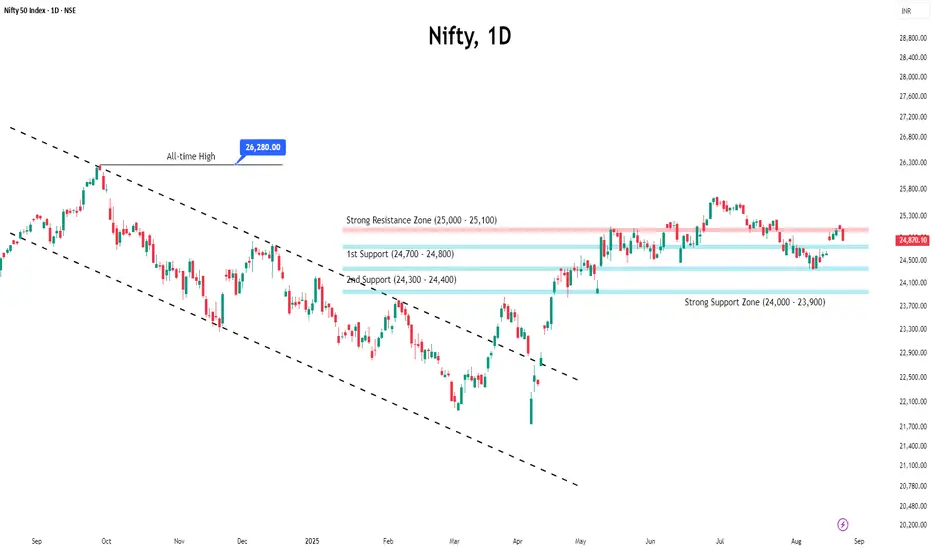
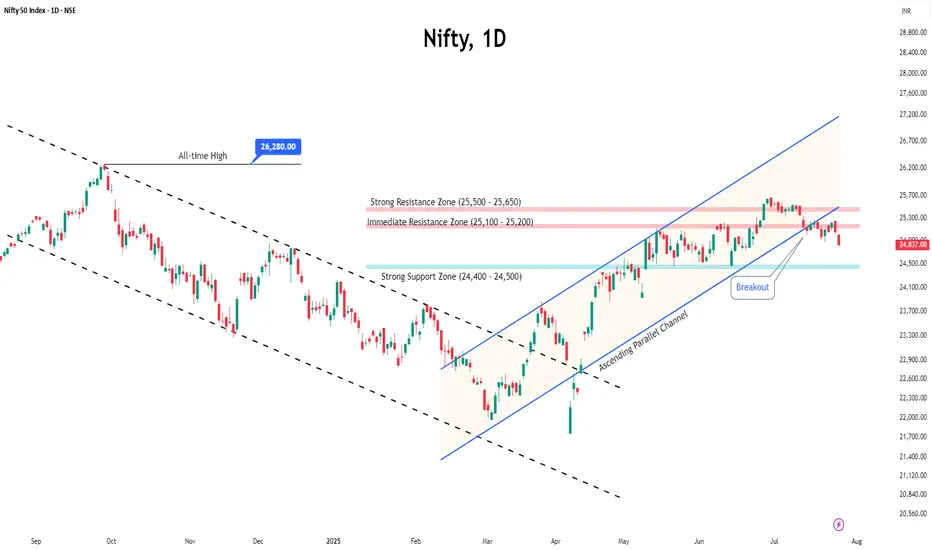
Nifty Hits Resistance; Volatility Looms Ahead of Monthly ExpiryReason Behind the Fall
The Indian market snapped its six-session winning streak on Friday as investors turned cautious ahead of US Federal Reserve Chair Jerome Powell’s speech at the Jackson Hole symposium.
Concerns over the upcoming 25% US tariffs, set to take effect on August 27, further added to market volatility.
Importantly, Powell signalled in his remarks on Friday that the Federal Reserve is likely to cut interest rates in September.
Technical Setup
The Nifty faced rejection from the key resistance zone of 25,000–25,100, which may trigger further downside towards 24,500–24,400.
OI Data Analysis
Open interest data shows significant call writing at 25,000, reinforcing it as a strong resistance for the upcoming monthly expiry.
On the downside, 24,800 is emerging as immediate support with notable put writing. If this level fails to hold, the next support is likely near 24,500.
Suggested Strategy
With the additional tariff deadline approaching alongside monthly expiry, heightened volatility is expected.
Traders are advised to stay cautious and adopt a wait-and-watch approach until the index provides clear directional cues.
Indianstockmarket
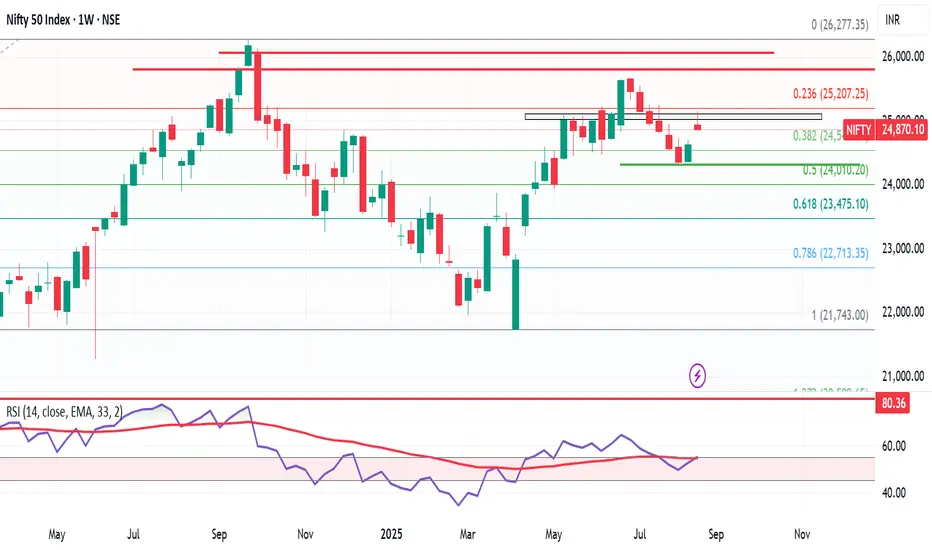
Nifty Forms Shooting Star – Is Septmber Correction on the Cards?Nifty closed this week at 24,870, up 240 points from the previous week’s close. It made a high of 25,153 and a low of 24,852, once again respecting my projected range of 25,100 – 24,300.
But here’s the key: this week, Nifty formed a Shooting Star candle, which is a bearish reversal pattern. As long as Nifty stays above 24,852, bulls are safe. But a break below this level could trigger downward pressure toward 24,400.
📊 Next Week’s Range:
➡️ Likely range → 25,350 – 24,400
➡️ Break below 24,852 = bearish pressure
➡️ If 24,400 breaks, 23,900 could come into play
Historical September Pattern:
From the 2nd week of September, markets have historically shown 6–11% corrections from their highs. If history repeats, within the next 10 days we could see another push toward 25,600/25,700, followed by heavy selling pressure.
✅ My Plan:
If markets rise in the coming days, I’ll be looking to cash out from existing positions and prepare to re-enter at better levels if a correction begins in the 2nd or 3rd week of September.
US Market Update – S&P500
The S&P500 bounced from 6,343 support and managed to close just 10 points higher than last week. Above its previous week’s high of 6,481, it has the potential to test the 6,568 Fibonacci level. Investors in US markets should trail their stop-loss to 6,330 to safeguard profits.
Want me to review any index or cryptocurrency for you? Drop it in the comments and I’ll cover it in my next update!
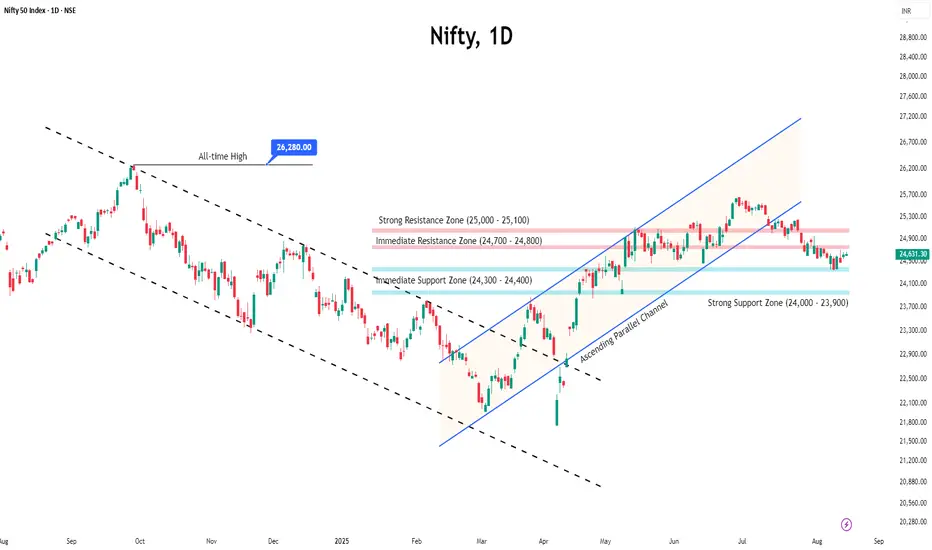
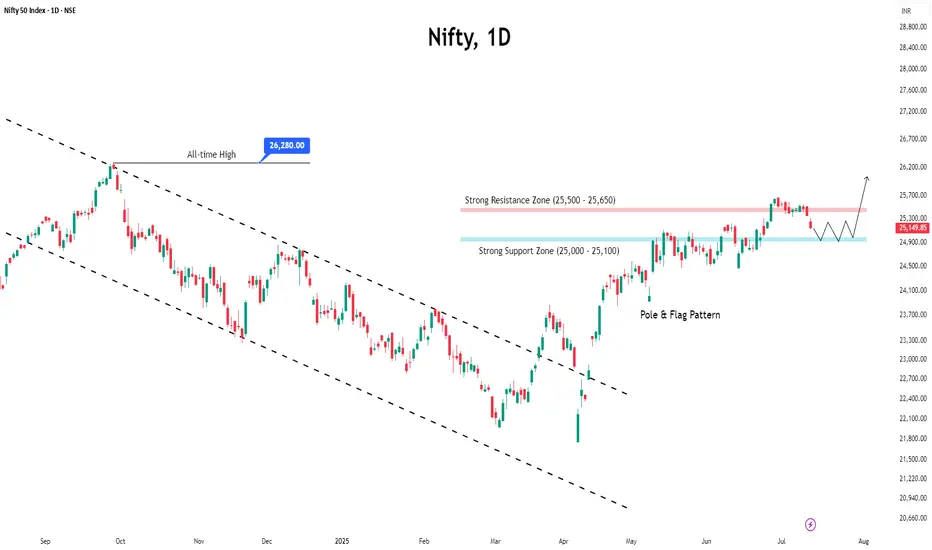
Nifty Rebounds After Six-Week Fall, Consolidation Continues● Nifty finally ended its six-week losing run, closing the week with a 1.10% gain despite trading in a narrow range.
● Volatility inched higher, with India VIX rising 2.68% to 12.35, reflecting a slightly elevated risk perception, though it remains comfortably low.
● On the technical front, the 24,300–24,400 zone is likely to act as immediate support, while resistance is seen at 24,700–24,800.
● Heading into nest expiry, the index is expected to remain in a neutral phase as it continues to consolidate below key resistance levels. Without a decisive breakout, aggressive buying should be avoided.
● Traders are advised to closely monitor price action around these key levels and manage risk carefully while planning trades.
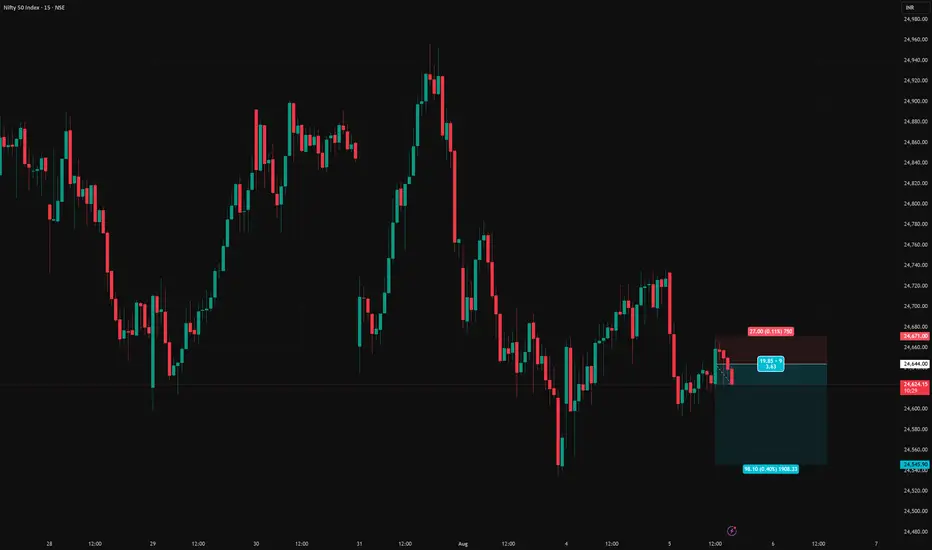
NIFTY short setupNifty short setup
Entry - 24644.00
Stop loss - 24671.00
Target - 24545.90
Risk Reward - 1:3.6
Nifty Extends Losing Streak: Is a Dead Cat Bounce Coming?The Nifty 50 dropped for the fifth week in a row, losing around 1.5%. Sectors like banks, IT, and consumer stocks are under pressure, and there are no big positive news to lift the market right now.
◉ Why is the Market Falling?
● Poor Q1 Results
Many big companies, especially in banking and IT, reported weaker-than-expected earnings. This disappointed investors and led to selling.
● U.S.–India Trade Trouble
The U.S. has added a 25% tax on Indian exports starting August 1. The two countries couldn’t agree on some trade issues, especially related to agriculture and dairy. This is bad news for export-focused companies.
● Weak Rupee
The rupee is near record lows against the U.S. dollar. This is because foreign investors are pulling money out of India. A weak rupee hurts sectors like IT and pharma, which earn in dollars.
◉ What the Charts Say?
The market has had a tough 5 weeks, but now it’s near a strong support level. This means a short-term bounce (dead cat bounce) is possible — a small recovery before another fall.
● Support at 24,500
There’s a large number of put option writers at this level. This means many traders are confident that Nifty won’t fall below 24,500 — so they’re willing to take that risk. This builds a strong support zone.
● Resistance at 24,700–24,800
There’s heavy call writing in this range. That means traders are betting Nifty won’t go above these levels. As a result, this area acts like a short-term ceiling or resistance.
Expect the Nifty to stay between these levels coming week unless some major news changes the game.
◉ Suggested Strategy
● For Traders: Stay cautious. Avoid aggressive long positions unless Nifty reclaims 25,000 decisively. Look for shorting opportunities near resistance zones with strict stop losses.
● For Investors: Stick to quality. Defensive pockets like FMCG, utilities, and select pharma may offer stability amid broader volatility.

KNR Construction on the Highway to Resistance NSE:KNRCON 1M TF
🏭 INDUSTRIALS
(Infrastructure/Manufacturing – Govt Capex Tailwinds)
Hyderabad-B’luru Highway Contract-FIIs ↑2.7%
At the time of charting NRC was trading at 211
Trend 1M TF: Multi-year upward channel intact (orange lines), but price currently near the lower channel support.
Key Levels:
Immediate support: ₹176–180 (monthly support zone).
Resistance levels: ₹291–295 (Bullish Order Block + pivot S), then ₹353 (P) and upper channel resistance ₹470.
Structure: Price has been in a descending wedge (mini downtrend) within the bigger channel → typically a bullish reversal pattern.
Previous big red candles show capitulation; recent candles show reduced selling pressure → possible accumulation.
strong hands absorbing supply.
Breakout confirmation: Monthly close above ₹230–235 would validate wedge breakout and bring ₹291–353 in play.
📊 3. Fundamental Alignment (FA)
Macro context:
KRC operates in infrastructure/industrial RE/parks (if Krishnagiri/K Raheja Corp Ltd). Sector aligned with capex cycles and logistics growth in India.
Government push for Make in India, manufacturing, and warehousing supports demand.
Valuation: After a deep correction, valuations are at the lower end of historical range, making it attractive for long-term investors.
🧰 4. Strategic Outlook
►we'll follow this trade closely and within incoming week we'll up a close up view of 4h TF
Bias: Bullish reversal bias as long as ₹176 monthly support holds.
Accumulating around ₹185–211 zone.
Alternate scenario: Breakdown below ₹176 on volume → price could retest ₹150–140 support zone.
Always DYOR
See you on the other side
💡 Reflective Close
"Multi-year support zones often define💰trades for patient investors. Are you ready build positions when the market narrative is still fearful?"

Pressure Builds on Nifty Before ExpiryThe Nifty traded in a tight range for most of the week but eventually slipped below the 25,000 mark, ending on a weak note.
With the monthly expiry approaching, the index is likely to remain under pressure, and volatility may pick up in the coming sessions.
Key resistance levels are seen at 25,200 and 25,500. A decisive move above 25,500 could trigger an upside breakout. On the downside, support is expected around 24,500 and 24,400.
Given the current structure, traders are advised to stay cautious, focus on selective opportunities, and avoid aggressive positions until a clearer trend emerges.
Nifty Closes Below 25,000 — What Lies Ahead?The Indian market's recent uptrend appears to be losing momentum, as the benchmark Nifty index extended its decline for the third consecutive week, ending just below the important 25,000 mark.
This pullback has been largely driven by weakness in the Financial and IT sectors, with major players like NSE:TCS , NSE:HCLTECH , and NSE:AXISBANK posting disappointing earnings.
From a technical perspective, the index is now approaching a key support zone near 24,900. A decisive break below this level could open the door for a further slide towards 24,500.
Open Interest (OI) data reinforces this view, with the 25,000–24,900 zone seeing the highest put writing, marking it as an immediate support area. On the upside, strong call writing at 25,100 and 25,200 on Friday suggests these levels will act as immediate resistance.
Given the current structure, the outlook for the coming week remains neutral to bearish.
Traders are advised to stay cautious, manage risk effectively, and keep a close watch on these crucial levels.

BAJAJFINSV BUY PROJECTION Bajajfinsv - Buy View
Trade Setup :
Monthly - Strong Support and FIB 0.786
Weekly - Symmetric Triangle Breakout
Day - Higher High Formed (Uptrend)
Entry - Aggressive Trader(Entry Now)
Conservative Trader - 1588 Rs
Target 1 - 1925 Rs
Target 2 - 1971 Rs
Stoploss - 1514 Rs
Expected Return - 20 %

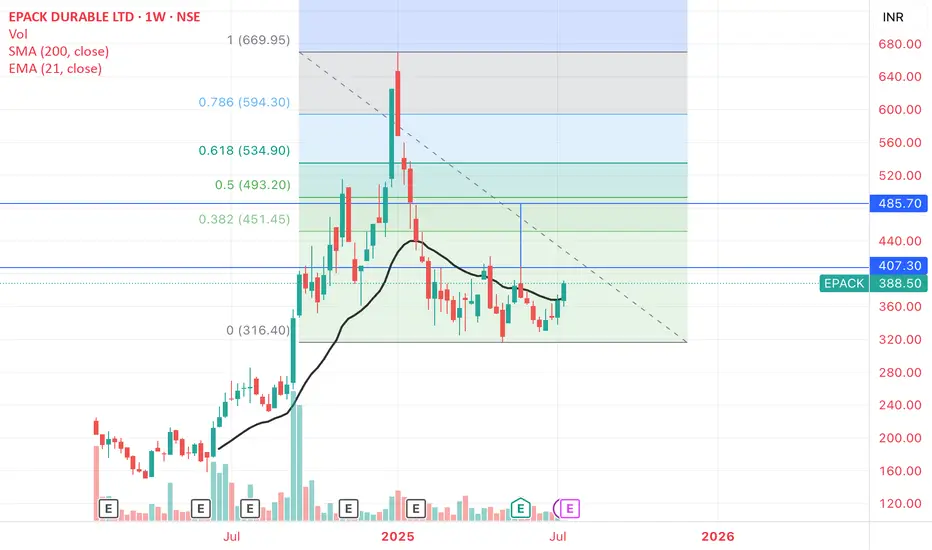
E-PACK_ Potential Double Bottom and TargetsE-PACK DURABLE: Potential Double Bottom with Resistance 407-410 zone.
Weekly close above it - Target 480-490 , that is also the 50% retrace Fib Level of the entire fall from the peak
Weekly close and support held at 407-410 matters
Nifty Dips, Suggests Range-Bound Movement AheadIndian markets ended the week with a decline of nearly one percent, driven by lingering concerns over global tariffs and a weak start to the earnings season.
The 25,500 level has now turned into a strong resistance zone, marked by heavy call writing, while 25,000 continues to act as a solid support level backed by significant put writing.
Given these dynamics, the index is likely to enter a consolidation phase, with upcoming earnings announcements expected to keep sectoral volatility elevated.
VI Stock(India) Looking for bullish Rally! {5/07/2025}Educational Analysis says that VI Stock (India) may give trend Trading opportunities from this range, according to my technical analysis.
Broker - NA
So, my analysis is based on a top-down approach from weekly to trend range to internal trend range.
So my analysis comprises of two structures: 1) Break of structure on weekly range and 2) Trading Range to fill the remaining fair value gap
Let's see what this Stock brings to the table for us in the future.
Please check the comment section to see how this turned out.
DISCLAIMER:-
This is not an entry signal. THIS IS FOR EDUCATIONAL PURPOSES ONLY.
I HAVE NO CONCERNS WITH YOUR PROFIT OR LOSS,
Happy Trading, Fx Dollars.

$NSE:NIFTY is Going to Burst Up Side ! SkyRocketing TIme is NearNSE:NIFTY is Going to Burst Up Side ! SkyRocketing TIme is Near
NIFTY 50 BULLISH REVIEW (My View) 💥
📈 Current Bias: BULLISH
✅ Nifty 50 showing strong resilience above key support levels.
✅ The index is holding well above recent consolidation zones and looks ready for further upside.
✅ Momentum indicators (like RSI) are staying in positive territory, showing sustained strength.
✅ Higher highs & higher lows structure intact on daily chart — bulls in control!
🔑 Key Levels:
👉 Immediate support: 23,333 - (watch for buying interest here)
👉 Resistance ahead: 23,850 - 23,900 (break above = fresh rally potential)
🌟 What I’m Watching:
🚀 Breakout above 23,900 could open doors towards 24,200+ levels in the coming sessions.
🚀 Strong sector participation from banks, IT, and autos — a broad-based rally is a positive sign.
🚀 Keep an eye on global cues + FII activity — may add fuel to the trend.
NSE:NIFTY is Going to Burst Up Side ! SkyRocketing TIme is Near

NIFTY is Testing its long term Trend Line.I’ve been keeping an eye on the ‘Watch Out’ area and the trend line that’s being tested. I’ve been following this trend line for a while now, and I’m excited to share some potential scenarios that could unfold in July.
Here are a few things to keep in mind:
1. The 25450 - 25550 range could become a key resistance and support area.
2. If NIFTY successfully retests this trend line and shows some upward movement, the next target could be 26000. In this case, I would recommend buying July 26000 Call options.
3. If NIFTY can’t hold this retest (which is less likely given NSE:NIFTY the current bullish market sentiment), our next watchout zone could be 25000 - 24800.
4. We might even be seeing an all-time high NIFTY soon!
Disclaimer: Please do your own research before investing. This is just my personal opinion, and I don’t force anyone to invest based on my ideas.

NRB Bearing Limited - 290 CMP Short-term Looking good for 100%+Good Buy For Short- Term 1 Year Investment Horizon.
NRB Bearing Limited - 290 CMP
Expected Return - 580 (100)%
Drawdown - 205 (35%)
*This POST for educational purpose only. Concern your advisor before investing in market related instrument...*
- AB_INV_7

KBCGLOBAL Looks bullish!A potential entry is identified at 0.46. The first target is 0.62, representing a +34.78% gain from the entry point. If the upward momentum continues, the long-term target is set at 0.87, offering a total potential gain of +89.13% from the initial entry. This trade presents a strong risk-to-reward profile for both short-term traders and long-term investors. Proper risk management is essential, especially if price action weakens below the entry level.

Trade setup HINDZINCHINDZINC Is approaching a key support level at 440. This level is critical for determining the stock's next move. A breakdown below 440 could signal increased bearish momentum, potentially leading to further downside. On the other hand, if the 440 level holds strong and shows signs of support, it could mark the beginning of a bullish reversal. In that case, there's a significant upside potential, with a possible long-term target around 655. For now, it's important to stay patient and wait for a clear signal—either a breakdown or a bounce from the current level—before making any trading decisions.

IDIA Range Accumulation – Bullish Only With Fundamental TriggerThe stock is currently trading inside a tight range, indicating a phase of consolidation.
📉 Buy Zone: ₹6.38
I’m planning to accumulate if price drops near this zone. From a technical view, it’s a strong demand area. However, for the bullish breakout to sustain, we’ll need strong fundamental support — like earnings, news, or sector momentum.
🔍 If fundamentals align, this could become a long-term multibagger setup.
✅ Strategy:
Wait for ₹6.38 zone
Accumulate small quantities
Hold for long-term with regular news tracking
💬 What do you think?
Would you wait for breakout or buy inside the range?
#TechnicalAnalysis #SwingTrade #LongTermView #SupportZone #BreakoutSetup #StockMarketIndia

Cochin Shipyard – Key Level Retracement & Long SetupCochin Shipyard is perfectly retracing to a key support zone, showing strength for a possible bounce.
🔹 Entry: ₹2149
🎯 Target 1: ₹2543
📈 Potential Gain: ~18.3%
🕒 Plan: Holding position unless structure shifts
This setup aligns with the current trend — looking for a continuation after healthy retracement. Tight stop-loss recommended for capital protection.
💬 What's your view on this trade?

HDFC Accumulation Breakdown Setup?HDFC seems to be building an accumulation range with:
Range High: ₹1955
Range Low: ₹1908
Currently, price is consolidating within this zone. I'm biased to the sell side for now, expecting a potential breakdown below the ₹1908 level.
⚠️ No confirmation yet — it's a “wait and watch” scenario. A strong close below the range low could trigger momentum selling.
💬 What's your view on this setup?

Buy the Dip: Tata Motors Set to Zoom from ₹713 to ₹799!Consider buying Tata Motors stock below ₹713 with a long-term target of ₹799, offering a potential profit of approximately 12%.

Equity Research Flash – BEML Ltd.CMP: ₹3,242.10 | Breakout From Falling Trendline
BEML has decisively broken out of a falling trendline and is now sustaining above a key consolidation zone. With strong bullish candles, a rising RSI, and healthy volume spike, the stock signals bullish momentum. Immediate resistance lies at ₹3,420–₹3,480. Sustained move above could target ₹3,750+. 20/50 EMA crossover supports the upward trend. Traders may consider entries on dips with SL near ₹3,080.
For educational purposes only

Equity Research Flash – Hexaware Technologies Ltd.CMP: ₹722.35 | Bullish Momentum Post Trend Reversal
HEXT shows a bullish breakout from a falling trendline, with RSI near 60 and strong volume uptick. The price reclaimed the 0.5 Fibonacci level, eyeing next targets at ₹749.85 (0.618) and ₹793.35 (0.786). Fundamentally strong with robust revenue growth, improving ROCE (26.4%), and low debt. A move above ₹750 could trigger further upside. Accumulate on dips with SL at ₹688.
Recommendation: Positive | Buy on Dips Near ₹700
For Education Purpose only
