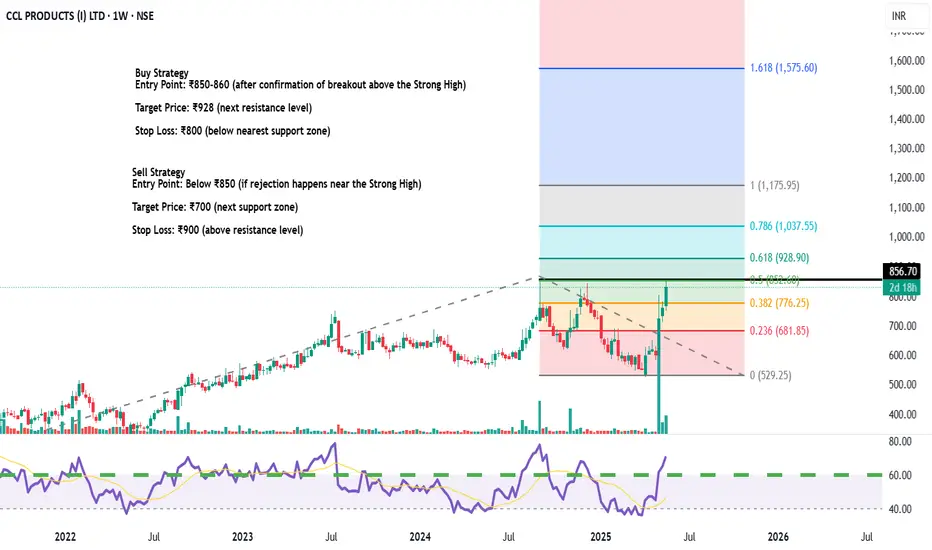
Massive Move Incoming? CCL PRODUCTS LTD Price Prediction!Trade Recommendation
Buy Strategy
Entry Point: ₹850-860 (after confirmation of breakout above the Strong High)
Target Price: ₹928 (next resistance level)
Stop Loss: ₹800 (below nearest support zone)
Sell Strategy
Entry Point: Below ₹850 (if rejection happens near the Strong High)
Target Price: ₹700 (next support zone)
Stop Loss: ₹900 (above resistance level)
Technical Observations
Resistance Zones: ₹900
Support Zones: ₹700
RSI: Check for overbought or oversold levels to confirm entry
Indianstockmarket
SYMPHONY LTD CMP -1280 for 700%%Buy Long term 3-5 Years
Symphony Ltd
Cmp - 1277
Target 11000..
** This Post is for educational purpose Only, Please concern your financial advisor before investing in market related investment**

OIL – Oil India Ltd | Target: ₹429.00🟢 Trade Details:
LTP: ₹417.30
Recommended Buy Range: ₹415.50 – ₹416.00
🎯 Target: ₹429.00
🛑 Stop Loss: ₹408.70
🔍 Technical Snapshot:
✅ Strong bullish candle with volume confirmation
✅ EMA crossover supports the uptrend (9 EMA > 13 EMA)
✅ RSI at 62.22 shows healthy momentum
✅ Breakout above previous range box visible on Daily & 1H TF
📊 BB %B at 0.82 – still room before overbought levels
💼 Strategy:
Suitable for short-term MTF holding (2–5 days)
Risk-Reward ~1:1.5
Trail SL to cost once ₹424+ is breached
Use smaller timeframes (15m / 1H) to confirm entry with volume
For Education Purposes Only

NIFTY Resumes Its Bullish TrendHello traders! Today we will talk about an Indian stock market exchange NIFTY 50, as we see nice and clean pattern from technical and Elliott wave perspective.
As you can see, NIFTY is in an impulsive bullish rise on the weekly basis, which looks like a higher degree wave 3 of an ongoing five-wave bullish impulse by Elliott wave theory.
After recent corrective slowdown in subwave (4), which perfectly tested channel support line and 38,2% Fibonacci retracement, we can now see it extending even higher, ideally for subwave (5) of a higher degree wave 3 that can push the price even up to 28k-30k area this year, just watch out on short-term pullbacks.

"Nifty 50 Eyes Breakout from Key Support Zone"**Support Zone (Red Rectangle)**:
* Strong support between ₹24,290 – ₹24,340.
* Multiple price bounces have occurred here, indicating demand presence.
**Resistance Levels**:
* **Immediate resistance**: ₹24,409.65 (horizontal red line)
* **Next resistance**: ₹24,494.45
**Support Levels**:
* **Immediate support**: ₹24,290
* **Next support**: ₹24,240.65
**RSI (Relative Strength Index) – 14 Period**
* RSI is at **36.25**, near the oversold region.
* Indicates the index may be poised for a short-term bounce.
* Positive RSI divergence is not yet confirmed but should be monitored.
---
**Bullish Scenario**:
* A breakout above the black descending trendline (\~₹24,360) with volume can lead to:
* First target: ₹24,409.65
* Second target: ₹24,494.45
* Supported by wedge breakout and RSI recovery.
**Bearish Scenario**:
* Breakdown below ₹24,290 zone can trigger a fall to:
* First target: ₹24,240.65
* Second target: Lower bound of ascending channel (\~₹24,060)

RIDING THE INDIAN METAL RALLYThe Indian Metal Index (CNXMETALS) is shaping up for an exciting move! 🚀
LINK TO MY FULL REPORT -
drive.google.com
Through technical analysis, I’ve identified a strong inverse correlation between CNXMETALS and the Dollar Index (DXY) 📊.
Historically, when DXY weakens, Indian metal stocks tend to shine.
🔥 Key Observations:
✅ CNXMETALS Technical Setup – Strong indicators suggesting bullish momentum! 🏗️💰
✅ Stock Picks & Targets – I’ve highlighted key stocks that could benefit from this macro and technical setup! 📌💡
✅ Dollar Index at Crucial Support – A breakdown could fuel an upward surge in Indian metal stocks! 📉➡️📈
✅ Global Macro Trends – A quick dive into the global metal sector & its impact on Indian markets 🌍🔎
Metals are heating up, and the charts are telling a compelling story!
Are you tracking this trend?
Let’s discuss in the comments! ⬇️💬

INDIA HAS BOTTOMED MOVE LONG The chart is that of INDIA We now have two legs Down and to a nice .382 pullback .This now see a nice rally under Both wave counts . best of trades WAVETIMER

NIFTY still bearish targeting the 1W MA100 at 22250.The Nifty 50 Index (NIFTY) has been trading within a Channel Down pattern, with its latest Lower High being exactly on the 1D MA50 (blue trend-line). This caused the rejection that initiated the current Bearish Leg.
As we've already completed a 1D Death Cross, the last two times we saw a similar Channel Down was during December 2022 - March 2023 and October 2021 - June 2022. Both of those patterns hit the 1W MA100 (red trend-line) before forming a bottom and rebound.
The March 2023 in fact, was priced exactly on the 0.5 Fibonacci retracement level. With their 1D RSI sequences also identical, we expect the bearish trend to continue for around another 30 days before the Channel Down bottoms on the 1W MA100 - 0.5 Fib cluster. Our Target is 22250.
-------------------------------------------------------------------------------
** Please LIKE 👍, FOLLOW ✅, SHARE 🙌 and COMMENT ✍ if you enjoy this idea! Also share your ideas and charts in the comments section below! This is best way to keep it relevant, support us, keep the content here free and allow the idea to reach as many people as possible. **
-------------------------------------------------------------------------------
💸💸💸💸💸💸
👇 👇 👇 👇 👇 👇

HBL Engineering- Possible DOUBLE BottomPossible Double Bottom formed by HBL Engineering, major support held 515-520 on the weekly chart. Breakout above its 726 resistance with a clear close above should target 1000 gradually( the break out target)

KPIT Tech- Support held, upmove in progressKPIT TECH- held the support zone perfectly well, next upmove faces resistance at zones mentioned, 0.5 FIB level is the key now.
Take gains if entered short term trades at levels.

Inverse head and shoulder pattern monthly chart Just for education purpuse
Its look like inverse head and shoulder patern on monthly chart
thanks

stock for swing MAZAGON DOCK SHIPBULL LTD
BUYING RANGE - 2315-2380
STOPLOSS-1890
TARGET - 2470-2550-2650
Mazagon Dock Shipbuilders Limited (MDL), Mumbai, established in 1774, is a prominent shipyard in India. Initially a small dry dock, MDL has evolved into a renowned shipbuilding company. It has constructed 801 vessels since 1960, including warships, submarines, cargo/passenger ships, and offshore platforms.

ZOMATO- KEY PRICE LEVELSThe entire move from the Flash crash level of JUNE 4 on ZOMATO
Targets at lower levels marked, should hit the 0.618 FIB level if we see move below 226 where it stopped yesterday.
May not break 200-207, wick down to 200 possible but likely to hold barring a major sell off
Stops below 200 for short term trades when it does come down to 210 odd

NIFTY Best buy opportunity before +20% rise.The Nifty 50 Index (NIFTY) has been trading within a Channel Up every since the June 2022 market bottom of the Inflation Crisis. Last week it broke below its 1W MA50 (blue trend-line) for the first time since March 27 2023 and this week touched the bottom of the Channel Up.
As long as it closes the 1W candle inside the Channel Up, the trend will technically remain bullish. The standard rally of the previous Bullish Legs has been +20%. As a result, we can remain bullish for now and target 27500 (just below the +20% mark).
If it closes a week below the Channel Up, we may very well see further technical correction until it either hits the 1W MA100 (green trend-line) or the 1W RSI gets bearish below 40.00 towards the bottom of its 3-year Rectangle.
-------------------------------------------------------------------------------
** Please LIKE 👍, FOLLOW ✅, SHARE 🙌 and COMMENT ✍ if you enjoy this idea! Also share your ideas and charts in the comments section below! This is best way to keep it relevant, support us, keep the content here free and allow the idea to reach as many people as possible. **
-------------------------------------------------------------------------------
💸💸💸💸💸💸
👇 👇 👇 👇 👇 👇

HERO MOTOR- MAJOR CORRECTIONHero Motor Corp- Almost a 3x from March 2023 to Sept 2024. Now under a severe correction, macro and tech factors in play.
Demand zone is 3600-3850, if breaks crucial 4K level.
Sideways in that zone will be good for accumulation for target back 4500+.
Large caps getting attractive in this fall.

BAJAJ AUTO Shortterm VIEW BEARISHAfter a good run from Rs.4,000 (in APRIL 2023) Stock has doubled and more to Rs.10,000.
Along the journey We have seen small consolidations at Rs.8,500-9,300 and stock reached Rs.10k After that we have seen a small dip towards 8,800.
Now its forming a HNS Pattern in Weekly TF.
I expect a Downside correction to 7,000-7,300 Zone.
I also believe Automobile Sector will go through some consolidation.

HERO MOTOR- SUPPORT TESTHero Motor broke out of a crucial level at 2900 where multi month resistance was seen. Post that its rise was halted at 6K+ and now its testing a crucial level of support- 0.618 FIB level , break of which can be bad for the stock -mid term. Correction is heavy on this stock, should watch this level carefully over the next 2-3 weeks.

HBL- Trading levelsHBL- range bound, like many stocks. Should be testing the lower end at 560-570 again in a weak market, ideal entry point for a good 15% or more.

HEG Skyrockets! All Targets Nailed with RisologicalHEG on the 1-Hour timeframe successfully executed a long trade with all targets from TP1 to TP4 hit with remarkable precision.
Trade Highlights:
Entry: ₹428.35
Targets Hit:
TP1: ₹448.85
TP2: ₹482.00
TP3: ₹515.20
TP4: ₹535.70
Stop Loss: ₹411.75
Technical Insights:
This trade showcased the accuracy and reliability of the Risological Trading Indicator in identifying optimal entry points and scaling through multiple target levels. The upward trend was well-sustained, demonstrating confidence in the tool's ability to manage trades effectively.

Buy The Anup Engineering Short Term Trading Advice by Goodluck Capital
Buy The Anup Engineering
Buy Range- 3530 - 3630
Target- 3850 - 3900
StopLoss- below 3330
Potential Return- 8-9%
Approx trade duration 12 - 14 days

Rolex Rings Ready for Takeoff: Long Trade Targets ₹2741!Rolex Rings on the 4-hour timeframe is presenting a fresh long trade opportunity, with the price currently hovering around the entry level. This setup, identified using the Risological Swing Trading Indicator, is primed for a strong upward move targeting 2741.60 at TP4.
Rolex Rings Key Levels:
TP1: 2267.90
TP2: 2448.85
TP3: 2629.80
TP4: 2741.60
Technical Analysis:
The entry price is set at 2156.05, with a stop-loss at 2065.55, ensuring effective risk management.
The price recently broke through a significant resistance zone, signaling bullish momentum. With the Risological trend line confirming the upward bias, this trade setup offers a high-reward opportunity for traders looking to capitalize on the next potential rally.
Namaste!

DELHIVERY INTRADAY TARGETS DONE!Delhivery on the 15-minute timeframe delivered a stellar intraday performance, achieving all predefined targets with precision. This long trade was executed using the Risological Swing Trading Indicator , ensuring a well-timed entry and a disciplined approach.
Delhivery Key Levels:
TP1: 340.80 ✅
TP2: 346.20 ✅
TP3: 351.60 ✅
TP4: 354.90 ✅
Delhivery Technical Analysis:
The trade was initiated at an entry price of 337.45, with a stop-loss positioned at 334.75 to limit downside risk.
Delhivery exhibited strong bullish momentum, crossing the Risological trend line early in the session.
The stock maintained upward movement, achieving all take-profit levels in this intraday trade. This setup highlights the power of the Risological indicator in capturing quick and profitable opportunities in volatile markets.
All the best and do follow me for more success stories, insights, tips and profitable stock calls.
Namaste!

ITI Hits TP1! Target ₹450—Daily Chart Breakout!Indian Telephone Industries (ITI) on the daily timeframe has achieved TP1 and shows strong bullish momentum, making it highly probable to achieve TP2, TP3, and TP4. This trade was identified using the Risological Swing Trading Indicator , providing clear entry, stop-loss, and target levels.
Key Levels:
TP1: 301.40 ✅
TP2: 357.90 (Pending)
TP3: 414.40 (Pending)
TP4: 449.30 (Pending)
Technical Analysis:
The trade entry at 266.50 was confirmed with a breakout above key resistance levels, supported by bullish price action. The stop-loss is tightly placed at 238.25, ensuring risk is well managed. The current upward trajectory aligns with the Risological trend, signaling strong continuation toward the upper targets.
Traders should monitor the price action near TP2 and TP3 for any signs of consolidation or resistance, with the expectation of further upside potential.
