Bearish Reversal in Play! | Key EMA Rejection & Support Targets🔍 Chart Analysis Summary
🕐 Timeframe: Likely a short-term (H1 or H4) chart.
📈 Asset: Most probably XAU/USD (Gold) or a similar asset.
🔴 Trend Breakdown
📍 Previous Trend:
✅ Strong bullish momentum 📈 pushing price into a resistance zone.
📍 Current Price Action:
🚨 Bearish rejection from resistance 🟥
Price got rejected exactly at the resistance zone (gray box) and the EMA 50 line 🔴 — a classic setup for a reversal ⚠️
📉 Key Technical Levels
🟦 Resistance Zone:
🔹 Between 3,385 – 3,400 USD
🧱 This zone rejected price strongly (see red candles)
📌 Also aligned with EMA 50 (3,400.837) — confluence adds strength 💪
🟩 Support Zones:
First Support Zone – ~3,285 📉
💙 In line with the EMA 200 (3,285.687)
🛡️ Might cause a temporary bounce 📈
Second Support Zone – ~3,240
📉 Marked as the deeper support in the bear case 🕳️
💥 If the first support breaks, this becomes the next target 🎯
📊 Indicator Insights
EMA 50 (🔴 Red): 3,400.837 – acting as dynamic resistance 😤
EMA 200 (🔵 Blue): 3,285.687 – acting as dynamic support 🛡️
📉 Price breaking below EMA 50 = first bearish sign
📉 Approaching EMA 200 = watch for either a bounce 🏀 or a breakdown 💥
🎯 Bearish Setup Forecast
📉 Here's what the arrows show (strategy logic):
📉 Breakdown below resistance → strong bearish move
🎯 Target 1: First support (EMA 200 / ~3,285)
🔄 Minor pullback possible (fake bounce 🪃)
💣 Continuation lower toward next support (~3,240)
📌 Critical Zone to Watch 🔍
⚫️ The circle marked “FOCUS ON THIS POINT” is key:
📌 Failed retest = confirmation of resistance
📌 Price rejected this level + closed below = strong bearish signal 🚨
🧠 Professional Insights
Element Observation Emoji
Trend Shift Bullish ➡️ Bearish reversal 🔄📉
Momentum Bearish pressure increasing 💨🟥
Risk Point Resistance near EMA 50 ⚠️🧱
Trade Idea Short toward supports 📉🎯
Confirmation Rejection candle after retest 🕯️🔁
Focus Level EMA confluence near resistance 🎯📌
🛠️ Possible Trade Plan (for educational purposes only)
Short Entry: Below 3,385 (after rejection 🔻)
Stop-Loss: Above 3,405 (above EMA 50 🛑)
Target 1: 3,285 🧲
Target 2: 3,240 📉
Indicators

EUR/USD Bearish Setup Unfolding Below Key Resistance📊 Technical Analysis of EUR/USD (4H Chart)
🧭 Chart Overview:
Current Price: ~1.1350
Indicators Used:
EMA 50 (Red): ~1.1311 — acting as dynamic support.
EMA 200 (Blue): ~1.1114 — aligns closely with major support zone.
📌 Key Levels:
🔼 Main Resistance Zone: 1.1375 – 1.1400
Price has tested this zone multiple times, forming a potential double top pattern.
Strong bearish pressure observed each time price enters this area.
🔁 Minor Resistance (Retest Zone): ~1.1325 – 1.1345
Currently acting as a decision zone.
If price fails to hold above this level, it could turn into resistance on the next bearish leg.
🔽 Support Zone: 1.1100 – 1.1130
Converges with EMA 200 — making it a high-probability demand zone.
Potential target for the anticipated drop.
🧠 Price Action & Structure:
Market showed a strong bullish rally previously, breaking through resistance levels.
Now showing signs of exhaustion at the top.
Bearish scenario projected with a lower high forming below the main resistance, followed by a sell-off toward the support zone.
⚙️ Possible Scenarios:
Bearish Scenario (High Probability):
Price rejects the minor resistance → breaks below EMA 50 → continues lower to support.
Target: 1.1110 area.
Bullish Scenario (Low Probability):
Price reclaims and closes above 1.1375 with strong momentum.
Potential breakout and continuation toward 1.1450+.
🧩 Confluences Supporting Bearish Bias:
Lower high formation potential.
EMA 50 starting to flatten.
Failure to maintain momentum above main resistance.
Clean drop path toward 1.1110 if support breaks.
📉 Conclusion:
This setup favors short-term bearish movement, particularly if the price rejects around the 1.1345 level again. A breakdown below the minor resistance zone would likely trigger a sell-off toward the 1.1110 support, in line with the 200 EMA.

XAU/USD Target Achieved – $3,500 Successfully Hit 🔥 XAU/USD Target Smashed – $3,500 HIT! 🎯💰
Gold has officially reached $3,500, perfectly hitting our projected buy target!
This move confirms the strength of the bullish momentum and technical breakout setup.
🔹 Entry: Above $3,430
🔹 Final Target: ✅ $3,500 – Hit
🔹 Result: High-conviction setup delivered with precision
🔹 Trend: Remains bullish, but profit-taking expected at round number resistance
👏 Massive congrats to all who followed the plan — another clean win on XAU/USD!

BTC/USD Eyes $109K After Bullish Breakout!!🧠 Chart Type and Indicators:
Chart Type: Candlestick
Indicators Used:
EMA 50 (red line): 85,335.18
EMA 200 (blue line): 85,657.29
🔍 Technical Pattern Analysis:
Pattern Identified: Ascending Triangle
The price has formed higher lows (ascending trendline support) while repeatedly testing a horizontal resistance zone (~$88,000), forming an ascending triangle.
This is typically a bullish continuation pattern when it occurs after an uptrend, though in this context, it's forming after a consolidation, giving more significance to the breakout.
🚀 Breakout Confirmation:
The price has broken above the horizontal resistance and is currently trading at $92,766.51.
Volume is not visible but should be increasing during a valid breakout.
Both EMAs have been decisively breached to the upside, signaling momentum shift in favor of bulls.
🧩 Key Levels:
Support Zone (Post-Breakout Retest): ~$88,000
Previously a resistance zone, now likely to act as support.
Immediate Resistance: ~$96,000
Historical resistance zone shown on the chart with a horizontal black line.
Extended Target (measured move): ~$109,420
Based on the height of the triangle projected from the breakout point.
📈 Price Action Forecast:
Two possible scenarios (depicted with arrows on the chart):
Bullish Continuation:
A retest of the $88,000 zone followed by continuation to $96,000, then $109,420.
Short-Term Pullback:
Price may dip to retest the breakout zone (~$88,000), consolidate, then rally higher.
✅ Bullish Signals Summary:
Breakout from a bullish ascending triangle.
EMAs crossed and price holding above them.
Clear higher highs and higher lows formation.
Momentum suggesting further upside.
🧨 Risks to Watch:
False Breakout Risk: If the price fails to hold above $88,000 and falls back into the triangle range.
Macro Factors: Bitcoin remains sensitive to macroeconomic news and regulations that could disrupt technical setups.

WTI Crude Oil Bearish Reversal Setup – Short from Resistance ZonEntry Point: 62.66 USD
Stop Loss: 65.26 USD
Target Point (Take Profit): 55.09 USD
Indicators:
EMA 200 (blue): 60.92 USD — long-term trend indicator
EMA 30 (red): 60.75 USD — short-term trend indicator
Analysis:
1. Bearish Setup:
The price is approaching a key resistance zone marked by the purple shaded area near 62.66.
The strategy is to short from this level, anticipating a drop to the 55.09 target area.
2. Risk/Reward:
Risk (SL - Entry): 65.26 - 62.66 = 2.60 USD
Reward (Entry - TP): 62.66 - 55.09 = 7.57 USD
Risk-to-reward ratio: ~1:2.9, which is favorable.
3. Support/Resistance Confirmation:
Multiple touches at the resistance zone (or

USD/CHF Bearish Tri Breakout - 5 Signs of a Strong Bearish BreakOANDA:USDCHF Bears have started the week off hot with Price having dropped 1.16% at the time of publication since Market Open. This price decline has seen a Breakout and fresh low after price has been caught in a Bearish Triangle Pattern, formed by Lower Highs into a Support Level.
1) Price has been trading well Below the 200 EMA.
2) After Price makes contact of the 34 EMA Band while attempting a Breakout of the Falling Resistance of the Triangle, it is sent back down into pattern.
3) After the rejection at the Falling Resistance, we see an influx of Volume enter the Markets, ultimately leaning Bearish.
4) All the Price Action while in Pattern has happened while the RSI has been Below 50, adding Bearish Pressure.
5) Price has made a strong Bearish Candle Break so far of the Support Level of the Triangle and the currently Low of Price @ .80684 has given us a new Lower Low, breaking the Support Level Low @ .80983, suggesting Bears have taken the Support Level and will turn it Resistance.
** With all Indications combined, I believe we are looking at a True Bearish Breakout of the Triangle and will be looking for a Break & Retest Set-Up!
--> Once Price Confirms the Break and Closes, We should expect a Retest of the Break of Support between ( .80983 - .81141 ) to deliver potential Short Opportunities!
Now, Fundamentals:
Price Action lately has heavily been influenced by a couple factors:
- Federal Reserves current dilemma with deciding to not cut Interest Rates in the assumption that the Tariffs will Rise Inflation while the CPI y/y on April 10th printed a -.4% drop from 2.8% to 2.4% which could create complications later if Interest Rates are not cut soon enough.
(If Global Trade slows, that alone will Inflate prices, Tariffs (once applied) will affect as well)
- ECB has made the decision to cut Interest Rates 25 bps from 2.65% to 2.4%. This alone in-time will start the act of slowing the economy so the euro doesn't inflate too much and, in theory, will make the Euro seem less attractive for foreign investment.
This could leave investors to lean towards one of the worlds most "Safe-haven" currencies, the Swiss Franc with the Franc currently hitting a 10-Year High!
www.tradingview.com

GOOG Alphabet Options Ahead of EarningsIf you haven`t bought GOOG before the previous rally:
Now analyzing the options chain and the chart patterns of GOOG Alphabet prior to the earnings report this week,
I would consider purchasing the 170usd strike price Calls with
an expiration date of 2025-7-18,
for a premium of approximately $4.35.
If these options prove to be profitable prior to the earnings release, I would sell at least half of them.

AAL American Airlines Group Options Ahead of EarningsIf you haven`t bought the dip on AAL:
Now analyzing the options chain and the chart patterns of AAL American Airlinesprior to the earnings report this week,
I would consider purchasing the 9usd strike price Puts with
an expiration date of 2025-5-2,
for a premium of approximately $0.44.
If these options prove to be profitable prior to the earnings release, I would sell at least half of them.

MRK Merck Options Ahead of EarningsAnalyzing the options chain and the chart patterns of MRK Merck prior to the earnings report this week,
I would consider purchasing the 80usd strike price Calls with
an expiration date of 2026-1-16,
for a premium of approximately $8.50.
If these options prove to be profitable prior to the earnings release, I would sell at least half of them.

TSLA Tesla Options Ahead of EarningsIf you haven`t bought TSLA before the recent rally:
Now analyzing the options chain and the chart patterns of LMT Lockheed Martin Corporation prior to the earnings report this week,
I would consider purchasing the 230usd strike price Puts with
an expiration date of 2025-4-25,
for a premium of approximately $10.70.
If these options prove to be profitable prior to the earnings release, I would sell at least half of them.

MBLY Mobileye Global Options Ahead of EarningsAnalyzing the options chain and the chart patterns of MBLY Mobileye Global prior to the earnings report this week,
I would consider purchasing the 14usd strike price Calls with
an expiration date of 2026-1-16,
for a premium of approximately $2.12.
If these options prove to be profitable prior to the earnings release, I would sell at least half of them.

CHTR Charter Communications Options Ahead of EarningsAnalyzing the options chain and the chart patterns of CHTR Charter Communications prior to the earnings report this week,
I would consider purchasing the 360usd strike price Calls with
an expiration date of 2025-9-19,
for a premium of approximately $22.35.
If these options prove to be profitable prior to the earnings release, I would sell at least half of them.

(XAU/USD) Bullish Setup: Demand Zone Bounce with 5.89% Trgt Ptnl🔵 Current Price: $3,451.03
🟡 EMA (9): $3,457.20
🔻 Price is just below EMA — short-term pressure.
Zones & Key Levels:
🟦 Demand Zone:
🔽 Price bounced here before — strong buyer interest!
📍 Zone Range:
* Top: $3,442.38
* Bottom (Stop Loss): $3,395.87
* 🔴 Stop Loss set here to limit risk.
🟨 Entry Point:
* Entry suggested at $3,457.20
* Just above the current price and EMA — needs confirmation
* ⚠️ Wait for bullish candle or price action signal above EMA
🟩 Target Point:
🎯 Target: $3,645
* 📈 Potential gain: +202.78 pts (5.89% upside)
* 🚀 Aiming to break previous ATH (All-Time High)
Visual Trade Plan Summary:
* ✅ Buy Entry: $3,457.20
* ❌ Stop Loss: $3,395.87
* 🎯 Target: $3,645.00
* ⚖️ Risk-to-Reward: Solid, over 3:1
Sentiment:
* If price respects demand zone and reclaims EMA — bullish setup
* 🕵️♂️ Watch for volume or confirmation candle near entry

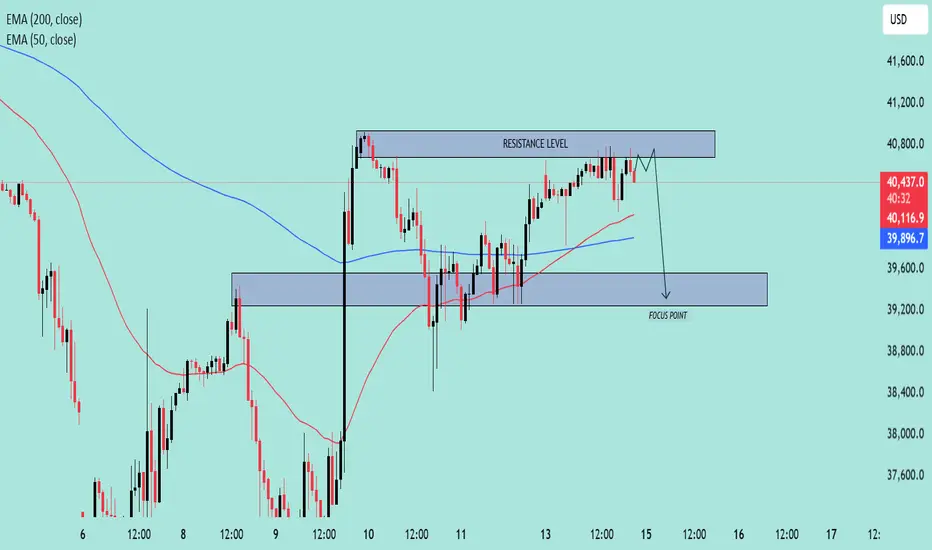
US30 Approaching Key Resistance–Potential Reversal Setup in Play🧠 Chart Overview
Asset: US30 (likely the Dow Jones Industrial Average)
Timeframe: Appears to be 1H or 2H
Indicators:
EMA 50 (Red): 40,119.5
EMA 200 (Blue): 39,897.3
Price at time of chart: Around 40,503
🔍 Key Technical Levels
🔴 Resistance Zone
Range: ~40,750 to 40,850
Price has tested this level multiple times and is currently hovering near it.
The resistance is holding, and no strong breakout has occurred.
🟦 Support / Focus Zone
Range: ~39,200 to 39,600
Marked as the “FOCUS POINT” – likely the expected target on a breakdown.
EMAs Insight:
Price is above both the 50 EMA and 200 EMA, suggesting short-term bullishness.
However, since it’s stalling at resistance, it could flip bearish on rejection.
🧭 Price Action Narrative
The chart suggests a potential fakeout above resistance, followed by a sharp rejection.
The path drawn shows a short-term dip, targeting the FOCUS POINT (support zone).
Rejection at resistance aligns with typical distribution behavior.
📌 Trade Idea (Bearish Bias)
Entry Idea: Short near or just above the resistance level (~40,800)
Target: 39,400 zone
Stop-Loss: Above the resistance level (~40,900+)
Risk/Reward: Favorable if price fails to break above resistance convincingly
📉 Bias: Bearish Reversal
Unless price breaks and closes above resistance with strong momentum, the chart favors a pullback scenario.
Gold (XAU/USD) Bullish Continuation Setup – Key Support Levels 📊 Chart Context & Setup
Chart Type: Candlestick
Indicators Used:
50 EMA (red): Currently at 3,199.009
200 EMA (blue): Currently at 3,123.168
Support Zone: Around 3,157.786 – 3,123.168
Current Price: Approximately 3,211.90
Focus Point (Target Zone): 3,283.810
🧠 Technical Analysis
🔹 Trend Analysis
Overall Trend: Bullish
Price is trading above both the 50 EMA and 200 EMA.
The EMAs are sloping upward, indicating strong momentum.
Golden Cross previously occurred (50 EMA crossing above 200 EMA).
🔹 Key Support & Resistance
Immediate Resistance Zone: Around 3,240
This area is acting as a potential rejection zone, with minor consolidation.
Support Zone (Highlighted): 3,157 – 3,123
This zone was previously a breakout level and now serves as a retest support.
It coincides with the 200 EMA, adding to its strength.
🔁 Scenarios Presented
Scenario A – Bullish Rejection from Immediate Support (3,199)
Price could hold above or near the 50 EMA.
Break and retest of minor resistance could lead to a push toward 3,283.81 (target).
This is a higher-risk entry as the support is not deeply tested yet.
Scenario B – Deeper Pullback to Major Support (3,157 – 3,123)
A drop below current price into the main demand zone.
Bullish engulfing or strong reaction in this zone would offer a high-probability long setup.
Ideal entry point for swing traders, especially if confirmed by volume or bullish candlestick reversal.
🎯 Trade Strategy Suggestion
✅ Long Setup
Entry Option 1: On bullish rejection above 3,199 with confirmation.
Entry Option 2 (Preferred): At strong support zone 3,157 – 3,123 with bullish reversal signal.
Target: 3,283.81
Stop Loss:
For Entry 1: Below 3,157
For Entry 2: Below 3,100 or 200 EMA, depending on aggressiveness
📌 Conclusion
This chart illustrates a classic bullish continuation setup with two potential entry scenarios:
A minor pullback and bounce from the 50 EMA.
A deeper retracement into a strong support zone aligned with the 200 EMA.
The uptrend remains intact as long as the price holds above the 200 EMA and the major demand zone. A break below 3,100 would invalidate the bullish outlook short-term

LMT Lockheed Martin Corporation Options Ahead of EarningsIf you haven`t bought LMT before the recent rally:
Now analyzing the options chain and the chart patterns of LMT Lockheed Martin Corporation prior to the earnings report this week,
I would consider purchasing the 490usd strike price Calls with
an expiration date of 2025-9-19,
for a premium of approximately $18.35.
If these options prove to be profitable prior to the earnings release, I would sell at least half of them.

BRIEFING Week #16 : ObservationHere's your weekly update ! Brought to you each weekend with years of track-record history..
Don't forget to hit the like/follow button if you feel like this post deserves it ;)
That's the best way to support me and help pushing this content to other users.
Kindly,
Phil

Bitcoin Bearish Reversal Setup: Rising Wedge Breakdown Targeting1. Entry Point:
Marked around $86,853, this is where a potential short (sell) trade might have been initiated.
2. Stop Loss:
Placed above $88,783, protecting the trade in case the market goes against the position.
3. Target Point (Take Profit):
Aiming down toward $74,443.76, suggesting a large bearish move is anticipated.
4. EMA Indicators:
30 EMA (Red Line) at ~$84,271: Indicates short-term trend.
200 EMA (Blue Line) at ~$83,496: Indicates long-term trend.
Price is currently trading above the 200 EMA but slightly below the 30 EMA, showing mixed short-term momentum.

Gold (XAUUSD) Trade Setup: Bullish Breakout Toward $3,637 TargeCurrent Price: $3,309.18
EMA 30 (Red Line): $3,265.00
EMA 200 (Blue Line): $3,163.35
Trend Direction: Strong uptrend (price above both EMAs)
Timeframe: 1-hour (short-term analysis)
📍 Key Levels
Entry Point: Around $3,266.63 (just above EMA 30)
Stop Loss: Around $3,265.00
Target (EA Target Point): $3,637.23
Potential Profit: +$365.01 or +11.16%
🔍 Technical Patterns & Zones
Rising Channel: Price is moving within a rising wedge or channel, indicating bullish momentum but with narrowing range — a potential reversal signal if broken.
Support Zone: Highlighted purple box around the entry point; likely a demand zone.
Resistance Zone: $3,637.23 area marked as the EA Target Point — previous resistance or Fibonacci extension level.
✅ Bullish Signals
Price is consistently making higher highs and higher lows.
EMAs are aligned in a bullish formation (short EMA above long EMA).
Clear breakout above consolidation range recently.
Trade setup shows favorable risk-to-reward ratio.
⚠️ Risks / Caution
Rising wedge can sometimes break down — watch for volume drop or divergence.
Potential pullback to the entry zone is expected (indicated by the arrow).
News Events: Symbols below the chart indicate upcoming USD economic data, which could bring volatility.
📈 Strategy Summary
Buy on pullback to $3,266.63 with tight stop at $3,265.00.
Target: $3,637.23 — potential 11% gain.
Risk: Minimal if stop is respected, tight stop-loss.

"Gold Demand Zone Bounce – High R:R Long Setup!"📈 This is a bullish setup using a demand zone bounce strategy on the 15-minute timeframe.
Key Zones & Levels
🔵 Demand Zone:
The blue box is where price previously bounced strongly.
Buyers are likely to step in again here.
✳️ Entry Point:
3,292.38
Just above the demand zone – a safe place to catch the next bounce.
⛔ Stop Loss:
3,280.93
Below the demand zone to protect against a breakdown.
🎯 Target Point:
3,345.09
Near a previous resistance area.
Potential gain: +51.94 pts / 1.58%
Indicators
🟡 EMA (7):
Current value: 3,303.63
Price hovering around EMA = consolidation or setup for a bounce.
Risk-Reward Calculation
⚠️ Risk: 11.45 points
✅ Reward: 52.71 points
⭐ Risk-Reward Ratio: ~4.6:1
Very favorable!
Price Action Summary
📊 Strong uptrend into demand zone
🔁 Minor pullback = potential setup
✅ Ideal entry after bullish confirmation (e.g., bullish candle pattern)
Conclusion
This setup looks solid:
✅ Clear demand zone support
✅ High R:R ratio
✅ Clean target above
Just wait for a bullish signal inside the zone and ride it up!

BTC/USD Short Setup – Triple Top Reversal with EMA Confirmation Entry Point (Sell): Around $85,699.52
Stop Loss: $86,741.44 (above resistance zone)
Target (Take Profit): $82,982.09
This provides a Risk-Reward Ratio of approximately 1:2, a commonly acceptable ratio in trading.
📈 Indicators:
EMA 30 (Red) is currently above the EMA 200 (Blue), indicating bullish momentum—but this setup anticipates a trend reversal.
If price breaks below the EMAs, that would confirm bearish strength.
🧠 Conclusion:
This setup is based on:
A strong resistance zone,
Bearish reversal pattern (triple top),
Risk management via stop loss and take profit levels.
If you're trading this:
Wait for confirmation with a bearish candlestick below the EMAs or a break of recent support.
Manage position size based on stop distance and your account risk tolerance.

Do You Know the Difference Between an Indicator and a Strategy?A lot of traders jump into Pine Script or apply a script on TradingView without understanding one key difference:
Indicators and Strategies are not the same — especially when it comes to real-time performance and backtesting.
---
What’s the Key Difference?
Indicators
Indicators are visual tools designed to help you analyze price action in real time . They do not track trade performance or simulate trades automatically.
You can use them to:
- Generate signals
- Stack confluences
- Set custom alerts
- Overlay custom visuals on charts
Best for: Chart analysis, signal confirmation, and manual or semi-automated alerts.
---
Strategies
Strategies are built for backtesting . They simulate how your trade logic would have performed historically, using `strategy.entry`, `strategy.exit`, and related functions.
They automatically calculate:
- Hypothetical P&L
- Win/loss ratio
- Drawdowns
Best for: Validating trade logic, optimizing entries and exits, performance tracking.
---
But Here’s the Catch
Many traders assume that once a strategy backtest looks good, it will behave exactly the same in live trading. This assumption can lead to poor decision-making.
❌ Why Forward Testing Isn't Perfect
When you set alerts based on a strategy, you're asking a backtest engine to behave like a live trading engine — and that’s not what it was designed for.
TradingView strategies:
- Only execute on candle close
- Do not simulate intrabar price action
- Do not account for slippage
- Do not reflect real-time market volatility
So:
- Your strategy alert may fire late compared to actual price movement
- Your SL/TP may be hit within a candle, but the strategy won’t know until close
- You may see better backtest results than what happens live
---
Takeaway
If you're using strategies with alerts, it’s critical to understand these constraints:
TradingView’s strategy engine is optimized for historical testing, not for real-time execution. It provides insight into the validity of your logic — but it’s not a replacement for a live execution engine.
Best Practice Recommendations:
- Always forward-test on a demo or paper account first
- Monitor how alerts perform in real-time
- Be ready to adjust parameters based on your asset and timeframe
If you need better responsiveness or real-time adaptability, consider using indicators to generate your alerts. Indicators react to price in real time and are often more suitable for live market conditions.
---
Final Note
Some strategies are built with these limitations in mind. They can still be useful in real-time trading as long as you're aware of how they work.
Transparency is key. Backtesting is a guide, not a guarantee.
Trade smart, stay informed.
Feel free to reach out if you have questions or insights to share!

EUR/USD Bearish Setup Unfolding Below Key Resistance📊 Technical Analysis of EUR/USD (4H Chart)
🧭 Chart Overview:
Current Price: ~1.1350
Indicators Used:
EMA 50 (Red): ~1.1311 — acting as dynamic support.
EMA 200 (Blue): ~1.1114 — aligns closely with major support zone.
📌 Key Levels:
🔼 Main Resistance Zone: 1.1375 – 1.1400
Price has tested this zone multiple times, forming a potential double top pattern.
Strong bearish pressure observed each time price enters this area.
🔁 Minor Resistance (Retest Zone): ~1.1325 – 1.1345
Currently acting as a decision zone.
If price fails to hold above this level, it could turn into resistance on the next bearish leg.
🔽 Support Zone: 1.1100 – 1.1130
Converges with EMA 200 — making it a high-probability demand zone.
Potential target for the anticipated drop.
🧠 Price Action & Structure:
Market showed a strong bullish rally previously, breaking through resistance levels.
Now showing signs of exhaustion at the top.
Bearish scenario projected with a lower high forming below the main resistance, followed by a sell-off toward the support zone.
⚙️ Possible Scenarios:
Bearish Scenario (High Probability):
Price rejects the minor resistance → breaks below EMA 50 → continues lower to support.
Target: 1.1110 area.
Bullish Scenario (Low Probability):
Price reclaims and closes above 1.1375 with strong momentum.
Potential breakout and continuation toward 1.1450+.
🧩 Confluences Supporting Bearish Bias:
Lower high formation potential.
EMA 50 starting to flatten.
Failure to maintain momentum above main resistance.
Clean drop path toward 1.1110 if support breaks.
📉 Conclusion:
This setup favors short-term bearish movement, particularly if the price rejects around the 1.1345 level again. A breakdown below the minor resistance zone would likely trigger a sell-off toward the 1.1110 support, in line with the 200 EMA.

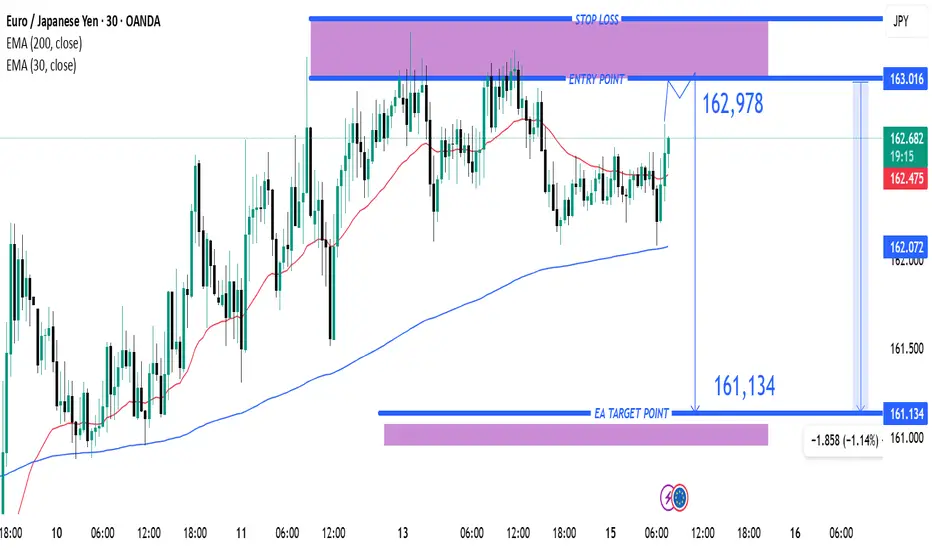
EUR/JPY Short Setup – Bearish Reversal Targeting 161.134 with TiEMA 30 (red): Currently at 162.470
EMA 200 (blue): Currently at 162.071
Trade Setup:
Entry Point: Around 162.978
Stop Loss: Slightly above 163.016 (highlighted in purple zone)
Target (Take Profit): 161.134 (labeled as “EA TARGET POINT”)
Analysis:
Trend: The pair has been trending upwards recently, as shown by the price staying above the 200 EMA.
Current Price: 162.604, just below the proposed entry.
Risk/Reward:
Risk: ~3.8 pips (entry to stop loss)
Reward: ~184.4 pips (entry to target)
This implies a favora