INJ – From Overhyped to Reasonable OpportunityA year and a half ago, INJ was in full hype mode, with fantasmagorical predictions of $200+, even though the coin had already done a 40x move.
(And not to brag—but at that moment, with INJ trading around $40, I said that $10 was far more likely than $200. It actually dropped to $6.5...)
Fast forward to today, and things are starting to look more constructive—at least, if you're not aiming for the moon:
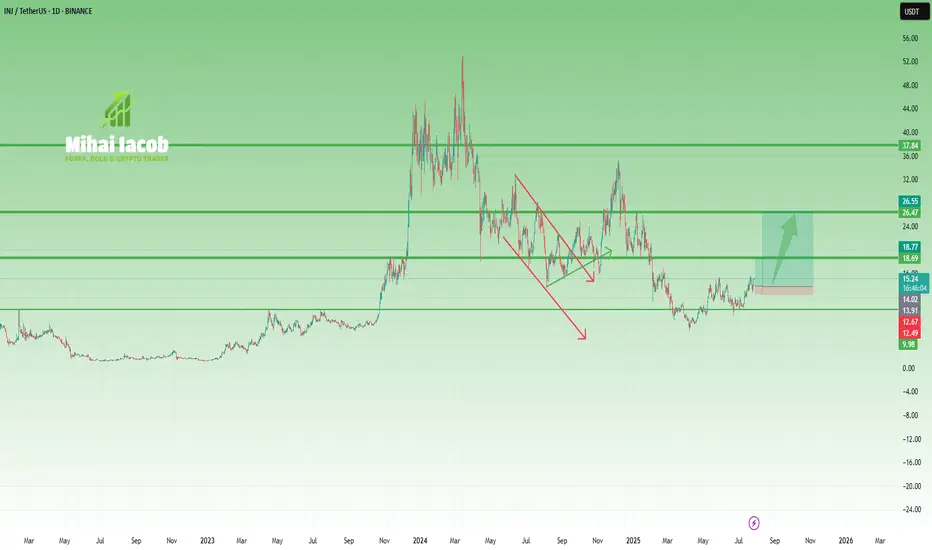
🔹 After the local low at $6.5, price formed a small inverted Head & Shoulders
🔹 Then it confirmed new support at $10, a key psychological level and neckline zone
🔹 Now it's pressing into the $15.5 resistance
From my perspective, the setup is starting to favor the bulls.
If we get a clean breakout above $15.5, the next resistance is around $20, but I wouldn’t be surprised to see a push to $25–26, or even slightly above $30, if momentum builds.
📌 Not a hype call.
It’s a realistic technical setup, built on structure—not dreams.
Injective
INJUSDT Descending Broadening WedgeINJUSDT is showing signs of a potential bullish breakout after rebounding from the lower boundary of a descending broadening wedge classic reversal pattern.
The price bounced from strong support around the $7.5–$9 zone, which aligns with historical buying interest. After bouncing from this key demand area, INJ has pushed higher and is now approaching a critical resistance level near $15.5. If the resistance breakout confirms, we can expect a bullish continuation towards the $25-$50. level
Cheers
Hexa

INJ - Back Bullish!Hello TradingView Family / Fellow Traders. This is Richard, also known as theSignalyst.
📈INJ has been overall bullish trading within the rising wedge pattern marked in blue.
This week, INJ has been retesting the lower bound of the wedge.
Moreover, the green zone is a strong demand.
🏹 Thus, the highlighted blue circle is a strong area to look for buy setups as it is the intersection of the lower blue trendline and green demand.
📚 As per my trading style:
As #INJ approaches the blue circle zone, I will be looking for trend-following bullish reversal setups (like a double bottom pattern, trendline break , and so on...)
📚 Always follow your trading plan regarding entry, risk management, and trade management.
Good luck!
All Strategies Are Good; If Managed Properly!
~Richard Nasr

INJ/USDT at a Crucial Breakout Zone: Will the Path to $35 Unfold🧠 Full Technical Analysis (Daily Timeframe - KuCoin):
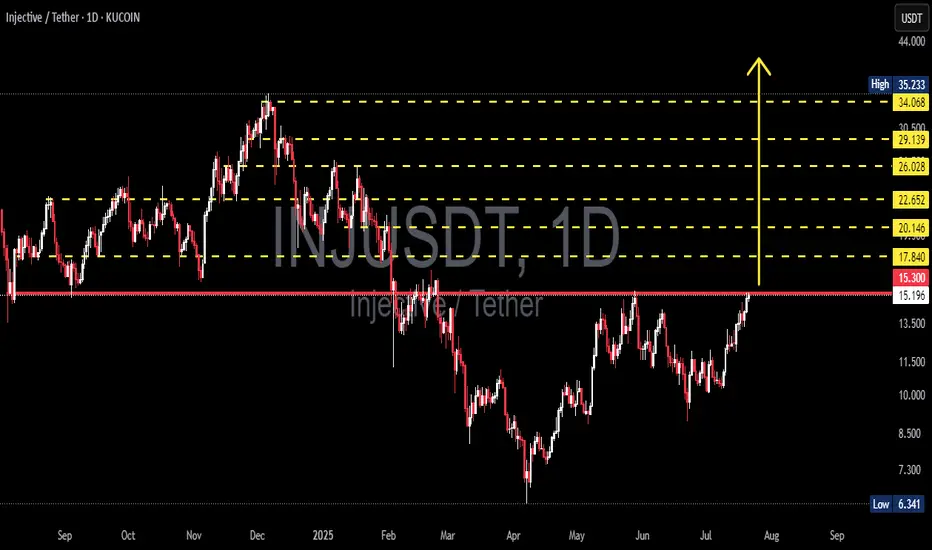
INJ/USDT (Injective Protocol) is currently at a critical decision point, testing a major resistance zone that has held strong since early 2025. After months of consolidation and a consistent structure of higher lows since May 2025, bullish pressure is now building momentum.
📊 Chart Pattern: Ascending Triangle Breakout in Progress
The price structure reveals a classic Ascending Triangle formation:
🔼 Rising support (higher lows) → signals accumulation.
⛔ Flat resistance at $15.30–$15.50 → key supply zone repeatedly tested.
This is a bullish continuation pattern, often leading to explosive upside once broken.
If the breakout is confirmed, INJ could rally through several historical resistance levels with strong potential for upside momentum.
📍 Key Resistance & Target Levels (Potential Take Profits):
Once price breaks above the key resistance, watch the following upside targets:
Level Significance
$17.84 Initial breakout confirmation level
$20.14 Psychological resistance & volume cluster
$22.65 Previous consolidation zone
$26.02 Intermediate high structure
$29.13 Strong resistance & prior distribution zone
$34.06 Final hurdle before reclaiming highs
$35.23 🔥 Major breakout target
🟢 Bullish Scenario:
✅ Daily close above $15.50 with strong volume = confirmed breakout.
🚀 Sequential target levels activated: $17.84 → $22.65 → $29.13 → $34.06.
💥 Potential for FOMO rally beyond $20, triggering long-term bullish trend.
🔴 Bearish Scenario (Rejection Case):
❌ Failure to break $15.30 leads to rejection.
⚠️ Downside targets: $13.20 → $12.00 → $10.60.
❌ Drop below $10.00 invalidates higher low structure and may trigger bearish reversal.
🧨 A sharp rejection may form a potential Double Top pattern, leading to downside pressure.
📈 Trading Strategy Recommendations:
🎯 Conservative Entry: Wait for breakout + retest confirmation at $15.50.
⚡ Aggressive Entry: Buy the breakout with tight stop-loss below $14.80.
📌 Consider laddered take-profits at each resistance level.
🔒 Use risk management — false breakouts are common in this zone.
---
🔍 Summary: Breakout Imminent or Final Rejection?
INJ is on the verge of a high-impact move. A confirmed breakout would likely trigger a trend reversal to the upside, while a failure could lead to another leg down. The next few candles will decide the medium-term direction. Traders should stay sharp, and act with a plan — this could be the start of something big.
⚠️ Always Trade with Discipline and Risk Management!
#INJUSDT #InjectiveProtocol #CryptoBreakout #AltcoinSetup #TechnicalAnalysis#BullishCrypto #PriceAction #CryptoSignals #BreakoutTrade #CryptoStrategy
INJUSDT Bulls Are Back! All-Time High Could Be Next!
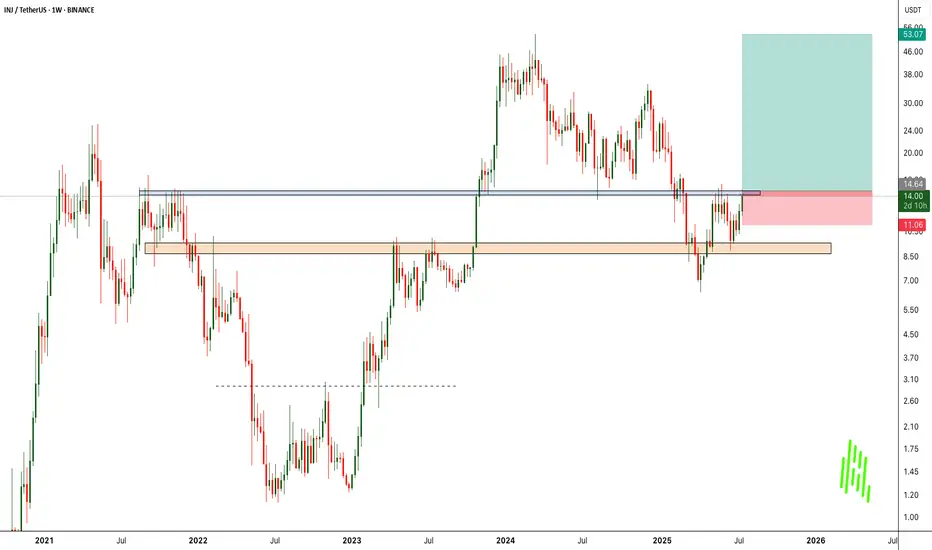
BINANCE:INJUSDT has shown a strong and clean bounce from a major support zone, indicating that buyers are stepping in aggressively at lower levels. This bounce reinforces the strength of the current uptrend and reflects growing bullish sentiment.
At the moment, the price is facing a significant resistance level. This area has previously acted as a barrier, but with increasing volume and momentum, we expect BINANCE:INJUSDT to break out from this resistance and continue its upward move.
If the breakout occurs, our target is the previous all-time high, as there is limited resistance above the current zone. This presents a high-reward opportunity for traders looking for breakout setups.
As always, managing risk is key. Use a well-placed stop loss below the support level to protect your capital. Breakouts can be explosive, but discipline and proper risk management make all the difference.
BINANCE:INJUSDT Currently trading at $14.4
Buy level : Above $14.5
Stop loss : Below $11
Target 1: $20
Target 2: $35
Target 3: $40
Target 4: $53
Max leverage 2x
Always keep stop loss
Follow Our Tradingview Account for More Technical Analysis Updates, | Like, Share and Comment Your thoughts
INJ - Back from the Dead?Hello TradingView Family / Fellow Traders. This is Richard, also known as theSignalyst.
INJ has been hovering within a wide range between our two green zones, spanning from $10 to $16.
For the bulls to take control in the medium term, a break above the last major high marked in blue is needed.
To confirm long-term bullish dominance, a breakout above the upper boundary of the green range is required.
📚 Always follow your trading plan regarding entry, risk management, and trade management.
Good luck!
All Strategies Are Good; If Managed Properly!
~Rich

$INJ to re-enter my buy zone? $11.12 must hold!Altcoins are experiencing another pullback.
CRYPTOCAP:INJ had a solid pump recently, but it’s now facing a significant drop.
This could be a good buying opportunity — assuming we’re not entering a bear market.
Key level: $11.12 must hold.
If it breaks, the next major support is around $9.10.
While the macro trend remains bullish, this retracement is concerning.
Set your stop losses accordingly.
DYOR.
#INJ #Altcoins #CryptoTrading #MarketUpdate #CryptoAlert #BuyTheDip #DYOR

Injective INJ price analysis🔼 We saw an infographic showing that the #Injective ecosystem currently ranks second in terms of capital inflow and retention. (First place goes to #Ethereum CRYPTOCAP:ETH with a threefold lead.)
🕯 Now let's check this information on the OKX:INJUSDT price chart, and we can see that there is indeed “buyer power”. After two months of growth, the price of #INJUSD is now adjusting quite moderately.
🍿 So, if #Injective is “preparing something really interesting” for the summer, then the price of their #INJ token should not fall below $10.
From there, it will be possible to organize “modest” growth, at least up to $27.
_____________________
Did you like our analysis? Leave a comment, like, and follow to get more

Injective & Elliott WavesAn impulse leads to a correction. A correction leads to an impulse.
The chart here starts with a bullish impulse. 1,2,3,4,5—blue-left. This impulse leads to a correction. ABC—orange.
The first ABC correction, the bear market, ends June 2022.
A correction leads to an impulse so a new bullish impulse starts right after and we have a new 5-up waves. 1,2,3,4,5—blue-center.
The bullish impulse ends March 2024 and this leads to a new ABC correction. Orange-right. The correction hits bottom 7-April 2025. The end of the correction signals the start of a new bullish impulse, 1,2,3,4,5 blue-right. The 2025 bull market.
This is Elliott Wave Theory simplified.
Namaste.

Injective Easy 584% Bullish Wave Now PossibleInjective is now ready after a very long period of correction. The peak for this pair happened in March 2024 and in December 2024 there was no higher high, instead, a classic lower high and now a complete ABC correction. This ABC correction comes after a perfect, long-term, 1,2,3,4,5 bullish impulse.
After this correction ends will be the start of a new bullish impulse which will lead to a new All-Time High. The 584% target on the chart is an easy one. The 209% is super easy and can be approached by all types of market participants. This is a strong project.
There is really high volume as prices move to "baseline level." This is a support zone that was created after a long consolidation in 2023. Almost 7 months of consolidation. Sideways, and now this same range that worked as resistance is working as support. Support is confirmed because volume is rising, a very strong rise. INJUSDT is about to grow.
The entire Injective bullish wave, with a bottom in 2022 and a peak in 2024 amounted to 4,631% total growth. This is perfect and the market is ready now for a new round of growth.
Feel free to accumulate; buy and hold.
Namaste.

Injective Short-Term Inverse Head & Shoulders Bottom ReversalBITGET:INJUSDT successfully completed an IH&S Bottom Reversal pattern.
The measured target is $15.20, reinforced by the 200-day EMA.
If you missed the entry, watch the $10.80 neckline for a potential retest as support.

Injective Bullish Reversal Signals —Technical Analysis WorksThe reversal signals show up in so many ways. Some can be predicted with the candles, for example, here the bottom session produced a high volume Doji, a clear reversal signal. The action that followed this Doji confirmed this signal.
There was a low first in February, the session ended with high volume and green.
There was a lower low in March (left shoulder), the action ended with relatively high volume and green. The bullish signal comes from the fact that bearish volume is dropping, not present.
The final low came in 7-April (head) and this session also ended green with high volume. The bottom is in.
The action later went on to produce an inverted Head & Shoulder pattern, another reversal signal fully confirmed.
After a small retrace, we will see additional growth.
These candles, these indicators, these signals and patterns help us predict where the market is headed next.
Short-term, as in days or maximum a week or two, anything goes. There can be a small drop or whatever, long-term, it is going up. Based on the signals coming from this chart.
Knowing this, we can buy, we can hold and we can trade.
It is not easy, but everybody can learn this craft if they have what it takes.
Not everybody can be a professional football player, not everybody can do acrobatics on a motorbike, but it can be done by anybody who puts enough time, heart and effort in knowing how to get it done.
The "intelligent investor" is for those that have no time or simply don't want to learn how the market works. It is ok, it is a tool and can be used successfully, but does not mean that timing the market is impossible, it simply means that most people can't or choose not to do so.
Now, tell me again about your random walk.
Namaste.

Injective | INJ & AvalonThe price of Injective 8 dollar today with a 24hour trading volume of 69 million dollar. This represents a 13% price increase in the last 24 hours and a 29% price increase in the past 7 days. With a circulating supply of 80 Million INJ, Injective is valued at a market cap of 640 million dollar.
Injective is a blockchain built for finance. It is an open, interoperable layer1 blockchain powering next gen DeFi applications, including decentralized spot and derivatives exchanges, prediction markets, lending protocols..
Injective is upgrading its Avalon mainnet with overwhelming community support. The upgrade aims to enhance L1 scalability, achieve sub-second block generation time, and implement PoS delegation transformation.the upgrade will optimize transaction processing speed, network efficiency, and security within the Injective ecosystem
Inj price is up 400% since we posted the first analysis on January and it tries to recover as fast as possible. most indicators sending a buy signal and the volume looks strong too

INJUSDT - Monthly chart telling everything!A nice bounce occurred as soon as it touched the legendary support — the primary trendline and the grey zone.
Just look at the price behavior every time it approaches this rectangle.
You'll notice that, based on the Elliott Wave Impulse, Wave 4 has likely completed, and we’re now entering the final impulsive leg — "Wave 5"
$100 is a very modest target in the long term.
Best regards Ceciliones 🎯

TradeCityPro | INJUSDT Ready for a Big Move?👋 Welcome to TradeCityPro Channel!
Let’s dive in and analyze one of the popular crypto projects, INJ, which has a high likelihood of movement, and check our entry triggers together.
🌐 Overview Bitcoin
Before starting the analysis, I want to remind you again that we moved the Bitcoin analysis section from the analysis section to a separate analysis at your request, so that we can discuss the status of Bitcoin in more detail every day and analyze its charts and dominances together.
This is the general analysis of Bitcoin dominance, which we promised you in the analysis to analyze separately and analyze it for you in longer time frames.
📊 Weekly Time Frame
On the weekly time frame, I see that the seventh period is stable, INJ, and compared to the majority of altcoins that have their own low price levels, it is in a better space and is engaged in its own supports!
After breaking the primary trend ceiling, namely 9.28, we experienced a sharp upward movement and formed a historical ceiling at $53, and after forming a distribution box and breaking the important floor of 16.20 and pulling back to it, we experienced a continued decline.
We have now reached support again, which was previously a very important resistance, and now, as a result, it is probably not lost, but the weekly candle is a very good and bearish candle! Don’t forget to save your profit, your strategy booklet, and your positions, otherwise, you will have made a 450% move without adding anything to your capital!
📉 Daily Time Frame
On the daily time frame, our trend is completely bearish as you can see, and the events are completely accompanied by the formation of a downward bottom and top, but we are likely to suffer for a while.
After getting rejected from 34.16 and forming a box between 20.16 and 25.93 and losing the bottom, it made a move and then while pulling back with low volume and the next conversion to red, it became an inverted Sharpe, we experienced a decline!
After breaking the daily trendline, which was also an important trendline, its trigger at 8.48 was broken, and we are currently engaged with the resistance at 10.47, and the next and most important trigger, so to speak, is after breaking 10.47, and you can even have a spot buy with this level!
🕓 4-Hour Timeframe
In the 4-hour time frame, we are also ranging between the box of 9.24 to 10.41, and practically, whichever side we break, we can say we can take its position and go along with it!
📈 For a long position, the trigger is completely clear, and after breaking 10.41, make sure to take a long position, and you can even open a position before this trigger breaks with the presence of momentum in lower time frames!
📉 For a short position, we have just formed the support at 9.24, and if we bounce from this support and hit a lower high, or better yet, get rejected before 10.41, we go for a short position and a break of 9.24!
✍️ Final Thoughts
Stay level headed, trade with precision, and let’s capitalize on the market’s top opportunities!
This is our analysis, not financial advice always do your own research.
What do you think? Share your ideas below and pass this along to friends! ❤️

INJUSDT 1D AnalysisINJ ~ 1D Analysis
#INJ Buy after successfully penetrating this resistant line with a short -term target of at least 10%+.

#INJ/USDT#INJ
The price is moving within a descending channel on the 1-hour frame, adhering well to it, and is heading for a strong breakout and retest.
We are experiencing a rebound from the lower boundary of the descending channel, which is support at 7.50.
We are experiencing a downtrend on the RSI indicator that is about to break and retest, supporting the upward trend.
We are looking for stability above the 100 Moving Average.
Entry price: 7.71
First target: 7.92
Second target: 8.42
Third target: 8.90

#INJ/USDT#INJ
The price is moving within a descending channel on the 1-hour frame, adhering well to it, and is heading for a strong breakout and retest.
We are seeing a bounce from the lower boundary of the descending channel, which is support at 8.25.
We have a downtrend on the RSI indicator that is about to be broken and retested, which supports the upward trend.
We are looking for stability above the 100 Moving Average.
Entry price: 8.58
First target: 8.80
Second target: 9.03
Third target: 9.31

inj breaks long consolidation 30$ coming injective one the solid utilty token recently breaks long descending channel consolidation in result expecting strong recovery in coming weeks expecting move towards 30$ in coming weeks

#INJ/USDT#INJ
The price is moving within a descending channel on the 1-hour frame, adhering well to it, and is heading towards a strong breakout and retest.
We are experiencing a rebound from the lower boundary of the descending channel, which is support at 7.20.
We are experiencing a downtrend on the RSI indicator, which is about to break and retest, supporting the upward trend.
We are heading for stability above the 100 Moving Average.
Entry price: 7.20
First target: 7.70
Second target: 8.15
Third target: 8.64

TradeCityPro | INJUSDT Best Trade Setup of the Week?👋 Welcome to TradeCityPro Channel!
Let's analyze and review one of the most popular cryptocurrency coins, which is in a more favorable situation than the majority of altcoins together!
🌐 Overview Bitcoin
Before starting the analysis, I want to remind you again that we moved the Bitcoin analysis section from the analysis section to a separate analysis at your request, so that we can discuss the status of Bitcoin in more detail every day and analyze its charts and dominances together.
This is the general analysis of Bitcoin dominance, which we promised you in the analysis to analyze separately and analyze it for you in longer time frames.
📊 Weekly Time Frame
On the weekly time frame, I see that the seventh period is stable, inj, and compared to the majority of altcoins that have their own low price levels, it is in a better space and is engaged in its own supports!
After breaking the primary trend ceiling, namely 9.28, we experienced a sharp upward movement and formed a historical ceiling at $53, and after forming a distribution box and breaking the important floor of 16.20 and pulling back to it, we experienced a continued decline.
We have now reached support again, which was previously a very important resistance, and now, as a result, it is probably not lost, but the weekly candle is a very good and bearish candle! Don't forget to save your profit, your strategy booklet and your positions, otherwise you will have made a 450% move without adding anything to your capital!
📉 Daily Time Frame
On the daily time frame, our trend is completely bearish as you can see and the events are completely accompanied by the formation of a downward bottom and top, but we are likely to suffer for a while.
After getting rejected from 34.16 and forming a box between 20.16 and 25.93 and losing the bottom, it made a move and then while pulling back with low volume and the next conversion to red, it became an inverted Sharpe, we experienced a decline!
Currently, we are forming a box between 8.63 and 10.68, and for selling and short positions, you can do this by breaking 8.63, and for the trigger spot risk and buying, if you feel the price is good, it is better to wait for the trend to break and do the trigger at 10.68. Let it structure.
✍️ Final Thoughts
Stay level headed, trade with precision, and let’s capitalize on the market’s top opportunities!
This is our analysis, not financial advice always do your own research.
What do you think? Share your ideas below and pass this along to friends! ❤️

INJ | ALTCOINS | Bottom Likely CLOSEIn the previous cycle, INJ made a near full retracement after the bullish cycle.
This would put us round here, to which we are already fairly close:
To make it a little easier to reference, I'll use the Elliot wave tool (although these are not Elliot waves).
In short, the bottom is likely very close for INJ - but accumulation / sideways phase may take another while.
_______________________
BINANCE:INJUSDT

Trading opportunity for INJUSDTBased on technical factors there is a Buy position in :
📊 INJUSDT
🔵 Buy Now
🪫Stop loss 8.75
🔋Target 12.50
📏 R/R 2,5
💸RISK : 1%
We hope it is profitable for you ❤️
Please support our activity with your likes👍 and comments📝
