Why Institutions Trap Retail TraderThis video explains why institutions trap retail traders for liquidity by analyzing common price behavior around key levels. The discussion focuses on how liquidity builds near obvious highs and lows, why false breakouts and sudden reversals occur, and how institutional participation can create traps through market structure and order flow behavior.
The objective of this video is to build awareness around liquidity-driven moves and help understand market mechanics from an educational perspective, without offering any trading or investment recommendations.
Institutional_trading

Nasdaq MomentumFollowing the Federal Reserve’s rate cut decision, the ''RSI'' on the 4-hour chart is near the oversold zone. Price action has respected the key support area, as evidenced by multiple long lower wicks, indicating strong buying interest at these levels. Additionally, the ''Institution Radar'' indicator suggests that volume is well synchronized with price movement, implying transparent market participation and confirming the bullish momentum. Overall, these factors collectively support the likelihood of a near-term upward price continuation.

Eureka Forbes LimitedStock has broken out and is ready for the targets mentioned in drawing as TI and T2
Pattern Identified : Symmetrical Triangle breakout on the higher side
CPR Verification : Stock above monthly CPR and R1

Fertilizers & Chemicals Travancore LtdStock Price is well inside Accumulation Zone and also RSI Divergence can be seen on the daily time frame, Stock has very good fundamentals, Price may reverse from here to hit the Targets as shown in the diagram.
Fundamentals Snap Shot :-
Short Overall View on These Metrics
Sales / Revenue growth:
Long-term revenues have grown strongly from ~₹2,000 cr to a 6,000+ cr peak,
But last two years show clear decline, and 3-year sales CAGR is now negative.
OPM %:
Peaked around 13–17% (FY20–22); now down to 2–4%.
Indicates margin pressure (costs, pricing, or mix issues).
EPS:
Boosted historically by large “Other Income”;
Recent EPS is weak and volatile, far below earlier peaks.
Cash reserves:
Big positive: cash & bank balances of nearly ₹2,800 cr, growing every year;
With borrowings ~₹1,800 cr, FACT now appears net-cash positive.

Wonder Electricals Ltd Trade PlanStock has broken out and is ready for the targets mentioned in drawing as TI and T2
Pattern Observed : Symmetrical Triangle Breakout
Averaging area is also marked

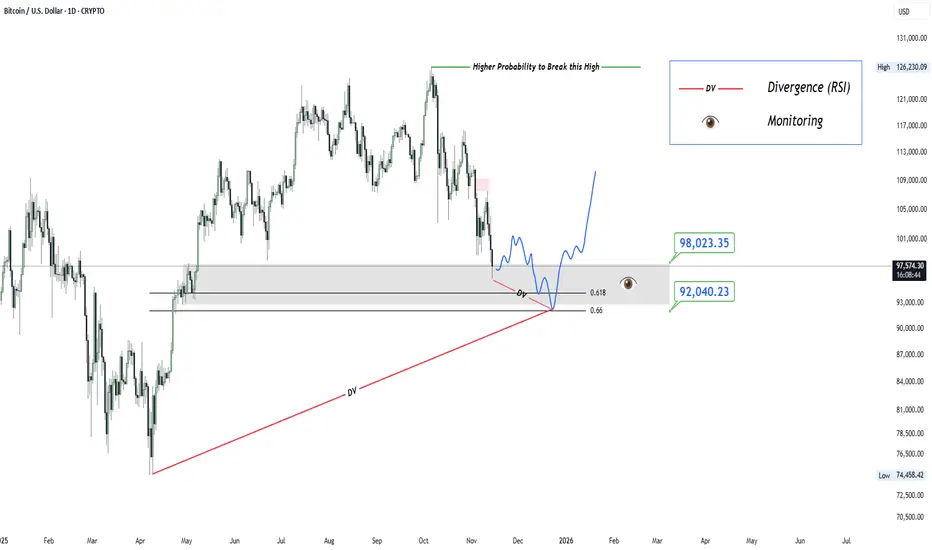
#BTC Higher Time Frame Idea (Extended Cycle Plan)This is my personal idea for #BTC
I am closely monitoring the key levels for a swing trade,
and also we can take a another spot entry from the given levels.
I am completely bullish on the big plan because rate cuts and liquidity stress in the U.S. banking system will fuel this bottom.
Long term Targets are above $ 220K,
Mid term impulse targets are between 135K ~ 165K
#Happy_Trading
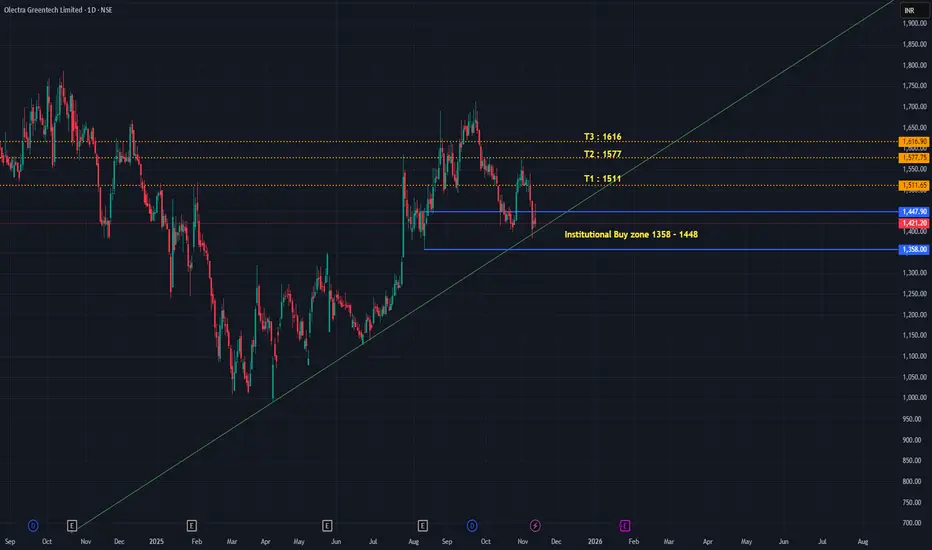
OLECTRA Trade PlanStock Price is well inside Accumulation Zone and also taking support from the Trend Line, Stock has very good fundamentals, Price may reverse from here to hit the Targets as shown in the diagram
Fundamentals Snap Shot :-
Very Short Overall Take (On Just These Metrics)
Sales/Revenue growth: ⭐⭐⭐⭐⭐ – Very strong 5-year ramp, big FY25 jump.
OPM%: ⭐⭐⭐⭐☆ – Stable ~15%, good for a tender-driven manufacturing business.
EPS growth: ⭐⭐⭐⭐⭐ – EPS has multiplied sharply with improving scale.
Cash reserves: ⭐⭐⭐☆ – Adequate but not “cash-rich”; significant money stuck in receivables & inventory.
Voltamp Transformers LtdStock has broken out and is ready for the targets mentioned in drawing as TI and T2

USDJPY | Institutional Sells from HTF Supply Zone (Instant ExecuUSDJPY has tapped into a higher-timeframe supply zone that aligns with the weekly sweep and 4H CHoCH, confirming potential downside momentum.
After the recent BOS, price retraced back into the previous structural supply, forming an S&S pattern (sweep and shift) within the same zone.
The setup aligns with bearish intent from institutional order flow, suggesting smart-money distribution before the next leg down.
🔹 Execution: Instant market sell from 154.15–154.20
🔹 Stop-Loss: Above 154.55 (protected high)
🔹 Target: 152.80 (Realistic TP area)
🔹 Bias: Bearish continuation into lower liquidity zones
Technical Confluence:
• W1 sweep confirms distribution phase
• 4H CHoCH + BOS = structural shift bearish
• S&S rejection inside refined M30 supply
• Liquidity resting below recent lows (152.80)
This setup respects SMC principles — liquidity sweep → structural shift → premium entry — under institutional context.
💬 Monitor for a clean M15–M5 confirmation candle close to maintain precision entry and manage partials along the way.

TATA Steel LimitedPrice has Bounced from Order Block, hence will go and hit target marked as T1 and T2

Nifty Reversal Zones for 29 OCT 2025Nifty reversal zones for intraday, usually these area/zone act as supply or demand areas, Price tend to take support or rejections from these area's also these areas are good only for 29 OCT 2025, There are 2 Zone types Major and Minor, Major to target big trends and minor to target small trends and can be used for scalping

Deep Industries Trade PlanPrice is about to hit institutional zone, once price reaches this zone accumulation will start, which will in-turn Propel the price upwards once again to test the previous highs

GoldGold 🥇 | Comprehensive Technical Analysis - Setting a Significant Rejection Zone
Current Price: Around $4,353 | Timeframe: Daily - Weekly
Date: October 21, 2025
══════
📊 Overview On the Market:
Gold has completed an exceptional bullish cycle, reaching new all-time highs above 4,400, which I believe represents the local high for the current phase.
However, several technical factors now point to an imminent correction before any potential continuation.
══════
🔍 Key Technical Notes:
▪️ Price Zone:
The stock is currently trading in a bullish zone—an area where institutional investors historically tend to take profits and open short positions.
▪️ Market Sentiment:
Fear and Greed Index: 78/100 (Extreme Greed)
These extreme readings in bullish zones precede corrections in 85% of historical cases.
▪️ Structural Analysis:
- Overall Structure: Bullish (higher timeframes)
- Internal Structure: Showing signs of weakness and bearish divergence
- A potential Change in Personality (CHoCH) is forming on medium timeframes
▪️ Supply and Demand Zones:
Multiple untested resistance zones below, as well as unfilled fair value gaps that act as price magnets.
▪️ Multiple Timeframe Analysis:
Price is analyzed across multiple timeframes (4-hour, 1-day, 1-week, etc.) using advanced order flow techniques and proprietary market structure mapping tools—all of which point to a potential upcoming correction.
══════
🎯 Expected Scenario (High Probability):
Stage 1 - Initial Correction:
📍 Target 1: $3,777-$3,816
(Balance Zone)
📍 Target 2: $3,688-$3,749
(Discount Zone - Optimal Entry)
Stage 2 - Deeper Correction (Moderate Probability):
📍 Target 3: $3,465-$3,580
(Strong Institutional Demand - Buy Orders)
In addition to unfilled fair value gaps that act as price magnets.
Note: Additional Confirmation Required
After Reaching the Discount Zones:
The possibility of a continued uptrend exists, but is not currently highly likely. The situation will be reassessed upon reaching the demand zones.
══════
⚡ Why this analysis?
This analysis is based on:
✓ Advanced order flow analysis techniques
✓ Professional tools for mapping market structure
✓ Premium/Discount Zone Theory
✓ Detecting institutional order blocks
✓ Market sentiment analysis
✓ Liquidity level mapping
These are not traditional retail trading tools; they are institutional analysis techniques used by professional traders.
═════
📚 Previous Record:
Some may remember my previous analysis of gold in August 2023:
📌 Analysis for August 13 2023:
- Expectations: Rise from 1780
- Targets: 2500 → 2800 → Over 3800
- Result: ✅ 100% Success Rate
- Actual Movement: Reaching over 4400 (147% Profit)
- Update (April 2024): "Trade Closed at Target"
This analysis is based on the same institutional framework applied to this current situation. The methodology is effective because it tracks actual cash flow—not trader sentiment.
═════ ═════
⚠️ Risk Management (Mandatory):
Regardless of your confidence level, risk management is non-negotiable:
✓ Don't risk more than 1-2% of your capital on each trade.
✓ Always set a stop-loss before entering.
✓ Avoid excessive leverage.
✓ Maximize your profits. Steps
✓ Research yourself (DYOR)
══════════════════════════════════════ ═════
⚖️ Disclaimer:
This is educational technical analysis and does not constitute financial advice or an investment recommendation.
Trading carries a significant risk of capital loss.
Past performance does not guarantee future results.
Trade at your own risk.
Consult a licensed financial advisor before making any investment decisions.
══════
💬 Share your opinion with us:
What do you think of gold at these levels?
📊 If you found this analysis helpful, don't forget to like and follow it for more analysis.
🔔 Turn on notifications to receive updates as soon as this setting develops.
═════

QE and YCC: What does it all mean?ECONOMICS:USCBBS
CBOT:ZB1! CBOT:ZN1! CME_MINI:NQ1!
There is growing market speculation that the Fed may tolerate inflation above 2% for longer, consistent with its Average Inflation Targeting (AIT) framework introduced in 2020.
This also implies that real rates i.e., nominal rates minus inflation are likely to fall significantly. Given this, we anticipate gold to continue trending higher as the U.S. dollar's purchasing power erodes with mounting debt, persistently higher inflation, and falling real yields.
What is QE?
Quantitative Easing (QE) refers to the Fed injecting liquidity into financial markets by purchasing large quantities of assets such as Mortgage-Backed Securities (MBS) and U.S. Treasuries, especially during periods of economic stress like the Global Financial Crisis (2007–2008) and the COVID-19 downturn.
How Does QE Work?
Asset Purchases: The Fed buys large volumes of Treasuries and MBS from financial institutions.
Balance Sheet Expansion: These purchases expand the Fed's balance sheet (now hovering near $6.6 trillion, per FRED).
Increased Liquidity: Banks receive excess reserves in exchange, increasing system-wide liquidity.
Lower Interest Rates: Demand for bonds pushes prices higher and yields lower.
Economic Stimulus: Lower borrowing costs promote credit creation, investment, and consumer spending.
However, a key drawback of QE is asset price inflation. As seen between the GFC and the COVID-19 pandemic, low rates and excess liquidity drove significant appreciation in equities, housing, and other financial assets, even while consumer inflation remained near target.
QE vs. Stimulus Checks
If traditional interest rate policy is Monetary Policy 1 (MP1), then QE is MP2. Stimulus checks, or government handouts, fall under MP, a fusion of monetary and fiscal policy.
While QE primarily injects liquidity into financial institutions, stimulus checks inject purchasing power directly into households. This approach where the Treasury issues debt and the Fed purchases that debt, stimulates demand for real goods and services. We saw this during the post-COVID recovery, which brought a sharp rebound in consumer activity but also a surge in inflation, reaching a peak of 9.1% in June 2022 (CPI YoY).
QE impacts Asset Price Inflation
Stimulus Checks impact Goods & Services Inflation
What is YCC? (Yield Curve Control)
Yield Curve Control (YCC) is a policy whereby the central bank buys government debt across various maturities to control yields not just at the short end (via rates), but across the entire yield curve.
A prime example is the Bank of Japan, which has used YCC since 2016 to anchor 10-year JGB yields near zero. The Fed has not formally adopted YCC, but market participants believe it may lean in that direction in the future especially during crises where long-end rates rise undesirably. Mounting US debt and rising long end yields may prompt the Fed to step in and adopt YCC like BoJ has done previously.
Front-End Control: Managed via policy rates
Long-End Control: Central bank buys 5Y, 10Y, 20Y, 30Y Treasuries to anchor yields
Potential Risks of YCC:
Credibility Risk: If inflation rises while the central bank suppresses yields, it may lose market trust.
Currency Pressure: Artificially low yields may trigger speculative pressure on the currency (as seen with the yen under BoJ YCC).
We’ve kept this concise and digestible for now, but there’s more to unpack—especially on the long-term implications of coordinated monetary-fiscal policy (MP3), debt sustainability, and central bank credibility.
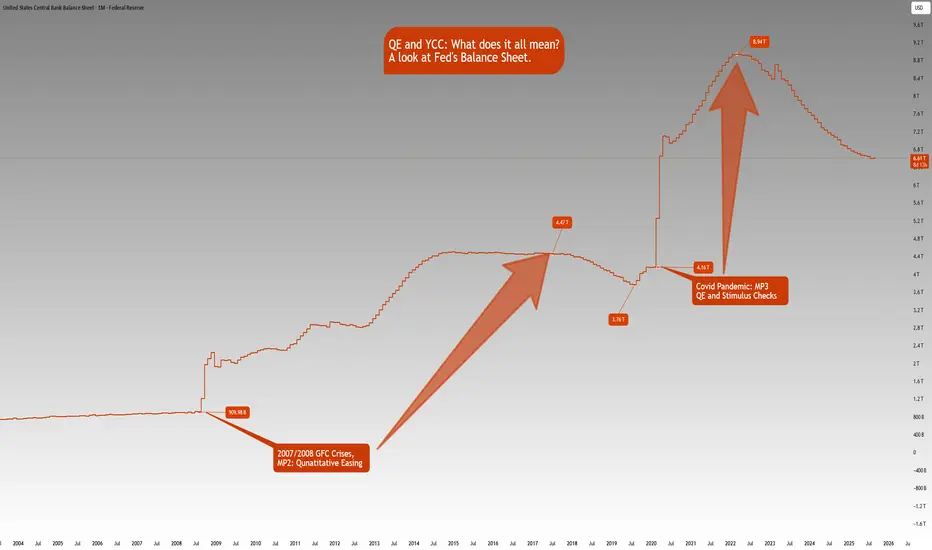
The Fed’s balance sheet chart shows how Fed’s balance sheet has increased:
Aug 1, 2008: $909.98B
Jul 1, 2017: $4.47T
Aug 1, 2019: $3.76T
Feb 1, 2020: $4.16T
Mar 1, 2022: $8.94T
Aug 1, 2025: $6.61T
Note that this is not just a US phenomenon. It is a world wide phenomena looking at many of the developed and emerging markets. The Debt to GDP ratios are increasing, Central Banks balance sheets are rising in tandem with rising government debt.
With the rate cutting cycle starting, it is a matter of time that we also see QE restarting.
If you’d like us to dive deeper into any of these topics in future educational blogs, let us know. We're happy to build on this foundation with more insights.
MSTR 1D Time frameMarket Snapshot
Current Price: ~$328.50
Daily Change: -0.4% (approx)
Technical Overview
Indicators & Momentum
RSI (14-day): ~40 → Neutral, slightly below the midpoint—no major squeeze yet.
MACD: Negative (~–1.6) → Weak bearish momentum.
Stochastic Oscillator: Around 31 → Neutral to slightly oversold.
Stochastic RSI: Overbought zone → Possible short-term exhaustion.
Williams %R: ~–39 → Suggests room for both upside and downside.
ADX: ~18–26 → Indicates a weak to moderate trend—market lacks strong direction.
Moving Averages
Short-term moving averages (like 5-day and 10-day) show buy signals, while broader averages—including the 20-day, 50-day, 100-day, and 200-day—are all negative, suggesting broader downward pressure.
Support & Resistance
Based on various pivot point analyses:
Immediate Support: ~$324–325
Near-term Support Zone: ~$320
Immediate Resistance: ~$332–334
Further Resistance: ~$340–345
Broader Technical & Market Context
Downtrend in Play: The stock has declined nearly 40% from its July highs and is approaching its lowest levels since April.
Death Cross Forming: The 50-day moving average is nearing a bearish crossover below the 200-day average.
Diving Technical Ratings: Most moving averages and oscillators point to a negative bias—short-term signals are weak, and longs are retreating.
Bullish Divergence? Some chart setups hint at a potential wedge or triangle pattern with possible bullish divergence, but these are speculative and not yet confirmed.
MicroStrategy remains under pressure, with indicators pointing overwhelmingly to neutral or bearish signals. While short-term moving averages show minor support, the broader technical picture remains weak—and a breakout above ~$334 would be needed to suggest a reversal.

MSFT 1D Time frameMarket Snapshot
Current Price: ~$498.41
Daily Change: +0.23 (≈0.05%)
Market Cap: ~$2.79 Trillion
P/E Ratio: ~28.9
EPS: ~12.93
🔎 Technical Indicators
RSI (14-day): ~41 → Neutral, leaning slightly bearish.
MACD: –2.7 → Negative but giving a weak buy crossover signal.
Williams %R (14-day): ~–74 → Suggests a possible rebound (buy).
CCI (14-day): ~–108 → Oversold zone, buy indication.
ADX (14-day): ~20.6 → Weak trend strength.
ROC (Rate of Change): –3.5 → Mild bearish momentum.
📈 Moving Averages
5-day MA: Below current price → Bearish short-term.
20-day MA: Below current price → Bearish.
50-day MA: ~$509, above price → Acting as resistance.
100-day MA: ~$476, below price → Supportive.
200-day MA: ~$443, below price → Long-term uptrend still intact.
🔧 Support & Resistance
Support Zone: ~$491 – $497
Resistance Zone: ~$500 – $510
📅 Outlook
Bullish Case: If MSFT climbs above $509–510, momentum could extend toward new highs.
Bearish Case: A break below $491 may lead to a pullback toward $480–485.
Overall Bias: Neutral to slightly bearish in the short term, but long-term bullish trend remains intact above the 200-day MA.

NVDA 2HourTime frameNVDA 2-Hour Snapshot
Current Price: $170.76 USD
Previous Close: $168.31 USD
Day Range: $166.74 – $170.97 USD
52-Week Range: $139.34 – $200.00 USD
Volume: 170,370,750
VWAP: $169.67 USD
Market Cap: $1.1 Trillion
🔎 Technical Indicators
Relative Strength Index (RSI): 39.44 — Neutral
Moving Averages:
5-period: $169.68 — Sell
10-period: $174.59 — Sell
20-period: $177.06 — Sell
50-period: $172.58 — Sell
100-period: $150.61 — Buy
200-period: $139.34 — Buy
Moving Average Convergence Divergence (MACD): -0.91 — Buy
Stochastic Oscillator: 20.33 — Neutral
Commodity Channel Index (CCI): -119.52 — Buy
Average True Range (ATR): 4.93
📈 Market Sentiment
Pivot Points:
Resistance: $175.00 USD
Support: $165.00 USD
📅 Outlook
Bullish Scenario: A breakout above $175.00 USD could signal a move toward $185.00 USD.
Bearish Scenario: A drop below $165.00 USD may lead to further downside.
Overall Bias: Neutral, with mixed signals from moving averages and momentum indicators.

USDJPY 2Hour Time frameUSD/JPY 2-Hour Snapshot
Current Price: 147.46 JPY
Change: +0.05% from the previous close
Market Cap: Not applicable
P/E Ratio: Not applicable
EPS: Not applicable
Intraday High: 147.59 JPY
Intraday Low: 147.27 JPY
🔎 Technical Indicators
RSI (14): Neutral
MACD: Neutral
Moving Averages:
5-period SMA: Not available
10-period SMA: Not available
20-period SMA: Not available
50-period SMA: Not available
📈 Market Sentiment
Pivot Points:
R1: Not available
R2: Not available
R3: Not available
S1: Not available
S2: Not available
S3: Not available
📅 Outlook
Bullish Scenario: A breakout above the current price could lead to further gains.
Bearish Scenario: A drop below the current price may test support levels.
Overall Bias: Neutral, with mixed signals from moving averages and momentum indicators.

USDJPY – Liquidity Sweep & CHoCH → Short SetupUSDJPY shows a clean liquidity play under MY Liquidity MM Trading System:
Price swept liquidity above Friday’s High, triggering buy-side stops.
CHoCH confirmed a bearish shift in orderflow.
Retest into the Supply Zone (OB + Highest Volume Area) offers a short entry.
Targeting liquidity resting at Previous Day’s Low (PDL).
Execution Plan:
Entry: Supply zone retest
Stop: Above Friday’s High for
R:R: 1:2
For tighter stops: Refine entry at top of OB wick + add buffer of 2–3 pips
TP: PDL liquidity pool
R:R ≈ 1:4

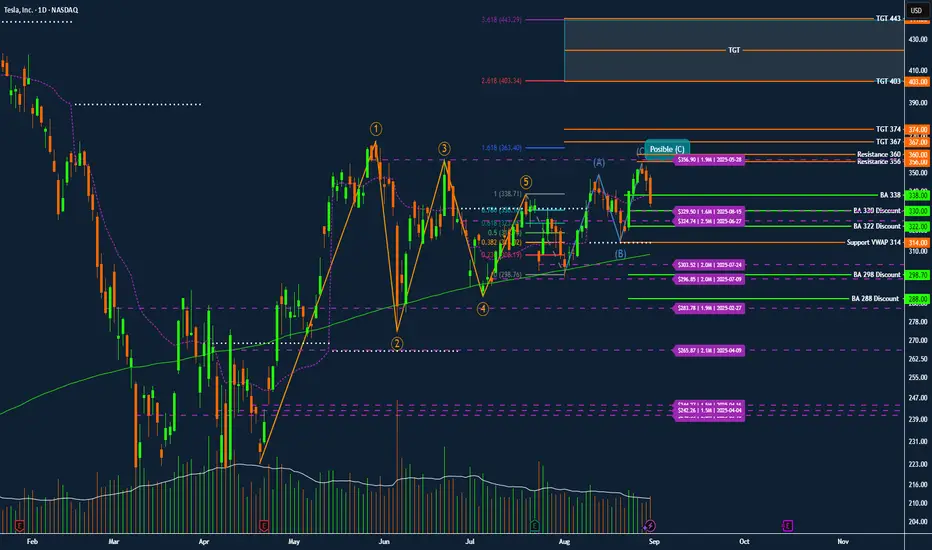
TSLA TESLA Institutional Roadmap for September Discount ZoneTesla NASDAQ:TSLA – Institutional Roadmap for September: Discount Zones, Breakout Triggers, and Squeeze Targets
Tesla continues to trade as one of the clearest institutional battlegrounds in the market. The footprints in option open interest, dark pool levels, and anchored VWAP create a very precise map for swing traders who want to follow the flow rather than fight it.
Elliott Wave Context
Tesla completed a clean 1–5 impulse wave earlier in the year. The stock has since been retracing in an A–B–C corrective structure, with wave (C) still tentative. The rejection near 348–350 matches heavy open interest and serves as a possible end of (C). However, the high-volume sell candle at 333 suggests the correction may continue lower into discount zones before the next advance.
Institutional Discount Zones
330–332: first defense level, with recent dark pool support
322: deeper discount aligned with the 0.618 retracement
314: anchored VWAP level, a frequent institutional reload zone
298–300: July dark pool activity and strong confluence support
288: extreme discount zone from February
Breakout Triggers
BA 338: first bullish-above confirmation trigger, but only valid if defended by volume
356–360: the real battleground. Massive call open interest is stacked here. A clean break above confirms institutional participation
Upside Targets
367–374: first expansion target and resistance magnet
403: Fibonacci 2.618 extension
443: Fibonacci 3.618 extension
467: Fibonacci 4.236 extreme target if momentum continues
Flow and Volume Notes
Options flow shows concentrated put open interest between 300–320, confirming institutional defense of that floor. Call interest is stacked heavily at 350–360, which explains the recent rejection zone. The latest sell-off candle came with above-average volume, reinforcing the probability of a deeper retest into 330–322 or even 314 VWAP.
Trading Roadmap
If Tesla holds 330–332, expect a potential reversal with BA 338 as confirmation.
If 330 breaks, expect a move into 322 or 314, and a flush to 298 remains possible.
If 356–360 is reclaimed with volume, the squeeze path opens toward 367–374.
Breaking above 374 accelerates directly into 403 and later 443.
Conclusion
Tesla remains a classic institutional shakeout pattern rather than a breakdown. The map is clear: watch the discount zones for accumulation, use BA 338 and the 356–360 battleground as confirmation triggers, and follow the roadmap toward 374, 403, and 443 once the breakout validates. Patience is edge. Institutions will reload near VWAP and dark pool levels, while retail chases 350. Follow the Darkpools not the noise.
USDJPY: Bearish Momentum Builds After H4 Structure Shift!Greetings Traders,
In today’s analysis of USDJPY, we observe that the prevailing institutional order flow remains bearish, positioning us to focus on high-probability selling opportunities aligned with downside liquidity objectives.
Key Observations on H4:
Weekly Bearish Order Block Reaction: Price recently reacted to a weekly bearish order block, causing an H4 market structure shift (MSS) to the downside. This confirms that the H4 order flow is now in alignment with the higher timeframe bearish bias, with the weekly order block acting as a strong institutional resistance zone.
Liquidity Dynamics: Recent price action saw sell-side liquidity swept (external range liquidity), followed by a pullback into an H4 fair value gap (FVG), representing internal range liquidity. This reinforces the expectation that the H4 FVG may hold as a firm resistance zone.
Trading Plan:
Entry Strategy: Seek confirmation-based entries on the lower timeframes (M15 and below) within the H4 FVG to refine risk and validate the bearish continuation.
Target Objective: Focus on discount-side liquidity pools, consistent with institutional objectives to rebalance price and capture liquidity resting below.
The main liquidity draw is towards the weekly liquidity pool- which is our long term draw on liquidity.
Remain patient, allow the market to confirm your bias, and execute with disciplined risk management.
Kind regards,
The Architect 🏛️📉

EURGBP: Bullish Continuation Setup from H4 Fair Value GapGreetings Traders,
In today’s analysis of EURGBP, we observe that the prevailing institutional order flow has shifted firmly bullish on the H4 timeframe. This directional bias positions us to focus on high-probability buying opportunities aligned with upside liquidity objectives.
Key Observations on H4:
Weekly FVG Rebalancing: Price recently rebalanced a weekly fair value gap (FVG), which acted as a higher timeframe inefficiency. Following this, we saw a market structure shift (MSS) on H4, confirming the transition from bearish to bullish order flow.
Liquidity Dynamics: After external range liquidity (buy stops) was taken, price began gravitating towards internal range liquidity (FVGs), reflecting the market’s natural movement from external to internal liquidity and vice versa.
H4 FVG Support: Price is currently trading within an H4 FVG, which we anticipate will act as a firm institutional support zone, offering a favorable area to seek long setups.
Trading Plan:
Entry Strategy: Look for confirmation-based entries on lower timeframes (M15 and below) within the H4 FVG to refine risk and validate bullish continuation.
Target Objective: Aim for upside liquidity pools, in alignment with institutional objectives to draw price higher and capture resting buy-side liquidity.
Remain patient, let the market confirm your bias, and execute with disciplined risk management.
Kind regards,
The Architect 🏛️📈

August 24, Forex Outlook: What Can Traders Expect This Week?Welcome back, traders!
In today’s video, we’ll be conducting a Forex Weekly Outlook, analyzing multiple currency pairs from a top-down perspective—starting from the higher timeframes and working our way down to the lower timeframes.
Pairs to focus on this Week:
USDJPY
USDCAD
EURGBP
EURJPY
GBPCHF
NZDCHF
USDCHF
Our focus will be on identifying high-probability price action scenarios using clear market structure, institutional order flow, and key confirmation levels. This detailed breakdown is designed to give you a strategic edge and help you navigate this week’s trading opportunities with confidence.
📊 What to Expect in This Video:
1. Higher timeframe trend analysis
2. Key zones of interest and potential setups
3. High-precision confirmations on lower timeframes
4. Institutional insight into where price is likely to go next
Stay tuned, take notes, and be sure to like, comment, and subscribe so you don’t miss future trading insights!
Have a great week ahead, God bless you!
The Architect 🏛️📉
