EU will be bullish for a weekClearly looking at EURUSD on the Daily timeframe you'll see that it's about filling an imbalance, and secondly it will be filling it in the Daily timeframe so it's gon' take enough time, and if you go down to the H4 timeframe you'll see a mitigation block and also price has retested the mitigation key level, and it formed Drop,Base,Rally (DBR) so next week EURUSD will be so so bullish so ride along with me.
Institutional_trading


US30 Sell acumulatión setupSupply zone - Acumulation in supply zone HPT. We need confirmations in a low timeframe (15m) pinbar. Keep simple


GBPJPY GJ is in downtrend on daily and 4hr but weekly is bullish so it can move down and go higher or it can take pullback to upside and move down to weekly level ( Nice trade setup )

Wyckoff Distribution Trade SetupSo OANDA:AUDUSD has been forming a textbook Wyckoff distribution pattern and is hanging by a thread atm. We are currently entering phase E which according to the Wyckoff distribution schematic is a markdown phase. You can clearly see the price manipulate the highs and break down out of the structure. If you still haven't shorted yet you might want to wait for the falling wedge to break or wait for some type of institutional candle of some sort. Targets would be according to my fib levels around the .382 and the .618 retrace. Follow for more trade setups! Good Luck traders!
NOT FINANCIAL ADVICE!

AUDCHF at Weekly OB, Hunting Longs nowExpecting price to return to the 0.69250 level as it just mitigated a bullish weekly OB, also price just did an expansion to the downside after a short consolidation on the H4, seller liquidity has been tapped, we should head higher now

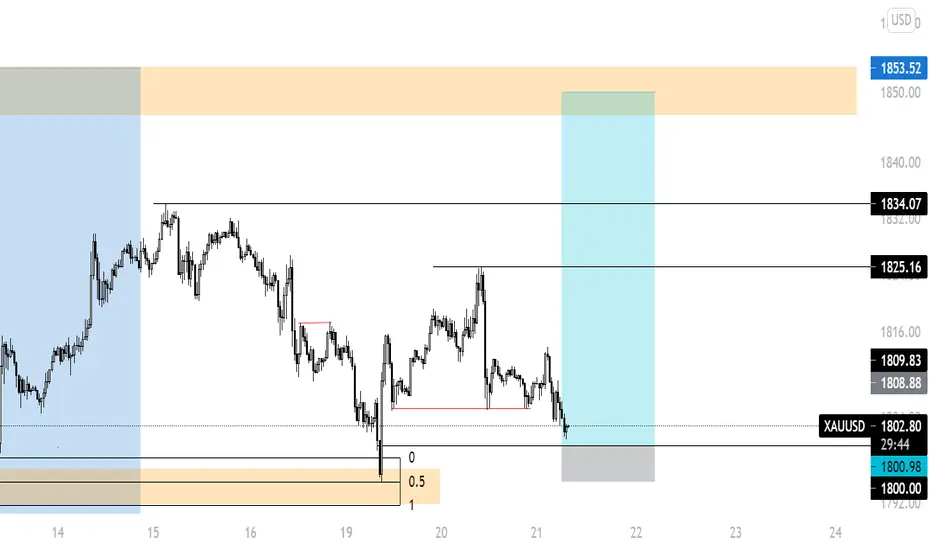
BULLISH OR BEARISH?Sellers are losing strength and the highs above have lots of liquidity, im expecting a reversal pretty soon. Like and comment if you agree!

XAUUSD SMC short Going short on XAUUSD if it gives me confirmation on smaller timer frame inside 1H orderblock, expecting it to go and clear that big liquidity under all that lows, we must w8 for confiramation snc there is liquidity and imbalance above our trade
do not trade this if u dont know what SMC is, if u have any question feel free to comment :)

USD/JPYThe price is in a demand zone and hes react, the macro direction is bullish, the take profit is in a supply zone


US30 WEEKLY FORECAST 07/04/2021Well, past week was a movie in the markets. There were great movements on about all instruments, i mean after all that's what NFP brings to the table right. As nas100 and spx500 have been chilling at their all time highs, us30 seems to be the only lagger here. It is at a crucial area at the moment, extreme region of the 4H leg, this area is ultimately going to decide if bears still have it or the bulls have completely taken over. We see a beautiful reaction off of the 80% of the 2H extreme candle but the lower timeframe still remains bullish as bullish can get so the first sensible thing to do for me would be to look for longs inside the first level of demand on the 4H or the institutional candle to take us above past week highs causing a 4H break of structure to the upside, in which case i will be looking for signs of distribution on the lower time frames to eventually catch a buy from around the last point we see signs of re-accumulation.
THIS IS JUST MY ANALYSIS, IN NO WAY THIS IS FINANCIAL ADVICE! I AM NOT LIABLE FOR ANY OF YOUR ACTIONS IN THE MARKETS, TRADE RESPONSIBLY AND APPLY PROPER RISK MANAGEMENT. AFTER ALL THIS IS A MARATHON NOT A SPRINT!!!

Sniper entry of GUThese are the trades I'm currently in and are in profit. I trade institutionally so the first entry was based off an orderblock that was mitigated on by price, second and third entries were based on imbalances left of which market went and filled. Overall, today should be bullish.
First trade is 1:10 RR
Second is about a 1:9 RR
Third is also a 1:10 RR

Something I think Gold will do this weekWe are currently at an orderblock of which we are mitigating upon. Price might bounce off it to fill some imbalance left before dropping even lower and grabbing liquidity and going higher
NOTE: NOT ALL ANALYSIS WILL PLAYOUT. DO NOT QOUTE ME ON THIS

XAUUSD looking upside liquidity to go longXAUUSD looking for liquidity upside.
Above double TOP 1794 there is retail stoploss
expecting market run their buy stop then bring it downside as pullback of bullish orderflow so their stoploss get hunted
medium target liquidity at 1790 for today projection
Waiting pullback downside at Newyork Killzone to go LONG
we have trendline liquidity too below the asian low
DISCLAIMER!
!!! I AM NOT using any indicator or chart pattern/harmonic pattern, classic support resistance, supply demand analysis!!
The analysis given by Inner Circle Trader approach.
Hope you guys like and comment.
Regards


$BTC - Maybe not, But a Warning that Bitcoin could get to 20kWhat would I do if I were an algorithm trying t take other people's money. Well, considering most people in this chat are extremely bullish at this price, I hate to be the bearer of bad news, but all the open Fair Value Gaps got me wondering "how much longer until it hits that Fair Value Gape near $20k...... so #SMT - Smart Monet Theory would suggest BTC would get as low as 20k. I've been saying this for a while but it was finally time to out it on a chart to show people. I personally got out at 57k and I have made some trades, but I'm not HODLING any unless there's 3% or more Staking for BTC somewhere, I think a few might have or lending which is good if you are going to hold them. I'm now. Bitcoin is not like a stock, it's a currency like forex. Anyway, everything is written on the chart, I would personally try to short BTC from now of the 4 entries mentioned down to the 20k take most off, put your stop loss at a good level and let the other shorts go in case it does end up going shorter. But I think staying below 20K was way too long snd now it'll just touch it. Could possibly drive everyone nuts by being between 20 and 25 for bout 6-8 weeks, but then we know that gotta be accumulation, I'd start checking the open interest and the volume of the Bitcoin Futures to see when we could see movement. Bitcoin futures show they added longs last week and we didn't see it go that way. Maybe We could be reaching d) on this chart.
Well to everyone,
good luck and good trading.
BINANCEUS:BTCUSD
BITSTAMP:BTCUSD
btcusd
BITFINEX:BTCUSD
BITBAY:BTCUSD
OANDA:BTCUSD
PHEMEX:BTCUSD
GEMINI:BTCUSD
FTX:BTCUSD
BITTREX:BTCUSD
CURRENCYCOM:BTCUSD
FX:BTCUSD
CAPITALCOM:BTCUSD
OKCOIN:BTCUSD
KUCOIN:BTCUSDT POLONIEX:BTCUSDT
HUOBI:BTCUSDT

Bearish propability in the EUR/USDLot of liquidity in the down side of the market.short term sell opertunities in the market
