Tech Stocks look Bullish, Intel, AMDIntel with a bullish Fibonacci transition through the circle
AMD looking to push higher through the current fib ring aswell
I assume that other tech stocks like IBM and NVIDIA will follow.
Intel

RLC IEXEC - GOOGLE, INTEL, IBM CLOUD, UBISOFT 5000%++ GAINSRLC is running the bull run first in the crypto market.
RLC will be the main decentralized cloud computing provider for the BIG tech companies.
Why? RLC helps these major TECH companies earn more ROI for unused cloud storage.
GOOGLE CLOUD will be next in the line, alongside all other cloud companies that has not been announced.
IEXEC just announced that they have joined Confidential Computing Program and have been working on the project since the alpha release.
Huge things to come soon.
July - DEFI news
SEPTEMBER- MAJOR news for mainstream adoption!
RLC is following LINK bull run from NOV 2018.
1W CHART wise, SUPER bullish,
Fundamentals wise, ULTRA bullish.
i'm holding RLC for that 5000%+ gains!
*Not financial advise, this is all my opinion.


Nvidia opportunity brewing.We're getting close to the ultimate short. Expecting a blow of top soon as everything starts accelerating. This is just one example of a multitude of overvalued companies. Even though the fundamentals are there these valuations are not justified by any mean.


intel analysis in 15 min (BUY SIGNAL FOR SHORT TIME)the chart of intel my be change the way to the down way so be curful if you buy in this time

Intel fib transition - buy signalLooks great
transition between Fibonacci levels within the fib circle


INTC - INTEL main buying zonesHello traders,
Description of the analysis:
INTEL the best buying zones for investment.
About me:
Hi, my name is Jacob Kovarik and I´m trading on stock exchange since 2008. I started with a capital of 3000 USD. My first strategy was based on OTM options. (American stock index and their ETF ). I´ve learnt on my path that professional trading is based on two main fundaments which have to complement each other, to make a bussiness attitude profitable. I´ve tried a lot of techniques and many manners how to analyze the market. From basic technical analysis to fundamental analysis of single title. My analytics gradually changed into professional attitude. I work with logical advantages of stock exchange (return of value back to average, volume , expected volatility , advantage of high stop-loss, the breakdown of time in options, statistics and cosistent thorough control of risk). At the moment, my main target is ITM on SPM index. Biggest part of my current bussiness activity comes from e mini futures (NQ, ES). I´m trader of positions. I´m from Czech republic and I take care of a private fund (4 000 000 USD). During my career I´ve earned a lot of valuable experience, such as functionality of strategies and what is more important, control of emotions. Professional trading is, in my opinion, certain kind of mental training and if we are able to control our emotions, accomplishment will show up. I will share with you my analysis and trades on my profile. I wish to all of you successul trades.
Jacob

Bullish Cup & Handle formation on $AMDIt is very clear that AMD is going to be a few node sizes ahead of Intel for the next few years. On top of that, they will be dominating the console and commercial server market. AMD is highly undervalued here and wouldn't be surprised to see a full 100% extension of the cup by the end of this year.

"Intel: going towards ATH" by ThinkingAntsOk4H Chart Explanation:
- Price broke the Descending Trendline.
- Price is currently on a Bullish Corrective Structure.
- If it breaks, potential to move up towards the Resistance Zone.
Weekly Vision:
Daily Vision:
Updates coming soon!

Nividia Poised for ATH Test!Exhibiting signs of exhaustion, U.S. equities gave up nearly all their gains from the morning, closing today's session flat. The Dow Jones Industrial Average gained +0.56%, the S&P 500 +0.90% and the Nasdaq 100 led the way with +1.09%. Interestingly, a number of heavy hitters are roaming around resistance. One name of note is Apple which finally entered a region where I'd suspect sellers to begin coming in between 301-308. I'll touch upon Apple tomorrow morning. Today, we take a look at Nividia Corp. ahead of earnings May 21st.
All-Time High Bound?
With Nividia Corp. (NVDA) reporting their quarter one earnings on May 21st and yesterday's news that it acquired Cumulus Networks, a deeper look into the charts was deserved. Below is the 4-hour chart of NVDA.
NVDA has rallied 68% off the March lows and has been consolidating at its highs for just over two weeks, a bullish sign. Additionally, resistance at 300 has been tested a third time, as NVDA posts higher lows on declining volume, also bullish. Notice the ascending triangle taking shape. Although, known as a bullish continuation pattern, it is not confirmed until a breakout to the upside. With a breakout the projected target would would propel NVDA to all-time highs of 340 per share.
There is a lot of positive going for NVDA heading into earning's. That said, could NVDA be setting up as a sell the news candidate? The ascending triangle set up is poised to breakout prior too May 21st earnings. It is something to keep in mind if taking on the bullish trade. With fundamentals and technicals aligning heading into earnings, its hard not to be bullish NVDA. Bias: Bullish .
Flat Week Continues
Today was the second straight day U.S. indicies posted flat gains. It's really not a surprise. There is a log of uneasiness in the market and tomorrow may shed some light on that uneasiness. Tomorrow the ADP unemployment report is released and should offer some insight on Bureau of Labor Statistics unemployment rate announcement this Friday. Spoiler, the the report won't look great. Until then, have a great evening!

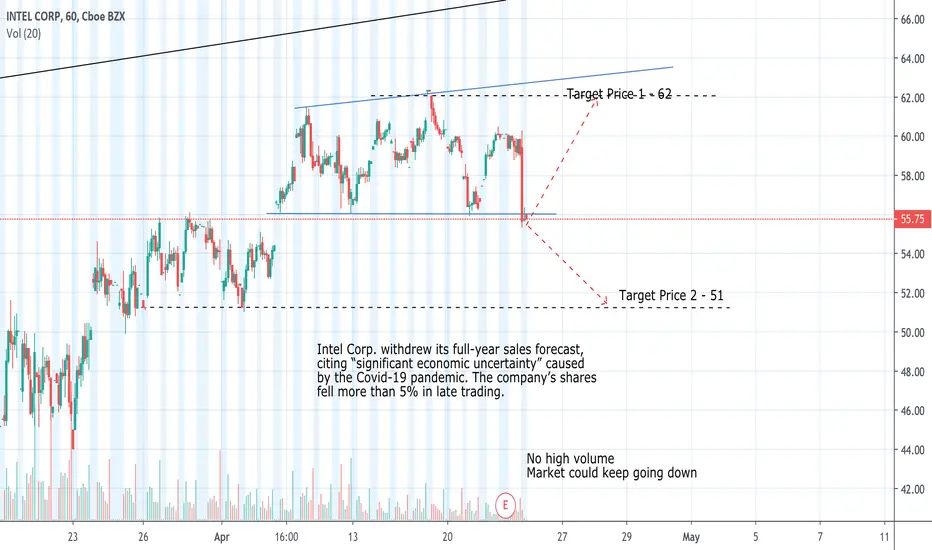
Updated on Intel Corp - Stand AsideMy previous information was that the financial outcome for this fist quarter was positive, but, it seems that Intel Corp. withdrew its full-year sales forecast, citing “significant economic uncertainty” caused by the Covid-19 pandemic. The company’s shares fell more than 5% in late trading.
Intel - Long term Bullish market as well as short termIntel Corp. is scheduled to release its first-quarter financial results after the markets close on Thursday. The outcome is expected to be positive with 2 or 3 billion more in revenue than the same period of last year.
This Idea is risky as it is against the odds of the current economic global situation
Technical Analysis - Rectangle pattern


AMD inverse H&S incoming?AMD is lately gaining more of the market because of winning battles with Intel.
Maybe it can break through the CoV-SARS-2 market downturn?

Semiconductors anyone??Cup and handle on the daily for Mu and weekly for Intel. This is a very bullish and often very successful chart pattern. Go long buddy!

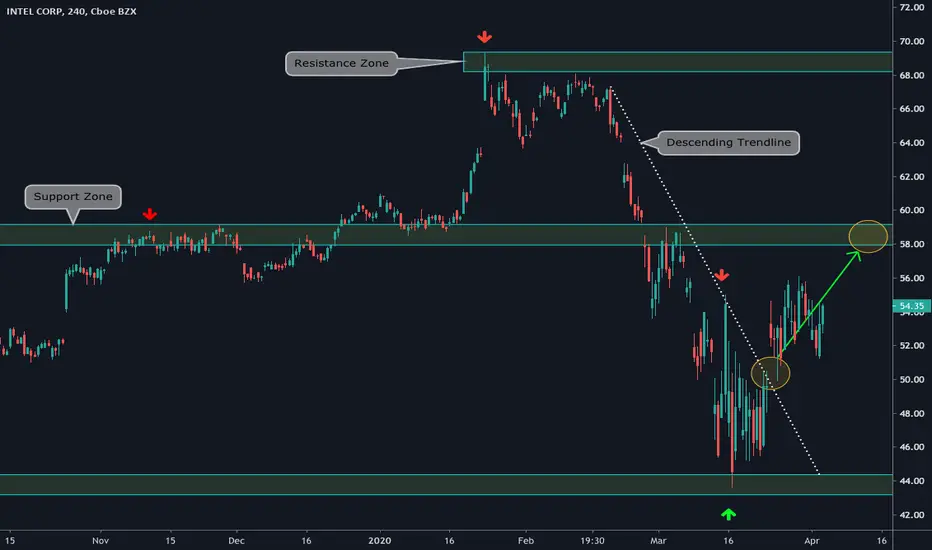
"Intel: going up: by ThinkingAntsOk4H Chart Explanation:
- Price bounced on the Support Zone and broke the Ascending Trendline.
- After that, it is on a Bullish Corrective Structure.
- After the price breaks it, price will up towards the Resistance Zone.
Weekly Vision:
Daily Vision:
Updates coming soon!
INTC : overextended wave 5 possibleMajor support has been tested multiple times around $45. Should it fail, with Wave 3 being less than 1.618, wave 5 tends to overextend itself. Targeting a price point of $35 - $33 to look at building a long position to capture a relief bounce for Wave B of the ABC correction (5-3-5) I’m leaning towards.

Intel forms a cup do i hear a handle??Basic analysis of a promising cup and handle formation, firstly I believe tech stocks will hold this market up during this period of uncertainty, and Intel is a great example. With this bullish formation, after a small pullback to form the handle Intel is setup for a nice run. I might go long on this.

Intel CorpMMHVW - the higher the monkey climbs the harder he falls. Expect a pullback to circa 29. Do your own research as this is not investment advice.

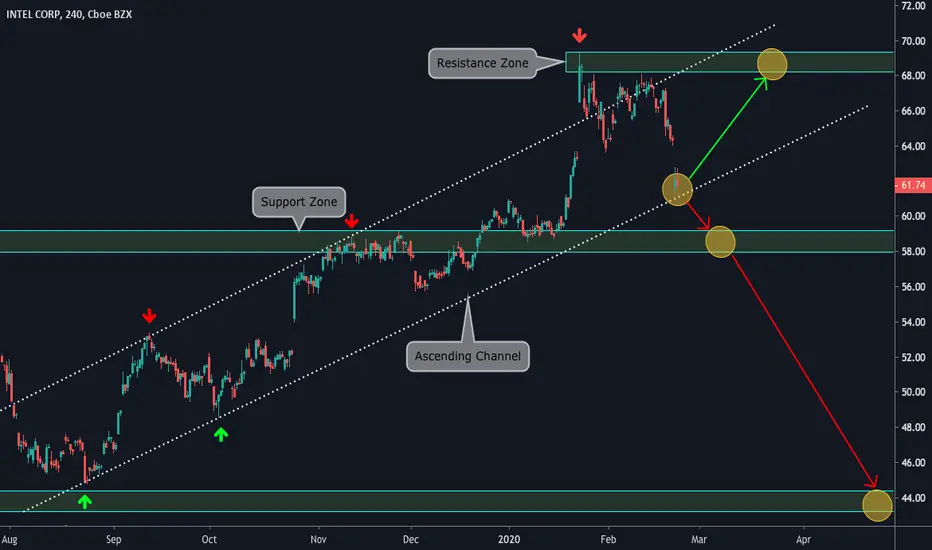
"Intel on a critical level' by ThikingAntsOk4H Chart Explanation:
- Price is on an Ascending Channel.
- It is on the Bottom of the Channel, close to the next Support Zone.
- From here, price may take two ways: 1) start an up move that should take it to the All Time Highs Level; 2) break down the Channel and go towards the Support Zones.
Weekly Vision:
Daily Vision:
Updates coming soon!
Intel pops to median lineAfter a better than expected earnings report, intel has popped into 2 key levels.
Firstly this very long-term pitchfork median line, and secondly this parallel channel on the Daily
