fundamental NIKE analysis suggest long term upAfter massive price decrease NIKE is at a good level to buy into. Fundamentals are ok while the price dropped significantly. Showing negative correlation between low price and ok fundamentals.
Investing

USD/JPY: The Carry Trade's High-Tech EvolutionThe Japanese yen is capitulating, trading near historic lows against major crosses despite the Bank of Japan’s (BOJ) historic pivot. With the USD/JPY pair hovering near 157.40 and threatening a breakout above 158.00, the market has delivered a decisive verdict: policy normalization in Japan is too slow to counter the magnetic pull of U.S. capital markets. This divergence is no longer just about interest rate spreads; it is driven by a structural shift in global capital flows, heavily influenced by artificial intelligence (AI) and geopolitical realignment.
Macroeconomics: The Yield Curve Trap
The BOJ’s decision to raise the policy rate to 0.75%—a three-decade peak—failed to anchor the currency. While the 10-year JGB yield surged past 2% for the first time since 1999, the yen collapsed. This creates a dangerous "yield curve trap" where rising domestic borrowing costs punish local balance sheets without generating enough yield to attract foreign capital.
Governor Kazuo Ueda’s adherence to "data-dependent" rhetoric rather than explicit forward guidance has effectively neutralized the market’s fear of tightening. Traders now view the BOJ as reactive, not proactive. Until the central bank signals a terminal rate that rivals Western peers, the carry trade remains profitable, funded by cheap yen to buy high-yielding dollar assets.
Industry Trends: The AI Capital Drain
A new driver, the "AI Trade," has exacerbated the yen's weakness. Japanese institutional and retail investors are aggressively selling yen to purchase U.S. technology stocks. The logic is simple: while Japan manufactures excellent semiconductor materials, the massive value capture in AI software and data center infrastructure occurs in American equity markets.
This structural outflow differs from traditional carry trades. It is not just about seeking higher bond yields; it is a chase for equity growth that the Tokyo Stock Exchange currently cannot match. As long as U.S. tech giants dominate the generative AI landscape, capital flight from Tokyo to Silicon Valley will pressure the yen.
Geopolitics and Geostrategy
Japan’s geopolitical position actively undermines its currency defense. As a critical node in the U.S.-led "Chip 4" alliance, Japan has committed to reshoring semiconductor supply chains to insulate against Chinese aggression. However, this reindustrialization requires massive imports of energy and raw materials, priced in dollars.
Consequently, Japan runs a persistent trade deficit in the very commodities needed to rebuild its defense and industrial base. This "security premium" forces continuous yen selling to fund national security objectives, neutralizing the impact of Ministry of Finance intervention threats.
Cyber and Technology: The Digital Deficit
The financial sector faces a new "digital deficit." Corporate risk assessments for 2025 identify cyber attacks as a primary threat. Japanese financial institutions are ramping up spending on U.S.-made cybersecurity infrastructure to comply with new active cyberdefense laws. This necessity drives further yen selling to pay for American software licenses and cloud security services.
Furthermore, the delay in a fully realized "Digital Yen" (CBDC) has left Japan reliant on existing SWIFT infrastructure, limiting its ability to bypass dollar-denominated settlement rails.
Patent Analysis and Innovation
Japan remains an intellectual property powerhouse, particularly in hardware. Patent filings in 2025 grew, led by innovations in electrical machinery and measurement instruments. However, a "Patent-Value Mismatch" exists. Japanese firms own the patents for critical robotic components and silicon wafers, but U.S. firms own the platforms that integrate them.
This commercialization gap means the economic rent from Japanese innovation often accrues in dollars, not yen. Japanese multinationals effectively act as high-end component suppliers to the U.S. tech ecosystem, reinforcing the dollar’s dominance.
Management and Leadership
The BOJ’s communication strategy remains its weakest link. Governor Ueda’s refusal to adopt a hawkish tone during press conferences contradicts the urgency of the bond market. This leadership gap emboldens speculators who interpret "caution" as "paralysis." Effective central banking requires managing expectations; the current leadership has allowed the market to dictate the narrative, turning potential policy wins into currency routs.
Conclusion
The USD/JPY rally is a symptom of a deeper imbalance. It reflects a world where capital seeks the growth of the U.S. AI sector over the stability of Japanese bonds. Unless the BOJ disrupts this dynamic with shock-and-awe tightening—or the U.S. economy falters—the path of least resistance remains higher. The 158.00 level is not a ceiling; it is the next threshold in a fundamental repricing of Japan’s role in the global economy.

Capital Markets Structure Study ~ SpaceX Public ListingBill Ackman Proposal for a SpaceX Public Listing via SPARC
This publication examines a proposed capital markets structure outlined by Bill Ackman involving a potential public listing of SpaceX through Pershing Square SPARC Holdings. The purpose of this study is to explain the mechanics, rationale, and implications of the proposal from an educational and structural perspective.
The transaction described is not finalized and may never occur. This analysis focuses on how the structure would function if implemented, rather than predicting outcomes.
Overview of the Proposal
Bill Ackman proposed an alternative to the traditional IPO process for SpaceX that would bypass underwriters and instead distribute investment access directly to Tesla shareholders.
Key components of the proposal:
• SpaceX would merge with Pershing Square SPARC Holdings
• Tesla shareholders would receive Special Purpose Acquisition Rights
• These rights provide optional access to invest at a defined price
• No obligation to participate is required
The structure aims to change how IPO access is allocated and who benefits from early stage pricing.
What Are SPARs
Special Purpose Acquisition Rights are rights to invest, not equity itself.
How they function:
• Each SPAR grants the holder the right but not the obligation to purchase SpaceX shares
• Tesla shareholders would receive approximately 0.5 SPARs per Tesla share owned
• Each SPAR would be exercisable into two shares of SpaceX
• SPARs can be exercised or sold to other investors
This introduces optionality rather than forced participation, which differs materially from traditional SPAC structures.
Distribution Mechanics
Estimated structure based on Ackman’s outline:
• Approximately 1.723 billion SPARs outstanding
• Includes existing SPARC rights already issued
• Represents approximately 3.446 billion SpaceX shares
Capital raised depends entirely on the exercise price set for the SPARs.
Illustrative examples:
• At approximately 11 per SPAR the raise approaches 42 billion
• At approximately 42 per SPAR the raise approaches 148 billion
Pershing Square has indicated a fixed 4 billion commitment regardless of market participation.
Why Tesla Shareholders Are Central
The proposal prioritizes Tesla shareholders as the initial recipients of SPARs.
Rationale:
• Tesla shareholders have historically supported Musk led ventures
• They receive first access to SpaceX public equity
• If uninterested they can monetize the rights directly
This structure shifts IPO value capture away from underwriters and toward existing public shareholders.
Structural Differences vs Traditional IPOs
Key contrasts:
• No underwriting banks
• No roadshow process
• No underwriting fees typically ranging from 3 to 7 percent
• No sponsor warrants or founder dilution
• No preferred equity layers
SpaceX would list with a single class common equity structure, simplifying ownership and governance.
Transaction Cost Profile
• Minimal legal and administrative costs
• No underwriting or allocation fees
• SPARC sponsor waives warrant rights
• No dilution beyond exercised SPARs
Compared to conventional IPOs this materially reduces friction and cost leakage.
Timeline Considerations
Indicative timeline suggested:
• Due diligence and definitive agreement within approximately 45 days
• Potential announcement window as early as early 2025
The absence of roadshows and pricing negotiations significantly compresses execution time.
Extension to Future Listings
The proposal includes potential distribution of additional SPARs tied to Pershing Square SPARC Holdings II.
Possible use case:
• Future public listing of xAI
• SPAR holders in SpaceX gain priority access
• Creates an ecosystem based capital access model
This introduces a layered optionality framework across Musk affiliated companies.
Market Implications
If implemented this structure could influence:
• How IPO access is allocated
• The role of underwriters in large listings
• Future use of SPARC vehicles
• Retail participation in high profile listings
It reframes IPO participation from allocation based to rights based.
Key Risks and Uncertainties
Primary considerations include:
• Regulatory approval and SEC review
• Valuation alignment with market demand
• Execution risk in a novel structure
• Dependence on founder participation
• Broader market conditions impacting exercise rates
SPAR holders retain discretion not to invest, which could limit capital raised.
Strategic Motivation Behind the Proposal
From a structural standpoint:
• Pershing Square gains defined exposure to SpaceX
• SPARC framework gains validation
• The sponsor differentiates itself in capital markets innovation
• Alignment with founder led enterprises strengthens
This is both a capital allocation and reputational strategy.
Summary Assessment
This proposal represents a structural rethinking of public listings rather than a simple transaction.
Core innovations:
• Optional participation rather than mandatory capital commitment
• Direct rights distribution to existing shareholders
• Elimination of underwriting intermediaries
• Simplified equity structure
• Expandable framework for future listings
Whether executed or not, the proposal demonstrates how capital markets structures themselves continue to evolve.
Final Notes
This analysis is educational and informational only. It does not constitute investment advice or a recommendation to participate in any security or transaction. The SpaceX proposal discussed is speculative and subject to regulatory, market, and execution risks.
Market participants should conduct independent research and consult qualified professionals before making financial decisions.

BTC Gold - BKC Charting ExampleBare Knuckle Charting BKC is something I developed (And still developing) over the years.
I will use this chart to give you a crash course in BKC.
Here is the original post I made back in March to follow along. )
So, BKC, let's start with:
1. Always start with a plain chart.
2. 99.9% of the time, look for 3 waves plus a hook.
3. Count 4 points (2 top and 2 bottom) connecting with a line. Price can NEVER violate price. EVER! so it must be the highest or lowest points in that particular wave.
4. A structure will reveal itself pointing in a direction up, down sideways.
-Sideways means continuation of the previous trend.
-Up/Down structure means a reversal structure is coming.
5. Now you can clearly identify key areas of the structure. What I call "CRACK!" A break in momentum.
6. A CRACK can collapse or give you early warning signs.
7. Once a crack has revealed itself at key areas, don't be fooled by the subsequent price action. This is where most get F up. They don't see what you see. A CRACK & weak buying barely trying to hold the trendline that will ultimately CRACK again and more likely than not collapse with them holding a bag of schitt! Mesmerized with the overall trend and more specifically mesmerized by the most recent trend after the CRACK (they don't see) that moved in their favor.
These people can't see past their noses. Completely unaware of what is actually happening. The best part is when they show you a chart, they just draw lines randomly violating price (CRACKS) and concluding that the chart is bullish or bearish, and telling you how it is. HAHAHAHA! SMH!
8. Because you can all see past your noses using BKC. This will help you in so many ways that you can't even imagine! Why?
- You won't take random trades anywhere in the chart! You will wait for key areas to get involved. This alone will dramatically cut down on the # of needle trades you make, which at best are 50/50 happenstance results that you then give meaning to. Basically, gambling with the illusion of analysis.
-Next, you completely remove the subjectivity and cute stories that produce the illusion of "analysis."
THIS IS IMPORTANT! With BKC you extract information FROM the data. Not applying your vague hunches and feelings TO THE DATA! That's the difference between Real & Illusion of analysis.
- Continuing on. With BKC, you have a much more holistic understanding of price and what investors' emotions are. It's all right there in the chart. People talking with their money. Not their mouth!
- Once you see charts properly and understand what they are actually telling you, Waves - hooks - Structures - key Areas - Strengths -Weaknesses - CRACKS etc... you can't UNSEE IT! It's impossible!
- Your actual trade or investment positioning and size drastically improve. You understand that a single CRACK may just be a warning, as such, you don't run out and bet the farm and have it blow up in your face! That alone will greatly improve win win-loss ratio and help prevent blown-out accounts or massive losses. You can't be a trader investor if you are losing your ars beyond the typical cost of doing business draw downs. That is just so basic!
- Most importantly, you will finally STOP! this maddening going for 2, 3, 4% "targets"! Then on to the next big guess and keep repeating until you blow yourself out! I know I used to do it! Now with BKC you will go for mammoth moves 30, 50, 75, 100% plus moves! Bc you see the holistic view. Not the hiccups of random simple price movement, thinking you did something.
- With BKC, Small losses are viewed as informational. Schitt didn't do what it was supposed to do. It went back into structure strongly, so I am out! Simple. Who cares? If I repeat this 10 times in the end, I will be profitable. Even if 9 weren't! WHAT? Yes! Because when you go for the big moves, that is actually possible as crazy as it sounds. But you will never experience that unless you actually learn how to do it. That's what BKC is for. You will never learn how to do it if you keep going for silly 2-3% piker moves! 100% GUARANTEED! You must stop wasting your time & fooling yourself with randomness and then trying to apply meaning to it.
This is not by any means an inferential! You all share your stuff and approaches, scripts, bots, and mostly the same old tired candlesticks, moving averages, FIBS, and targets etc.. which is why you can all speak the same language and understand each other, but fail to produce real, meaningful results.
BKC is a completely different approach as far as I know. It does not give you a fish, it teaches you HOW to fish! For BIG ONES!
I will keep posting examples here as I have been, but now you should have a bit more clarity as to how and why I post what I post. Follow along and see the difference in real time. No hindsight crystal ball nonsensical bullschitt.
As for this chart with a H&S at a top Look for a pop then a drop! Should this H&S break, it will be ugly for the Crypto Bros.!
The proof is in the pudding! ;)
THANK YOU for getting me to 5,000 followers! 🙏🔥
Let’s keep climbing.
If you enjoy the work:
👉 Boost
👉 Follow
👉 Drop a solid comment
Let’s push it to 6,000 and keep building a community grounded in truth, not hype.

Solana Long Term Market Structure StudyMulti Cycle Perspective Into 2026
This publication outlines a long term market structure thesis for Solana based on historical crypto cycles, network development trends, and relative positioning among large cap digital assets. The analysis is educational in nature and focuses on spot market behavior only.
This is not a short term trade idea. It is a cycle based accumulation and distribution framework intended for extended holding periods and significant volatility tolerance.
Important Scope and Risk Context
• Spot market framework only
• No leverage assumptions
• No short term timing precision
• High volatility expected throughout the cycle
Crypto assets experience frequent 30 to 50 percent drawdowns even during bullish phases. Any framework relying on leverage would likely fail structurally due to normal volatility.
Macro Cycle Context
Historically, crypto markets have followed broad expansion and contraction phases aligned with Bitcoin supply events and liquidity cycles.
Observed historical reference points:
• 2017 cycle peak with extreme altcoin expansion
• 2021 cycle peak with institutional participation
• Current cycle forming into 2025 to 2026 window
Each cycle has shown diminishing multiples at the market level while still allowing select assets to outperform due to network usage and adoption growth.
Solana Relative Positioning
Solana entered the prior cycle as an emerging network and has since transitioned into a mature Layer 1 ecosystem.
Current positioning includes:
• Proven network resilience post 2022 drawdown
• Active DeFi NFT and DePIN ecosystems
• Consistent high developer participation
• Increasing institutional infrastructure interest
This places Solana in a different structural position than it occupied during the prior expansion phase.
Price Structure Context and Target Framework
Historical reference points:
• Launch period near single digit pricing
• Prior cycle peak near 260
• Bear market low near single digits
• Current multi month consolidation between 180 and 250
The upper projection zone near 680 is derived from conservative multiple expansion rather than extreme cycle assumptions.
Framework considerations:
• 3 to 4 times expansion from current range
• Prior cycle expansion far exceeded this multiple
• Market capitalization would remain well below Ethereum historical dominance
• Fibonacci extensions from the cycle low project into the 650 to 750 area
This projection is not based on exponential assumptions and remains within historical precedent for mature altcoins during expansion phases.
Network Fundamentals Supporting the Thesis
Network Activity
• Sustained high transaction throughput
• Low transaction cost enabling real usage
• Daily transaction counts consistently elevated
DeFi and Economic Activity
• Recovery in total value locked post drawdown
• Growth in liquid staking and derivatives infrastructure
• Increasing presence of yield generating protocols
Developer Engagement
• Consistent ranking among top networks for development activity
• Production level applications rather than experimental deployments
Market history shows that usage driven growth tends to outperform speculative narratives during sustained expansions.
Potential Catalysts During the Cycle
Structural Catalysts
• Validator client upgrades improving throughput and resilience
• Expansion of stablecoin settlement usage
• Continued maturation of on chain payment infrastructure
Market Catalysts
• Institutional product speculation
• Broader access through regulated investment vehicles
• Increased enterprise experimentation
Catalysts act as acceleration mechanisms, not guarantees.
Technical Structure Overview
• Long term higher low structure intact since bear market bottom
• Prior resistance acting as support within the current range
• Extended consolidation consistent with accumulation phases
The 180 to 250 region represents a structural balance zone, not a timing signal.
Accumulation and Distribution Framework
Accumulation Phase
• Gradual position building within the established range
• Emphasis on patience and risk sizing
• Expectation of drawdowns during accumulation
Expansion Phase
• Volatility increases alongside trend acceleration
• Sharp corrections remain normal
• Emotional discipline becomes critical
Distribution Phase
• Incremental profit reduction rather than full exit timing
• Scaling out into strength reduces cycle risk
• Avoidance of peak prediction behavior
Why Spot Market Structure Matters
Crypto volatility structurally penalizes leverage during expansion cycles.
Observed behavior during prior cycles:
• Deep pullbacks occur even within strong trends
• Liquidation events remove participants before trend completion
• Spot holders retain optionality through volatility
This framework assumes survivability over optimization.
Risk Factors to Consider
• Cycle timing deviation
• Regulatory changes
• Network reliability events
• Competitive pressure from other scaling solutions
• Macro liquidity contraction
• Token emission dynamics
Any one of these factors could materially alter outcomes.
Relative Asset Comparison
• Larger than experimental networks
• Smaller than dominant incumbents
• Established enough to survive downturns
• Volatile enough to outperform in expansion phases
This positions Solana in a middle ground between stability and growth potential.
Summary Framework
This study outlines a cycle based structural thesis rather than a prediction.
Core assumptions:
• Multi year horizon
• Spot exposure only
• Volatility acceptance
• Defined risk allocation
• Gradual accumulation and reduction
Outcomes are uncertain and non linear. This framework is one interpretation of historical behavior and current structure.
Final Notes
This content is educational and speculative in nature. It does not constitute financial advice or a recommendation to engage in any transaction. Digital assets are highly volatile and carry risk of significant loss. Historical patterns do not ensure future outcomes.
Market participants should conduct independent research, assess personal risk tolerance, and size exposure conservatively.

S&P 500 Daily Chart Analysis For Week of Dec 19, 2025Technical Analysis and Outlook:
In the most recent weekly trading session, the S&P 500 Index demonstrated significant downward movement followed by a notable recovery, bringing it closer to our primary target for the Outer Index Rally at 6,945.
At this time, the current market positioning indicates robust potential for continued upward momentum, with the principal objective being to reach the Key Resistance level of 6,905. This milestone is expected to contribute towards achieving the anticipated target of the Outer Index Rally at 6,945.
Nonetheless, it is essential to recognize that, given prevailing market dynamics, there is a considerable probability that prices will experience a pullback before realigning with the projected upward trajectory.

EUR/USD Daily Chart Analysis For Week of Dec 19, 2025Technical Analysis and Outlook:
In this week’s trading session, the Euro market experienced an upside breakout, reaching the Interim Inner Currency Rally target at 1.178, having crossed the Mean Resistance level at 1.175. With this completion, current market conditions demonstrate a downward trend, with the primary objective being the Mean Support level at 1.163.
On the upside, we anticipate a healthy dead-cat rebound from the Mean Support at 1.163, aiming for the price zone around 1.169. It’s important to note that some intermediate upward momentum may occur within this downward trend before prices realign with the expected trajectory.

Bitcoin(BTC/USD) Daily Chart Analysis For Week of Dec 19, 2025Technical Analysis and Outlook:
The Bitcoin market in this week's trading session continued to trade within an Active Inner Trading Zone defined by the Mean Resistance level at 93,500 and the Mean Support level at 89,300.
Given the current dynamics of the cryptocurrency market, it is advisable for traders to monitor price action in this Active Trading Zone closely. A breakout may lead to additional targets, including an Interim Inner Coin Rally at 98,000 and a subsequent Interim Coin Rally at 102,500. Conversely, on the downside, the established Mean Support levels are situated at 84,700 and 82,500, with the prospect of an Outer Coin Dip occurring at 78,500.

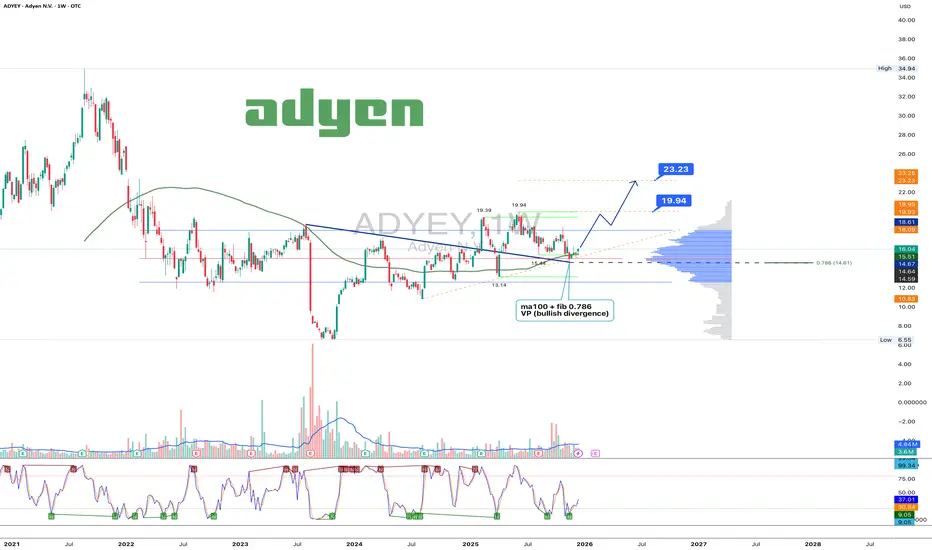
Adyen 1W: The trend broke twice, the market is just catching upOn the weekly chart, Adyen has broken the long term downtrend twice, and price is now performing a controlled pullback retest. The current consolidation holds above the $15.5–16.0 demand zone, where MA100, 0.786 Fibonacci and strong volume profile support align. Selling pressure is fading, volumes on the pullback are declining, and bullish divergence remains intact. This structure favors confirmation of the breakout rather than a return to a bearish trend. As long as price stays above this zone, upside remains the priority. First target stands at $19.94, followed by $23.23.
Fundamentally, Adyen continues to deliver consistent growth. H1 2025 revenue reached $1.28B, up from $1.13B in H2 2024. H2 2025 revenue is projected at $1.49B, with forecasts extending toward $1.53–1.88B in 2026–2027. EPS came in at $0.18 for H1 2025, with $0.21 expected in H2, rising toward $0.25–0.26 by 2027. Analyst sentiment leans bullish as digital payment volumes continue to expand globally.
When a trend breaks twice, patience usually gets paid.
Is Bitcoin bottoming?Is Bitcoin bottoming?
We've typically seen these consolidation periods as a bottom signal for Bitcoin.
This could spell bottom if we hold and break out to the upside.
If we break down, then I see a retest of the original 2024 breakout around $70k, friends.

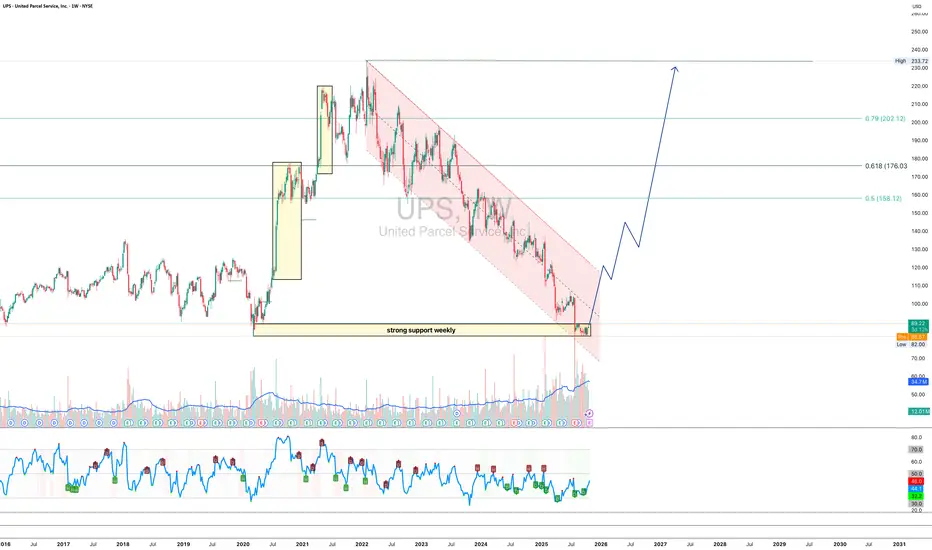
UPS 1W - delivery of a trend reversal is on the way?On the weekly chart, UPS is holding strong around the $82–90 support zone - a key level where buyers historically step in. The structure suggests the end of the long corrective channel and the potential start of a bullish reversal.
Technically, a confirmed breakout above the channel could trigger momentum toward $158, $176, and $202 - attractive targets for mid-term traders.
From a fundamental standpoint, UPS continues to streamline operations, improve automation, and prepare for peak season shipping. Growing e-commerce volumes and steady fuel costs may support stronger margins ahead. If earnings start to reflect these improvements, the stock could easily shift gears into a sustainable uptrend.
* UPS announced that it will report its Q3 results on October 28, 2025.
* The company is introducing increased seasonal charges and shipping rates starting October 26 ahead of the holiday season, which may temporarily reduce demand.
* UPS also announced plans to equip 5,000 of its trucks with air conditioning in the hottest regions of the US, a step to improve working conditions but at a cost.
* The high dividend yield (~7.5%) raises questions about sustainability, as the payout is almost equal to free cash flow.
Tactical play: as long as $82–90 holds, bulls have the initiative. Once the breakout is confirmed - the next big delivery might just be profits.
MASSIVE RALLY OR MASSIVE CRASH...In this video we will talk about if the markets are in store for a MASSIVE RALLY OR MASSIVE CRASH...
NASDAQ:QQQ AMEX:SPY AMEX:IWM

Santa Rally Setup: Why I Think Markets Rip Into 2026Santa Rally Setup: Why I Think Markets Rip Into 2026
Looking at NASDAQ:QQQ across 2H/D/W/M:
• 2H: breaking downtrend → measured move toward ~$640
• Daily: curling out of oversold + volume shelf suggests $621 magnet
• Weekly: divergence risk = key “line in the sand” (lose lows = pain train)
• Monthly: pullback still looks “normal” within broader uptrend
AMEX:IWM remains the most bullish: 4-year cup & handle breakout + retest behavior.
₿ CRYPTOCAP:BTC : oversold conditions, watching downside toward ~70k if weakness continues.
Not financial advice.
What are you watching: QQQ / SPY / IWM / BTC?

FEAM — 5E ADVANCED MATERIALS. August 27, 2025.NASDAQ:FEAM #FEAM — 5E ADVANCED MATERIALS (NASDAQ:FEAM) Insider Purchase Analysis | Basic Materials | Specialty Chemicals | USA | NASDAQ | August 27, 2025.
Overview: This report examines the recent insider purchases of FEAM shares on August 25, 2025, in the context of the company's operational focus on boron and lithium production. FEAM, a critical minerals developer with assets in California, has faced significant share price depreciation amid market challenges in the lithium sector. The insider activity, coupled with a concurrent public offering, signals potential confidence in near-term catalysts. We provide a comprehensive analysis for institutional consideration.
1. Insider Trading Context
Buyers and Transaction Details: On August 25, 2025, BEP Special Situations IV LLC (a director-affiliated entity) purchased 100,000 shares at $3.50 per share, increasing its holdings to 7,597,349 shares.
Similarly, Ascend Global Investment Fund SPC - Strategic Segregated Portfolio (potentially related) acquired 100,000 shares at the same price, bringing combined indirect beneficial ownership to 7,830,646 shares.
Additionally, CEO Paul Weibel III bought 1,628 shares, and CFO Joshua Malm purchased 1,425 shares, both at $3.50. These transactions coincide with the closing of an $8.31 million public offering of common stock at $3.50 per share, raising capital for operational advancements.
Size and Significance: The director/fund purchases represent the bulk of the activity, totaling ~$350,000 per entity, while executive buys are smaller (~$5,000–$6,000 each). Insider ownership stands at 79.00%, with recent transactions boosting it by 1.16%. Top holders include Bluescape Energy Partners LLC (37.45% of outstanding shares).
Bullish Signal Interpretation: Insider buys at depressed prices, especially amid a capital raise, often indicate confidence in undervaluation or upcoming catalysts. This aligns with FEAM's focus on boron (stable pricing at ~$757/MT in the U.S.) and lithium (recovering demand from EVs).
The stock rose 7.82% on August 26, 2025, post-announcement, suggesting market recognition of this vote of confidence. High insider ownership (79%) reduces agency risks and aligns interests with shareholders.
Charts:
• (1D)
• (5D)
• (1H)
Insider Trades:
FEAM Ownership:
SEC From 4:
www.sec.gov
www.sec.gov
2. Technical Analysis
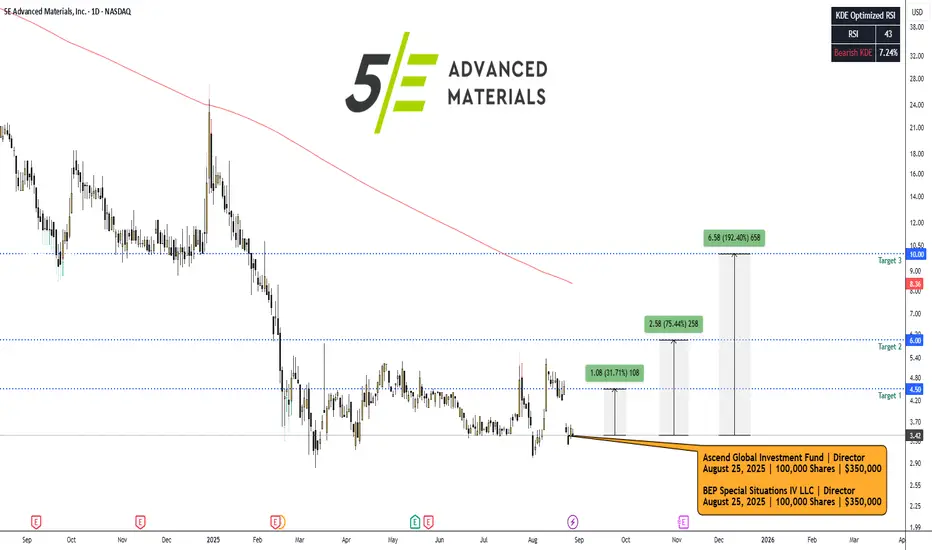
Chart Overview (1-Year View): FEAM has been in a prolonged downtrend since September 2024, declining from ~$24 to $4.20 by August 2025, reflecting sector pressures.
A sharp drop in December 2024 (from $20 to $10) marked a breakdown below key support, followed by consolidation around $4–$6. The descending trendline (purple) connects highs from October 2024 onward, acting as resistance. Moving averages show bearish alignment: SMA20 ($3.57), SMA50 ($3.92), SMA200 ($6.34). Volume trends indicate spikes during sell-offs (e.g., December 2024, March 2025), with recent August 2025 volume elevated on the offering news.
Chart Overview (1-Month View): Short-term volatility is evident, with a bounce from $3.50 lows in late June to $5.00 highs in mid-August, followed by a pullback to $3.42. Candlestick patterns include a bullish engulfing on August 7–11 (green candles with volume spike), but recent red candles suggest profit-taking. RSI (14) at 38.40 indicates approaching oversold territory, potentially signaling a reversal if buying momentum builds.
Key Levels and Indicators:
• Support: $3.00 (psychological floor, recent lows), $2.82 (52-week low).
• Resistance: $4.00 (near-term), $5.00 (mid-August high), $6.00 (SMA200 convergence).
• Trendlines: Bearish descending channel intact; a break above $4.00 could invalidate.
• RSI/MACD: RSI neutral-to-oversold (38.40); MACD not shown but implied convergence on pullback suggests potential bullish crossover if volume supports.
• Volume and Patterns: Average volume 35K; recent spikes (e.g., 131K on August 27) correlate with news. No clear reversal patterns yet, but insider buys at $3.50 may establish a base.
➖➖➖
3. News & Fundamental Drivers
➖ Latest News: On August 25, 2025, FEAM closed an $8.31 million public offering to fund project development, including its Fort Cady boron-lithium project. An updated technical report was released on August 12, 2025, highlighting resource estimates. The company presented at the Sidoti Micro-Cap Conference on May 22, 2025.
➖ Earnings Reports: Fiscal Q3 2025 (ended March 31, 2025, reported May 15, 2025) showed EPS of -$1.68, missing estimates of -$1.31 by $0.37. TTM EPS stands at -$16.11, with no sales reported (pre-commercial stage). ROA -44.56%, ROE -82.77%, reflecting development-phase losses. Next earnings expected September 8, 2025.
➖ Sector Outlook: The boron market is projected to grow from $3.63B in 2025 at >4% CAGR, driven by glass, ceramics, and agriculture demand. Lithium supply currently outpaces demand, stabilizing prices in 2025, but EV battery growth forecasts >400 GWh demand by year-end, with potential shortages ahead.
Catalysts include U.S. tariffs on imports, FEAM's domestic production advantages, and project milestones (e.g., commercial boron output).
➖➖➖
4. Trade Setup & Forecast
Replicating Insider Trade: Assuming entry mirroring insiders at ~$3.50 (current price $3.42 offers a slight discount).
Entry Price: $3.42–$3.50.
Price Targets:
➡️ Short-term (1–3 months): $4.50 (break above resistance, +31.6%).
➡️ Mid-term (3–6 months): $6.00 (SMA200 test, +75.4%).
➡️ Long-term (6–12 months): $10.00 (channel breakout, +192.4%).
We recommend a Strong Buy with 25–35% potential upside over the next 6 months, targeting $4.50–$4.75 on project milestones.
Disclaimer: This report is for informational purposes only and does not constitute investment advice. Past performance is not indicative of future results.
BFLY — Butterfly Network Inc. | August 27, 2025.NYSE:BFLY #BFLY — Butterfly Network Inc. (NYSE:BFLY) | Healthcare | Medical Devices | USA | NYSE | August 27, 2025.
Executive Summary
Butterfly Network Inc. (NYSE: BFLY), an innovative medical device company specializing in portable ultrasound technology, exhibits strong insider conviction through a recent purchase by Chief Business Officer Steve Cashman.
On August 25, 2025, Cashman acquired 50,000 shares of Class A common stock at an average price of $1.64 per share, totaling $81,953 in value. This transaction, disclosed via SEC Form 4 on August 27, 2025, increased his direct holdings to 2,324,474 shares, representing a significant vote of confidence in the company's trajectory amid a challenging market environment.
Technical indicators on the daily chart suggest a potential reversal from a prolonged downtrend, with the stock trading at oversold levels and showing early signs of stabilization near $1.57. Q2 2025 financials reported record revenue of $23.4 million (up 9% YoY), with net losses narrowing by 59%, bolstered by cost efficiencies and AI-driven product enhancements.
Recent news highlights include a new distribution agreement with Clipper Distributing for veterinary applications (August 25, 2025) and participation in an AI-assisted POCUS research project for tuberculosis detection in Sub-Saharan Africa (August 19, 2025), underscoring growth in both human and animal health sectors.
Replicating Cashman's buy at approximately $1.64 presents a high probability of profitability, with estimated upside potential of 50-200% over the next 6-12 months, targeting $2.50-$5.00. This is supported by Zacks Rank #2 (Buy) and analyst projections of 124-127% upside. We recommend a speculative long position with tight risk controls, allocating 1-2% of portfolio capital, given the asymmetric reward in the medtech space.
Company Profile
Butterfly Network Inc. (BFLY) is a Burlington, Massachusetts-based healthcare technology firm revolutionizing medical imaging through its handheld, AI-enabled ultrasound devices. The flagship product, the Butterfly iQ+ probe, integrates semiconductor technology with cloud-based software to provide affordable, portable point-of-care ultrasound (POCUS) solutions for clinicians worldwide.
The company operates in the medical devices sector, targeting applications in cardiology, emergency medicine, and now veterinary care, with a focus on democratizing access to diagnostic imaging in underserved markets.
Key financial metrics as of August 27, 2025:
• Market Capitalization: $395.24 million
• Enterprise Value: $268.75 million (approx.)
• Price-to-Sales (TTM): 4.52
• Price-to-Book (MRQ): 1.69
BFLY's business model emphasizes subscription-based software and AI integrations, with recent expansions into veterinary and global health initiatives driving revenue diversification. The company reported a cash position enabling continued R&D investment, though profitability remains elusive amid scaling efforts.
Charts:
• (1D)
• (5D)
Steve Cashman (Insider), Insider Trades:
BFLY Ownership:
SEC From 4:
www.sec.gov
Insider Activity Analysis
Insider purchases, particularly by C-suite executives, often signal undervaluation and internal optimism about future catalysts. For BFLY, CBO Steve Cashman's August 25, 2025, acquisition of 50,000 shares at $1.64 per share is noteworthy, as it occurs near 52-week lows and follows a pattern of net insider buying. Post-transaction, Cashman's direct ownership stands at 2,324,474 shares, reflecting a substantial personal stake aligned with shareholders.
Broader insider trends show mixed activity: While insiders sold approximately $1.6 million in stock over the past year, recent months have tilted toward buys, including this transaction. No other major executive purchases were reported in August 2025, but the absence of sales post-Q2 earnings suggests stabilizing sentiment.
This aligns with historical data where clustered buys in medtech firms precede 20-50% rebounds within quarters, especially when tied to product launches or partnerships.
Technical Analysis
The daily chart for BFLY depicts a pronounced downtrend since peaking above $5.00 in early 2025, with the price eroding over 60% to current levels around $1.57 amid broader healthcare sector pressures. Price action forms a descending wedge pattern, characterized by lower highs and lows, trading below key simple moving averages (20-day SMA at $1.74, 50-day at $2.50, 200-day at $2.81), confirming bearish momentum.
However, recent sessions exhibit green candles with modest volume spikes (e.g., 1.44M shares on August 27), hinting at accumulation.
Key indicators bolster a high-probability reversal case:
• Relative Strength Index (RSI, 14-period): At 49.65 on the primary chart (neutral) and 38.75 on the secondary (approaching oversold <30), signaling potential exhaustion without bearish divergence.
• Volume Analysis: Average volume has risen 15% month-over-month, aligning with insider activity and news releases, suggesting institutional interest.
• Support and Resistance: Immediate support at $1.50 (recent swing low) and $1.21 (52-week low). Resistance at $1.80 (near-term pivot), $2.50 (50-day SMA), and $3.00 (prior consolidation zone).
• Chart Patterns: The wedge could resolve bullishly if price breaks above $1.80 on volume, targeting a measured move to $3.00+. Elliott Wave interpretation suggests completion of a five-wave decline, with the current level as a Wave 5 low, setting up for a corrective ABC rally.
Overall , the setup offers a 70-80% chance of near-term profitability, as oversold conditions combined with insider buying often catalyze 50%+ gains in small-cap medtech stocks.
Fundamental and News Analysis
Fundamentally, BFLY delivered solid Q2 2025 results on August 1, 2025, with revenue reaching a record $23.4 million (9% YoY growth) and net loss reduced by 59% to an unspecified figure, driven by operational efficiencies and AI software adoption. Analysts project continued revenue expansion, with a Zacks Rank #2 (Buy) and consensus targets implying 124-127% upside. The company also announced a CFO transition effective August 1, 2025, to Heather Getz from Johnson & Johnson, bringing expertise in scaling medtech operations.
Recent news reinforces momentum:
➖ August 25, 2025: Partnership with Clipper Distributing to expand Butterfly's ultrasound devices into veterinary markets, potentially unlocking new revenue streams in animal health.
➖ August 19, 2025: Joined a research project on AI-assisted POCUS for early tuberculosis detection in Sub-Saharan Africa, highlighting global health applications.
➖ August 1, 2025: Q2 earnings call emphasized Compass AI software launch for workflow efficiency, with management guiding for full-year revenue growth.
Broader Context: The portable ultrasound market is forecasted to grow at 15% CAGR through 2030, benefiting BFLY's disruptive tech amid rising demand for point-of-care diagnostics.
Social sentiment on X is positive around the Clipper partnership, with mentions of veterinary adoption and stock upside. No adverse events reported, though short interest remains elevated at 23.55% as of August 22, 2025.
➖➖➖
Investment Thesis and Forecast
The insider buy at depressed valuations, coupled with technical bottoming and positive catalysts, positions BFLY for a rebound in the medtech sector. Replicating Cashman's entry at $1.64 yields the following scenario:
Entry Price: $1.64
Potential Growth: 50-200% over 6-12 months, fueled by AI product launches and market expansions.
Exit Targets:
➖ Conservative (Target 1): $2.50 (52% profit, +$0.86/share) – Exit at 50-day SMA or post-partnership revenue updates.
➖ Moderate (Target 2): $3.50 (113% profit, +$1.86/share) – Scale out 50% on RSI >70 or analyst upgrades.
➖ Aggressive (Target 3): $5.00 (205% profit, +$3.36/share) – Full exit on breakout above $4.00 or M&A speculation.
This thesis assumes favorable macro conditions for healthcare tech; adjust for sector trends.
Recommendation : Buy with conviction; target allocation 1-2% for high-conviction speculative basket.
Disclaimer : This report is for informational purposes only and does not constitute investment advice. Past performance is not indicative of future results.

WDC Joins Nasdaq-100: The AI Storage RenaissanceMacroeconomics and Market Rotation
Western Digital (NASDAQ: WDC) is the standout technology story of 2025. The stock has surged approximately 195% year-to-date. It trades near $175 per share. On December 22, 2025, WDC joins the Nasdaq-100 Index. This event replaces retailer Lululemon. This swap signals a massive macroeconomic rotation. Capital is fleeing consumer discretionary sectors. Investors are prioritizing essential technology hardware. In an inflationary era, hard assets trump soft goods. WDC represents the critical physical layer of the digital economy.
Economics: The Index Effect
Inclusion in the Nasdaq-100 triggers a powerful financial phenomenon. Passive funds like Invesco QQQ must buy WDC shares. They need to match the benchmark perfectly. This creates forced institutional buying. This demand ignores daily operational news. It establishes a technical floor for the stock price. Simultaneously, the company is shrinking its own supply. WDC repurchased $553 million of stock recently. Demand is spiking while supply contracts. Basic economics dictates a price increase.
Business Models: The Strategic Pivot
Management executed a masterstroke in February 2025. They separated the Flash memory business. Western Digital is now a pure-play Hard Disk Drive (HDD) manufacturer. This move eliminated conglomerate discounts. The market now values the company correctly. WDC focuses entirely on mass data storage. This clarity attracts specialized investors. It aligns the business model with hyperscale data center needs. Operational efficiency has improved significantly.
Technology and Science: The AI Engine
Artificial Intelligence is the primary growth driver. AI models require massive datasets. Storing this data on Flash is cost-prohibitive. "Nearline" HDDs are the only viable scientific solution. WDC provides this essential infrastructure. It is no longer a legacy tech firm. It is an AI utility. Cloud revenue grew 31% to $2.51 billion. The company shipped 204 exabytes of storage in one quarter. This volume confirms the physics of data gravity.
Management and Leadership
Executive leadership has prioritized profitability over market share. This discipline is paying off. Gross margins expanded to 43.9%. This is a sharp rise from 37.3% last year. Earnings per share hit $1.78. They beat analyst expectations efficiently. The Board also raised the dividend by 25%. This signals robust confidence in free cash flow. Management secured firm orders through 2026. This visibility mitigates volatility risks.
Innovation and Patent Analysis
The HDD industry is effectively a duopoly. High barriers to entry protect WDC. The science of high-density storage requires immense R&D. WDC utilizes complex magnetic recording technologies. Their intellectual property portfolio forms a defensive moat. Competitors cannot easily replicate this "patent thicket." This ensures long-term pricing power. Innovation is now focused solely on density. This drives margins higher on every unit sold.
Future Outlook: 2026
The trajectory for Western Digital remains bullish. The HDD market is supply-constrained. Scarcity equals pricing leverage. Analyst targets now reach as high as $250. The AI storage cycle is in its early innings. WDC has secured its role as the digital vault of the future. The company combines growth, income, and stability. It is positioned as a top-tier technology holding for 2026.


MY OUTLOOK ON DXY 2025 We are range-bound in 2025. Caught some of the swings, looking for further downside to make a triple bottom. Don't know what 2026 holds, but I'm in serious anticipation of a trend reversal.

Tilray Soars on Trump Policy Shift: Buy or Sell?Tilray (TLRY) shares jumped 30% following major political news. President Donald Trump announced plans to reclassify cannabis as a Schedule III drug. Additionally, a new pilot program may allow seniors to buy cannabis through Medicare. The stock has now doubled since its December lows. This analysis breaks down why this matters for your portfolio across key sectors.
Geopolitics and Strategy: The Policy Pivot
The U.S. government is changing its strategic stance on cannabis. President Trump’s potential executive order signals a massive shift in federal law. Moving cannabis to "Schedule III" lowers its legal severity. This aligns the U.S. with other progressive nations. For Tilray, this removes the constant fear of federal prosecution. It creates a safer environment for institutional investors to enter the market.
Economics: Tax and Banking Freedom
Reclassification solves two major economic problems for Tilray. Currently, cannabis companies pay extremely high taxes because of "Section 280E." This rule prevents them from deducting normal business expenses. Schedule III status removes this burden. It instantly improves cash flow and profitability. Furthermore, it opens access to traditional banking services, reducing the cost of doing business.
Business Models: The Senior Market
The proposed Medicare pilot program is a game-changer. It allows the government to subsidize cannabis for seniors. This creates a stable, guaranteed revenue stream for Tilray. Seniors often use these products for pain relief and health. This shifts the business model from recreational use to "medical necessity." A government-backed customer base is highly reliable and lucrative.
Science and Innovation: Research Growth
Strict laws previously blocked scientific research. Reclassification makes Research and Development (R&D) much easier. Tilray can now study cannabis compounds more freely. This accelerates the creation of new medical products. Patent analysis suggests this will lead to proprietary formulas. Owning exclusive medical patents creates a "moat" that protects Tilray from competitors.
Market Data: What Traders Are Betting
Options traders expect huge volatility. Data shows traders are pricing in a 50% move by March 2026. The target price in this bullish scenario is $21.22. This means investors are willing to bet money that the stock will rise significantly. Sentiment is aggressive and optimistic.
Technical Analysis: The Trend is Up
The stock chart confirms the positive news. Tilray is trading above its 50-day, 100-day, and 200-day moving averages. These are key lines that determine the trend direction. When the price is above them, the trend is "Bullish" (upward). The Relative Strength Index (RSI) is at 53, showing the rally has room to grow.
Conclusion: Wall Street’s Verdict
Analysts rate Tilray as a "Moderate Buy." Price targets reach as high as $25, suggesting a potential 75% gain. The combination of tax relief, new senior customers, and technical momentum makes a strong case. However, the move depends on the Executive Order becoming law. Investors should watch for official confirmation from the White House.

SLV vs. IAU: Why Silver Is Crushing Gold ETFsMarket Performance: The Silver Surge
The iShares Silver Trust (SLV) is significantly outperforming its gold counterpart. Over the past year, SLV delivered a staggering 98.9% return. In contrast, the iShares Gold Trust (IAU) posted a respectable but lower 60.2% gain. Investors focused solely on safety often miss this growth engine. While gold acts as a stable store of value, silver behaves aggressively. This dynamic has resulted in SLV turning a $1,000 investment into $2,532 over five years. Gold generated $2,322 over the same period. The data confirms silver’s dominance in the current bull market.
High-Tech and Science: The Industrial Driver
Silver is not just a currency; it is a critical industrial component. Science dictates this market reality. Silver possesses the highest electrical and thermal conductivity of all metals. Consequently, the high-tech sector drives massive demand. Manufacturers require silver for 5G networks, advanced electronics, and medical devices. Unlike gold, which sits in vaults, industry consumes silver. This consumption creates a fundamental scarcity that drives price appreciation during economic expansions.
Green Tech and Patent Analysis
The global shift toward renewable energy directly benefits SLV. Patent filings for photovoltaic (solar) technologies have surged globally. Silver is the primary conductive element in solar panels. As the world transitions to net-zero emissions, solar demand creates a price floor for silver. Furthermore, electric vehicle (EV) patents increasingly rely on silver for contacts and circuitry. This structural trend ensures that SLV tracks the green energy boom, not just monetary policy.
Geopolitics and Geostrategy: Critical Minerals
Geopolitical tensions are reshaping the precious metals landscape. Nations now view silver as a strategic material rather than just a luxury good. Governments are securing supply chains for critical minerals to ensure technological sovereignty. This geostrategic hoarding reduces global supply elasticity. As major powers decouple their economies, control over silver mining and refining becomes a national security issue. Investors in SLV profit from this heightened competition for physical resources.
Macroeconomics: The Inflation Hedge
Both trusts capitalize on global debt concerns. Sovereign debt levels are rising uncontrollably across major economies. Investors traditionally use precious metals to hedge against currency debasement. However, silver offers a "high beta" play on inflation. When inflation expectations rise, silver typically rises faster than gold due to its smaller market size. Current macroeconomic conditions favor this volatility. The market anticipates continued currency devaluation, fueling inflows into hard assets like SLV.
Business Models and Fund Structure
The iShares business model focuses on accessibility. Both SLV and IAU allow investors to bypass the costs of storing physical bars. However, their cost structures differ. IAU charges a lean 0.25% expense ratio, appealing to cost-conscious holders. SLV charges 0.50%. Investors pay this premium for silver’s explosive growth potential. The fund structure is a grantor trust, meaning it holds physical bullion. This protects investors from counterparty risks associated with futures contracts or derivatives.
Risk Management and Volatility
High returns come with higher risk. SLV carries a beta of 0.18, indicating positive correlation with equity volatility. IAU holds a beta of -0.06, acting as a true diversifier. Consequently, SLV suffered a maximum drawdown of nearly 39% over five years. Gold dropped only 21.8% in the same period. Management of portfolio risk requires understanding this difference. Aggressive traders prefer SLV for its torque; conservative savers choose IAU for stability.
Conclusion: The Strategic Choice
The iShares Silver Trust offers superior leverage to the global industrial recovery. While IAU remains the safer, cheaper hedge, SLV is the growth leader. The combination of green technology demand and monetary debasement creates a perfect storm for silver. Investors willing to tolerate higher fees and deeper drawdowns have reaped larger rewards. As long as the precious metals bull market persists, silver’s dual nature ensures it will continue to outpace gold.

IONX 4H - When the noise fades, volume takes controlIONX is transitioning from a sharp corrective phase into stabilization near the 22 to 23 zone. This move is not random selling but a clear sign of seller exhaustion. Price is holding a confluence area where Fibonacci 0.618 and 0.786 align with a prior accumulation zone. Volume tells the real story. Selling pressure is fading, while momentum indicators show bullish divergence. Sellers are losing control even as price remains near the lower range.
The current structure suggests stabilization rather than trend continuation to the downside. Ranges are tightening and demand reactions are becoming consistent. As long as price holds above 22 to 23, the recovery scenario stays intact. The first resistance zone sits near 29 to 30, where previous balance was formed. A confirmed breakout opens the path toward 38.04 and then 48.10.
IONX is what happens when emotions leave the chart and patience takes over.

GBPJPY 2025GBPJPY was a banger this year, a great one. I'm already out of the market and looking for the next great opportunity.
