Investing

MY POSITION ON GOLD 2025I have been having streaks of good trades lately, and I feel I need to share some of my wins. Note, I'm not a Day trader, I'm more like a position or swing trader.
This is my Gold Position.

NZD/AUD Forecast: The Climb to 0.90 Amid Diverging Rates
Current Status: The New Zealand Dollar (NZD) has stabilized against the Australian Dollar (AUD), trading at 0.8728 . After bottoming near 0.86 in November, the cross is recovering, driven by a recalibration of interest rate expectations and shifting economic currents.
Macroeconomic Analysis: The Central Bank Divergence
A primary driver of the NZD/AUD recovery is the reassessment of monetary policy trajectories. The Reserve Bank of New Zealand (RBNZ) faces persistent domestic inflation, tempering expectations for aggressive rate cuts. Conversely, the Reserve Bank of Australia (RBA) maintained its cash rate at 3.60% in December, maintaining a hawkish stance due to upside inflation risks. This narrowing policy gap, where the RBNZ is no longer significantly "out-dovin" the RBA, provides crucial support for the Kiwi dollar.
Geostrategy & Geopolitics: The China Factor
Both currencies remain sensitive to Chinese economic stability, but their exposure differs significantly. The AUD serves as a liquid proxy for Chinese industrial demand, facing volatility as Beijing recalibrates stimulus measures for 2026. In contrast, the NZD ties closely to soft commodities like dairy and meat, which see resilient demand despite broader geopolitical friction. As trade routes stabilize, lower volatility in New Zealand's export markets contributes to the currency's "safe harbor" appeal relative to the risk-sensitive Aussie.
Industry Trends: AgTech vs. Mining Tech
New Zealand’s shift toward high-margin agricultural technology (AgTech) is altering its export profile. Innovation in sustainable farming and automated dairy processing boosts productivity, offsetting headwinds from traditional commodity price fluctuations. Meanwhile, Australia’s mining sector grapples with high capital costs for green energy transitions. This structural divergence suggests New Zealand’s export economy is entering a phase of higher efficiency, supporting long-term valuation.
Economics: The Housing Market Constraints
Economic resilience is visible in the housing sector. Australian data indicates a 7.2% rise in home values since early 2025, driven by supply shortages. This "wealth effect" keeps consumption high, forcing the RBA to stay restrictive. New Zealand’s housing market shows more balanced supply-demand dynamics. This stability allows the RBNZ more flexibility, potentially reducing the risk of a policy error that could devalue the currency.
Forecast: The Path to 0.90
Current projections estimate the NZD/AUD cross will climb toward 0.90 by early 2027 . This forecast assumes a gradual normalization of the interest rate differential. The recovery will likely be non-linear; periods of Australian dollar strength are inevitable if global risk sentiment spikes. However, as the easing cycle proves shallower than feared and the RBA eventually pivots, the fundamental floor for the NZD is expected to rise.
Conclusion: The NZD/AUD is no longer trapped in a one-way bearish trend. Investors should watch the spread between Australian and New Zealand 2-year swap rates as the key indicator for the next leg higher.

Massive Upside Ahead: Top 5 Stocks With Big 2026 Potential📌 Top 5 Stocks for 2026 (Monthly Chart Setups)
I just published a new breakdown focused on multi-month / multi-year moves — not short-term noise. Using the monthly timeframe, I walk through structure + momentum to find the next potential 2x–10x runners.
Names covered:
• NYSE:ZETA – cup & handle developing, holding key MAs + volume shelf, momentum turning
• NYSE:ONTO – monthly reversal structure + bullish momentum setup building
• NYSE:UNH – “left for dead” reset → reclaim + room back to key MAs
• NASDAQ:ONDS – rounded bottom breakout structure, momentum box intact, multi-target roadmap
• NASDAQ:ADBE – extreme oversold reset, bullish reversal potential from long-term support
Question for you:
Which one has the cleanest monthly setup right now — and what ticker should I chart next?

S&P 500 Daily Chart Analysis For Week of Dec 12, 2025Technical Analysis and Outlook:
In the course of the recent weekly trading session, the S&P 500 Index exhibited significant gyrational volatility, reaching a Key Resistance level at 6,895 before retracting to the Major Mean Support level delineated at 6,816.
At present, this market positioning indicates strong potential for continued downward movement, with the primary objective focused on targeting the Mean Support level at 6,755 via heavily traded Mean Support at 6,816.
Nevertheless, it is crucial to recognize that, given current market dynamics, there is a substantial probability of a robust price surge to retest the critical Key Resistance at 6,900, which may be accompanied by a strong rebound to the Outer Index Rally target at 6,945.

Bitcoin(BTC/USD) Daily Chart Analysis For Week of Dec 12, 2025Technical Analysis and Outlook:
During the most recent trading session, the Bitcoin market navigated within a channel defined by the Mean Resistance level at 93,500 and the Mean Support level at 89,300.
Current market sentiment suggests an upward move, with price action pointing to a retest of the Mean Resistance level at 93,500. Additional targets include the Interim Inner Coin Rally at 98,000 and a subsequent, significant objective: the next Interim Coin Rally at 102,500.
Given the prevailing dynamics of the cryptocurrency market, there exists a potential for an intermediate pullback to the Mean Support level of 89,300. This pullback could extend to further Mean Support levels at 86,400 and 82,400, ultimately culminating in the anticipated Outer Coin Dip at 78,500 before a notable upward momentum is expected to occur.

LULU 1D - stretching into a comebackOn the daily chart of Lululemon Athletica (LULU), a clean AB=CD pattern is forming, signaling a potential end to the correction and the beginning of a new upward wave. The price has tested the strong buy zone between 164–167, aligned with a major daily support level and rising volume - a classic setup indicating that buyers are regaining control.
Technically , the structure is highly symmetrical, RSI shows a bullish divergence, and the 50-day moving average is starting to turn upward - all suggesting a possible trend reversal. The first upside target for this pattern is $230, followed by a second target at $340, which corresponds to the 1.272 and 1.618 Fibonacci extensions.
From a fundamental standpoint, Lululemon remains a powerhouse in the premium activewear market, maintaining strong brand loyalty even amid competition from Nike and Alo. The company continues to expand its men’s line and footwear segment, which now accounts for over 25% of total revenue. International growth remains robust, with new stores opening in South Korea, the UAE, and Germany. Lululemon’s shift toward higher-margin online sales and more efficient logistics continues to strengthen its profitability.
In the latest quarterly report (September 2025), revenue grew by 9% year-over-year, and EPS came in above Wall Street expectations. High customer retention - over 90% repeat purchase rate - and stable gross margins create a solid foundation for a mid-term recovery in the stock.
Tactical plan: watch for entries within the 164–167 buy zone, consider partial profit-taking near $230, and target $340 if momentum extends. Just like in yoga, patience and balance lead to the best results.

An Urgent Warning to ALL Traders & InvestorsWhat in the world just happened to the market today? NASDAQ:QQQ AMEX:SPY AMEX:IWM
That’s exactly what we’re breaking down—calmly, logically, and from an investor’s perspective.
In this video, I walk through the major indexes ( NASDAQ:QQQ , AMEX:SPY , and AMEX:IWM ) across multiple timeframes to explain the pullback, what *could* be driving it (macro fears, rates, inflation/GDP concerns), and the two paths the market may take next.
We also cover the VIX spike (but still at relatively low levels), COR3M/market stress, and what I’m seeing in crypto (BTC and ETH) as part of the broader “risk-on/risk-off” puzzle.
The key takeaway: this is a choppy “kangaroo market.” I lay out the bullish bounce scenario vs. the bear structure scenario, and the specific levels that would confirm either direction—so you can stay prepared, not emotional.
Not Financial Advice - DYOR

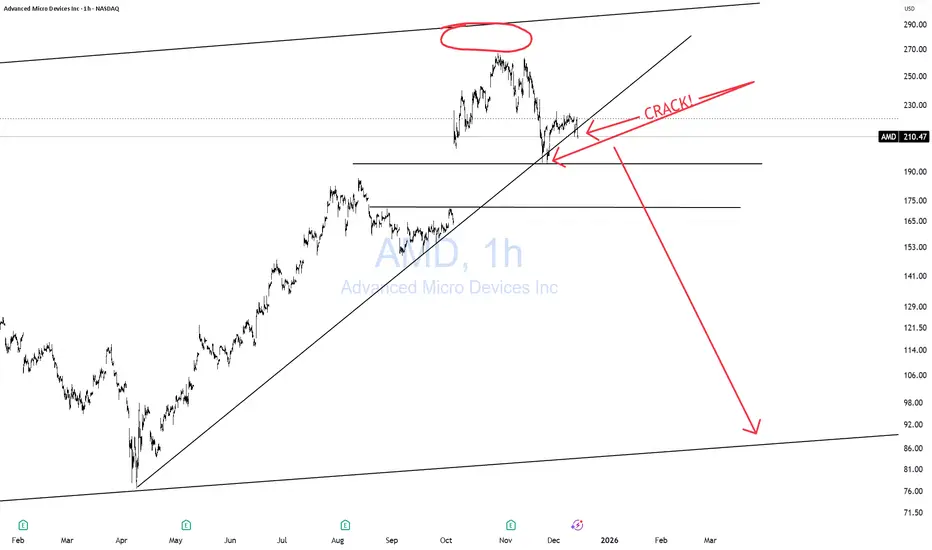
AMD CARCKSSSSAMD has multiple cracks in the uptrend
A big, subtle but powerful void in its last attempt to high the upper trendline. Which is more telling of weaness.
A BIG ARS gap below it.
AMD has already lost -22% from its all-time highs. Likely to lose a lot more.
As I have been warning (GTFO & STFO) here for a while, about the entire market.
CAUTION to the permabulls "Buy The Dip" who have no exit strategy. Remember, no matter where the price goes, it's always 100% from zero! You can't "buy the DIP" unless you "SELL the RIP! That's just simple counting. Nothing Fancy!
THANK YOU for getting me to 5,000 followers! 🙏🔥
Let’s keep climbing.
If you enjoy the work:
👉 Drop a solid comment
Let’s push it to 6,000 and keep building a community grounded in truth, not hype.
AAPL CRACK!AAPL just flashed its first CRACK! of this structure.
AAPL has moved from the upper trendline to the bottom more through time than price.
In my BKC (Bare Knuckle Charting) read, the real tell isn’t the crack… It’s the miss. The previous high couldn’t even tag the upper trendline. That’s subtle, but it’s a big signal of weakening momentum.
Then came the CRACK! at the bottom, confirming it.
Lastly, we have a mini Head & Shoulders formed at the top.
APPL is growing revenues at a rate of 1–2% per quarter, while the stock has been growing at a rate of 5–6% per quarter. That extra 3–4% per quarter is pure multiple & narrative expansion — which is exactly why cracks in charts start to appear.
I urge CAUTION to Bulls!
THANK YOU for getting me to 5,000 followers! 🙏🔥
Let’s keep climbing.
If you enjoy the work:
👉 Drop a solid comment
Let’s push it to 6,000 and keep building a community grounded in truth, not hype.

ORCL - From Erections Come CorrectionsORCL is a textbook example of a setup I call: “From Erections Come Corrections.”
1. It also shows why log charts lie to you on the way down.
When you’re evaluating downside risk, remember: every stock is always 100% away from zero.
A linear chart makes the real danger obvious. I don’t even need to measure this one — the drop is roughly 50% staring you in the face.
2. Look at the speed of that drop.
If you’re one of those heroes trying to squeeze an extra 3% at the top and end up wearing a -50% drawdown because you had no exit plan… that’s not bad luck — that’s greed and negligence teaming up to hand you a bag of sh*t.
3. But if you actually respected risk, took profits, and GTFO/STFO with cash in hand?
Now you get to walk back in as a well-refined gentleman or lady, gracefully to start building a position at at a “500% discount,” as Trump would say.
4. Notice anything magical on my chart?0
No algos. No secret indicators. No fairy-tale narratives. Not even candlesticks. Just plain vanilla price action.
That’s proper charting. Keep it simple.
You chose to play this game, so at least play it right.
Lastly, if the market tanks here, ORCL will just keep tanking as well. BUT! you will be getting in with a 50% discount already. That, my friends, is the difference.
THANK YOU for getting me to 5,000 followers! 🙏🔥
Let’s keep climbing.
If you enjoy the work:
👉 Drop a solid comment
Let’s push it to 6,000 and keep building a community grounded in truth, not hype.

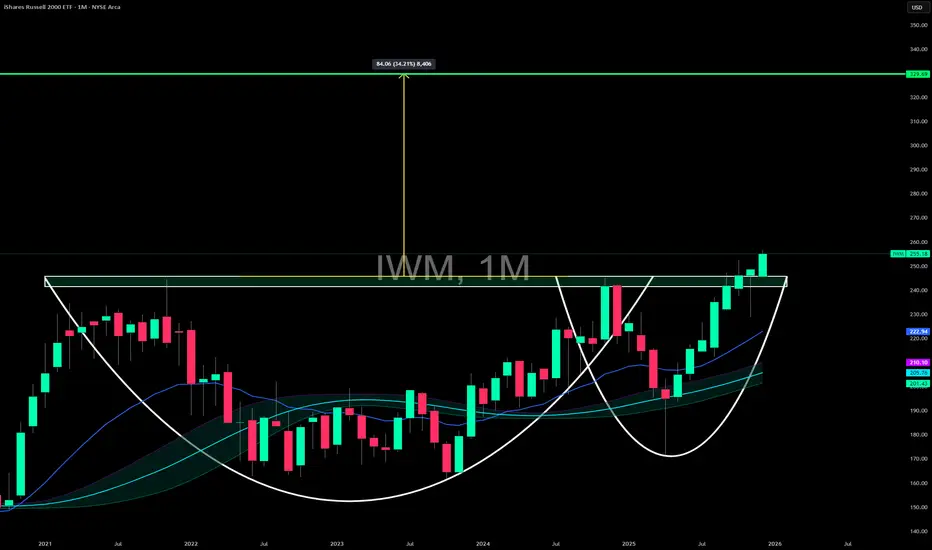
MASSIVE move inbound...🚨 AMEX:IWM is coiling for a MASSIVE move.
We’re breaking out of a 4-year Cup & Handle on the monthly chart—one of the most powerful continuation patterns you can get.
📈 Measured move? ~$330.
Yes… $330.
This checks every box:
• 4 years of underperformance vs. AMEX:SPY and NASDAQ:QQQ
• Small–mid caps are among the most undervalued in the entire market
• Rate cuts are rocket fuel for risk-on segments like AMEX:IWM
• Broad participation = healthier market = Russell strength
This is the breakout I’ve been waiting on.
🔥 Small caps might finally be waking up.
Buckle up.
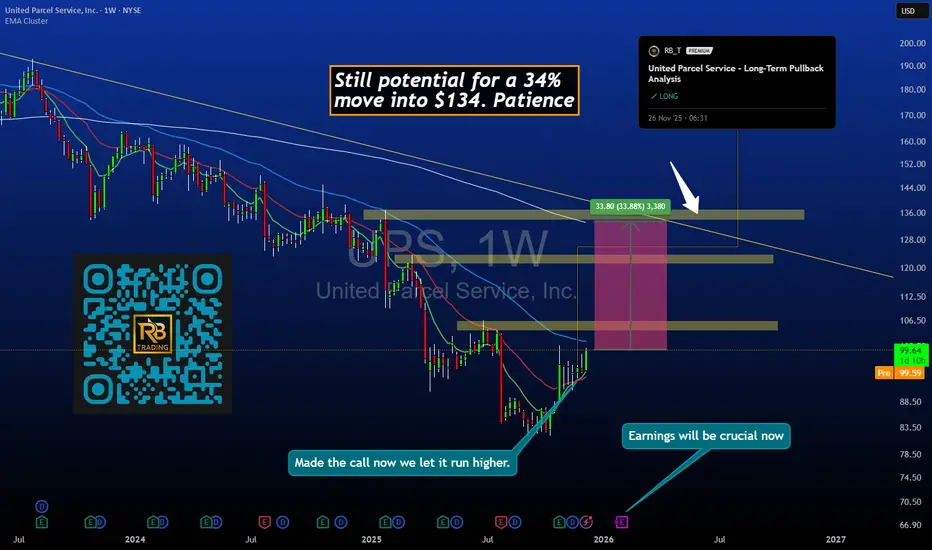
UPS Trade Update ~ +4.2% Since Entry ~ $134 Target IntactOverview
Our November 26 entry on UPS at $95 is performing as expected. Price is now trading near $99 for a gain of +4.2%. More importantly, the structural road map targeting $134 remains fully valid. The move so far represents the early phase of a multi-month recovery, not the completion of the idea.
Original Setup
• Entry: $95
• Stop: $88
• Target: $134
• Time-frame: 3 to 6 months
• Structure: Deep pullback into major demand with multiple confluences including Fibonacci support, high-volume accumulation, and technical exhaustion
• Thesis: Sentiment-driven decline into value created an asymmetric long opportunity
Current Price Action
Since entry, UPS has:
• Respected the $95 demand zone
• Formed higher lows on the daily chart
• Shown early accumulation
• Transitioned momentum from oversold to neutral and improving
The bounce into $99 confirms early strength and aligns with the expected path toward the $110-115 intermediate region.
Why $134 Still Stands
The $134 objective is anchored by:
• Prior structural resistance
• Fibonacci extension alignment
• A clean volume gap between $105 and $134
• Historical acceptance at higher prices
From current levels, the remaining upside is still substantial. This is where the bulk of the idea plays out.
Technical Structure
Daily:
• Higher lows forming
• Price reclaimed 20-day moving average
• Increasing volume on advances
• Momentum indicators recovering
Weekly:
• Major support at $95 held cleanly
• Downtrend break developing
• Structure suggests the corrective phase is ending
Key zones:
• Support: $95-97
• First resistance: $103-105
• Mid-target: $115-118
• Final target: $134
Position Management
For entries at $95:
• Hold the core position as the structure remains fully intact
• Consider scaling at $115-118, then $125-128, then final exits near $134
• Keep the stop at $88 until price clears $105, then break-even becomes optional
• Use weekly swing lows to guide any trailing approach
The goal is to let the multi-month structure play out rather than taking quick profits early.
Psychology Note
Many traders exit too soon because small gains feel rewarding. The entry at $95 required conviction. The hold toward $134 requires patience. Small early moves are confirmation, not completion.
Timeline Outlook
• Weeks 1-2: Early bounce (completed)
• Months 1-2: Move toward 110-115 zone
• Months 3-4: Consolidation and mid-target testing
• Months 4-6: Attempt toward $134
The current action fits this road-map perfectly.
Risk Factors
• A weekly close below $88 invalidates the long thesis
• Broad market weakness could slow progress
• Company-specific events or earnings surprises may affect trajectory
Key Takeaway
UPS is behaving exactly as the original thesis anticipated. +4.2% is early confirmation with far more potential remaining. As long as structure remains intact, the $134 target continues to be the primary objective.
GE Vernova: The $1,000 AI Energy Trade?GE Vernova (GEV) is no longer just a boring industrial spinoff. It has evolved into the primary engine room of the Artificial Intelligence revolution. With shares up 115% in 2025, the market is finally pricing in a new reality: AI needs power, and GE Vernova sells the generator.
The stock closed recently at $625.30. Analysts at JPMorgan now see a path to $1,000. This analysis dissects the multi-domain drivers fueling this aggressive bull case.
Macroeconomics: The AI Power Supercycle
The global economy is entering a "Power Supercycle." The catalyst is no longer just GDP growth; it is compute intensity .
* The Demand Shock: AI data centers are devouring electricity at historic rates.
* The Supply Gap: Renewable energy alone cannot meet this baseload demand 24/7.
* The Winner: This structural imbalance drives orders for GEV’s heavy-duty gas turbines, which provide the dispatchable power that tech giants desperately need.
Financial Models: The Margin Expansion Pivot
Management has successfully engineered a financial turnaround. The story has shifted from "stabilization" to aggressive profitability .
* Revenue Growth: Projections place 2028 revenue at $52 billion.
* Margin Explosion: EBITDA margins are targeting 20% by 2028, a massive leap from the 8-9% seen in 2025.
* Cash Flow Machine: The company expects to generate cumulative free cash flow of $22 billion through 2028. This capital will fund R&D and shareholder returns, solidifying the valuation floor.
Geopolitics & Geostrategy: The Security Premium
GE Vernova is a beneficiary of global disorder. Energy security is now synonymous with national security.
* Europe: The region continues to modernize its grid to decouple from Russian reliance, driving GEV’s electrification backlog.
* Middle East: Strong demand for heavy-duty gas units highlights the region's push to industrialize beyond oil.
* Strategic Asset: GEV’s equipment is critical infrastructure. Governments view the company as a strategic partner in stabilizing volatile energy grids against geopolitical shocks.
Technology & Science: The Decarbonization Bridge
GEV is winning the "pragmatic realism" argument in science. The world cannot switch to 100% green energy overnight.
* Gas as a Bridge: GEV’s gas turbines are highly efficient and hydrogen-ready. They bridge the gap between fossil fuels and a net-zero future.
* Grid Tech: The Electrification segment is deploying High Voltage Direct Current (HVDC) technology. This science allows power to travel longer distances with less loss, crucial for connecting remote renewables to urban data centers.
Cyber & Innovation: The Digital Fortress
Modern grids are digital, making them vulnerable to cyber warfare. GE Vernova is pivoting to sell resilience .
* Grid Defense: New orders include software-defined grid management tools.
* High-Tech Defense: GEV integrates cybersecurity directly into its turbine control systems. This "secure-by-design" approach allows them to charge a premium to utility customers facing rising state-sponsored cyber threats.
Conclusion: A $1,000 Reality?
The path to $1,000 is not built on hype. It is built on a $42 billion revenue outlook and a 20% margin profile. As the world scrambles to power its AI future, GE Vernova stands as the indispensable infrastructure play of the decade.
> Key Takeaway: Do not view GEV as a legacy industrial stock. View it as a tech-enabler . Without GEV’s turbines and grids, the AI revolution stays offline.

Ethereum - 4H Structure Call Playing Out, Daily Breakout.Ethereum Technical Breakout: 4-Hour Setup from December 8th Now Validated on Daily Chart
Our December 8th technical call on Ethereum based on 4-hour chart structure has materialized into a clean daily timeframe breakout. This analysis reviews the original setup, examines the price action that followed, and assesses the current structural picture as ETH pushes into higher territory with confirmed momentum.
🎯 Original Setup Recap (December 8th):
What We Identified:
On the 4-hour chart, Ethereum was showing:
Consolidation after a pullback to key support
Higher lows forming during the correction phase
Volume compression indicating accumulation
Momentum indicators resetting from overbought conditions
Critical support holding at structural levels
The Call:
Long position anticipation based on 4-hour structure suggesting the correction was nearing completion and continuation was probable. The setup offered defined risk below support with upside targets at previous resistance zones.
Why It Mattered:
The 4-hour timeframe captures intraday structure while filtering out noise from lower timeframes. When 4H patterns align with broader trend direction, they often precede significant multi-day moves that eventually appear on daily charts.
📈 What Happened Next:
Price Action Validation:
Following the December 8th structural read, Ethereum:
Held the identified support zone without breaking down
Began forming higher highs and higher lows on the 4-hour chart
Broke above intermediate resistance levels with increasing volume
Momentum indicators shifted from neutral to bullish
Daily chart structure began reflecting the 4H anticipation
The Breakout:
What started as a 4-hour setup has now translated into a clean daily chart breakout. This progression from lower timeframe structure to higher timeframe confirmation is textbook technical development - the 4H provided the early signal, the daily now provides the broader validation.
📊 Daily Chart Breakdown:
Current Structure:
Switching to the daily timeframe reveals:
Clean breakout above resistance: Previous consolidation highs have been cleared decisively
Volume confirmation: Breakout occurred with expansion in volume, not on declining participation
Momentum shift: Daily momentum oscillators flipping bullish after extended reset period
No immediate overhead resistance: Path to next major level is relatively clear
Why Daily Matters:
When a 4-hour setup evolves into a daily breakout:
Institutional participation typically increases (larger players operate on daily+ timeframes)
The move gains credibility beyond short-term speculation
Probability of continuation increases as higher timeframe traders enter
Support levels become more significant (daily structure holds better than intraday)
Key Observations:
Breakout candle characteristics: Strong close, minimal upper wick, suggesting buying conviction
Support conversion: Previous resistance now becomes support if price retests
Trend alignment: Daily now confirms what 4H structure was telegraphing weeks ago
🎯 From 4-Hour Call to Daily Confirmation:
The Progression:
December 8th (4H): Structural setup identified - accumulation phase near support
Initial Response: Price respected support, began building higher lows
Intermediate Action: 4H breakout triggered, resistance levels tested
Current State: Daily chart validates with clean breakout above consolidation
Why This Sequence Matters:
This is how professional technical analysis works:
Lower timeframes provide early positioning opportunities
Risk is defined based on structure (not arbitrary stops)
Higher timeframes eventually confirm or reject the thesis
Confirmation on daily adds conviction for position management
Key Lesson:
The 4-hour chart gave entry opportunity with tight risk. The daily chart now provides the validation that the trade thesis was correct. Traders who entered on 4H structure now have daily confirmation supporting continued upside.
📈 What the Daily Breakout Suggests:
Bullish Implications:
Next resistance target: Previous cycle highs now become the next logical objective
Momentum continuation: Daily breakout with momentum often sustains for multiple sessions
Support buffer: If price retraces, the breakout level should provide support
Trend clarity: Daily chart removes ambiguity - structure is now clearly bullish
Fibonacci Extensions:
From the correction low to breakout high, Fibonacci extension targets suggest:
1.272 extension: First projected resistance
1.618 extension: Major target zone where profit-taking typically occurs
2.0 extension: Extended target if momentum remains strong
These aren't guarantees but mathematical projections based on the measured move from consolidation.
🧠 Psychology of Early Entry vs. Breakout Chasing:
December 8th Entry (4H Structure):
Entry felt uncomfortable (price had just pulled back)
Risk was defined and relatively tight
Reward-to-risk was favorable (3:1 or better to first targets)
Required patience through consolidation period
Chasing Now (Post-Daily Breakout):
Entry feels "safer" (price is rising, daily confirms)
Risk has expanded significantly (stop would be much wider)
Reward has compressed (already moved toward targets)
Late entry often leads to getting shaken out on first retracement
The Professional Approach:
Buy structure on 4H when risk is defined. Use daily confirmation to hold position or add selectively, not to initiate at worse risk/reward.
📊 Current Trade Management Framework:
For Those In From December 8th:
Profit Taking Strategy:
First reduction: At previous major resistance (book partial profits)
Second reduction: At Fibonacci 1.618 extension (lock gains)
Final portion: Trailing stop or 2.0 extension (maximize upside)
Stop Management:
Move stops to breakeven after daily breakout confirmed
Trail stops below daily swing lows as new structure forms
Give daily structure room - don't tighten stops based on 4H noise
Position Psychology:
Daily confirmation means the trade thesis was correct. Avoid the temptation to overtrade or add aggressively here. The best risk/reward was on December 8th current management is about optimization, not aggressive scaling.
📅 What's Next?
Bullish Scenario:
Daily breakout continues with momentum
Price targets Fibonacci extensions sequentially
Minor retracements find support at breakout level
Volume remains elevated on green candles, diminishes on red
Retest Scenario:
Price pulls back to test breakout level as new support
This would be healthy consolidation, not failure
4H chart may provide re-entry or add opportunity
Daily structure remains intact unless breakout level fails
Invalidation:
Daily close back below breakout level
Volume deterioration suggesting exhaustion
Momentum divergence appearing on daily chart
Fundamental shifts in crypto market conditions
⚠️ Risk Considerations:
What Could Go Wrong:
Crypto Volatility:
Ethereum can experience 10-20% pullbacks even during bullish trends. Daily breakouts don't eliminate volatility - they suggest directional bias but not linear price action.
Market-Wide Weakness:
If Bitcoin enters correction or broader crypto sentiment shifts negative, individual coin technicals become secondary to market-wide flows.
False Breakout:
Daily breakouts can fail. If price closes back below the breakout level with volume, the technical picture changes and positions should be reassessed.
Regulatory/Fundamental Events:
Crypto markets remain sensitive to regulatory news, exchange issues, and macroeconomic factors that can override technical structure.
🏆 Key Trading Lessons from This Setup:
✅ Lower timeframes identify structure early: The 4H chart provided the early read when risk was defined
✅ Higher timeframes provide confirmation: Daily breakout validates the 4H thesis was correct
✅ Best entries feel uncomfortable: December 8th near support felt uncertain - that's when risk/reward was optimal
✅ Structure over emotion: The technical setup suggested bullish resolution despite uncertainty
✅ Patience pays: Allowing the 4H structure time to develop into daily confirmation requires discipline
✅ Manage, don't chase: Use daily confirmation for position management, not aggressive late entries
📌 Summary:
Then (December 8th):
4-hour chart showing structural setup
Support holding, accumulation visible
Entry opportunity with defined risk
Now (Current):
Daily chart confirms with clean breakout
Momentum supporting continued upside
Original thesis validated by higher timeframe
Next:
Monitor daily structure for continuation
Manage positions based on daily swing points
Watch for retest of breakout as potential support
⚠️ Important Disclaimers:
This analysis is for educational purposes and reflects a technical progression from 4-hour structure to daily confirmation. It is not financial advice or a recommendation to buy or sell Ethereum or any cryptocurrency.
Cryptocurrencies are highly volatile and speculative. Daily breakouts can fail, and past performance of similar setups does not guarantee future results. The December 8th call was based on structure visible at that time - subsequent price action could have invalidated the thesis.
Ethereum carries specific risks including regulatory uncertainty, technological vulnerabilities, market manipulation, and extreme volatility. Position sizing must account for potential 20-30% drawdowns even during bullish trends.
This review examines what happened after a technical call, not a prediction of future price movement. Markets change, structure fails, and no technical pattern guarantees success.
Always conduct independent research, manage risk appropriately, and never invest more than you can afford to lose. All cryptocurrency trading involves substantial risk of loss.
✨ Community Discussion:
Did you catch the December 8th setup on the 4H chart? How do you use multi-timeframe analysis in your trading? Share your approach to transitioning from lower to higher timeframe confirmation.
📜 Read the structure. Trust the process. Manage the risk.

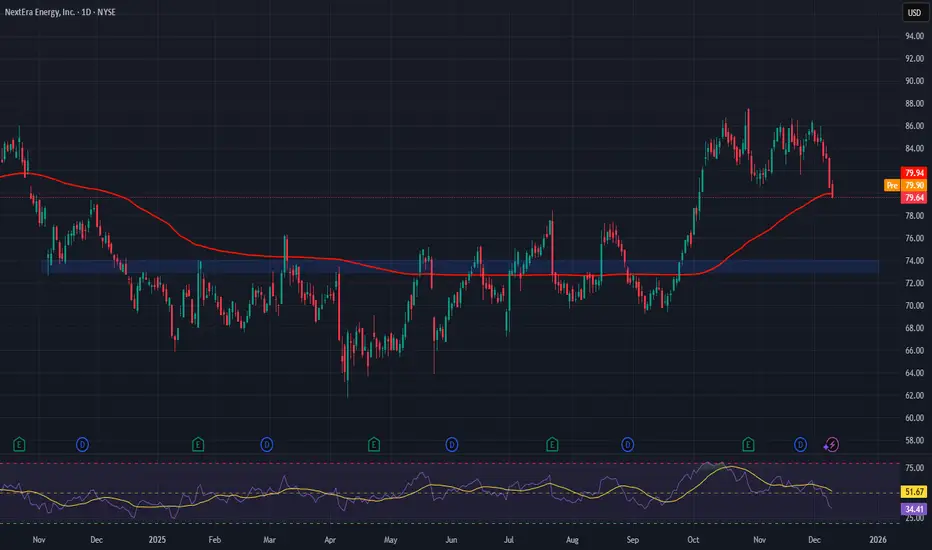
NextEra Energy (NEE) — Clean Power Scale for the AI GridCompany Overview
NextEra Energy NYSE:NEE is the world’s largest clean-energy utility, with leadership across wind, solar, nuclear, storage, and grid infrastructure—a core enabler of the accelerating clean power transition.
Key Catalysts
AI-Powered Demand: Hyperscalers (e.g., Google) are signing long-term carbon-free PPAs, making NEE a top supplier to data centers & cloud growth.
Pipeline Expansion: 3.2 GW added in Q2’25, including 1+ GW for hyperscalers, reinforcing first-mover scale in renewables and storage.
Capex Visibility: $74.6B plan through 2029 for grid upgrades, batteries, and renewable capacity, supporting multiyear rate base and EPS growth.
Reliability + Cost Curve: Scale, operational discipline, and declining LCOE sustain moat in clean generation and grid services.
Why It Wins
Direct exposure to the AI electricity boom
Largest U.S. renewables fleet + storage integration
Structural tailwinds from electrification & policy support
Investment Outlook
Bullish above: $73–$74
Target: $120–$122 — driven by hyperscaler demand, an expanding project backlog, and high-confidence capex deployment.
📌 NEE — powering the AI era with the world’s premier clean-energy platform.
NQ Levels 12/92/2025 PT 25,963Pretty simple setup here. Look for your structure to combat the noise intraday and overnight. I'm long here.

Devon Energy 2025: Is the "Old Oil" Giant a Secret Tech Play?Devon Energy (DVN) presents a paradox in late 2025. While five-year investors enjoy triple-digit returns, recent entrants have watched the stock decouple from crude prices. But analyzing Devon through a simple "oil price" lens misses the structural transformation occurring beneath the surface.
M&A & Industry Trends: The Williston Fortress
Devon’s $5 billion acquisition of Grayson Mill Energy was not just about adding barrels; it was a defensive consolidation maneuver. By securing 307,000 net acres in the Williston Basin, Devon effectively locked down the premier remaining inventory in North Dakota.
* Scale: The deal cements Devon as a top-4 producer in the basin, adding 100,000 barrels per day.
* Strategy: This acquisition allows Devon to prioritize "short-cycle" cash flow over risky exploration, funding its massive shareholder return program.
Technology & Science: The AI Power Pivot
The most underreported catalyst for Devon is its aggressive entry into next-gen geothermal energy . Through its strategic partnership with Fervo Energy, Devon is deploying its drilling expertise to solve the AI industry’s biggest bottleneck: 24/7 clean power.
* The Cape Station Project: Located in Utah, this project utilizes Devon’s horizontal drilling patents to create geothermal reservoirs capable of powering hyperscale data centers.
* Innovation Culture: Devon’s internal "Innovate Challenge" operates like a corporate Shark Tank, actively soliciting employee patents for AI-driven drilling optimization.
Geopolitics & Geostrategy: The Trans-Atlantic Bridge
Devon has elevated its business model from selling molecules to selling national security . The 2025 operational landscape sees Devon executing on long-term LNG supply agreements, such as its deal with Centrica, the UK's energy giant.
* Energy Security: By linking US shale gas directly to European grids, Devon insulates itself from domestic Henry Hub price volatility while acting as a geopolitical hedge against Russian energy blackmail.
Macroeconomics & Financial Models: The Buyback Shift
In 2022, Devon was famous for its "variable dividend." In 2025, the strategy has matured. Management is now prioritizing share repurchases over variable payouts, signaling they believe the stock is undervalued.
* The Logic: With free cash flow yields hovering near 9%—double that of the S&P 500—repurchasing shares is mathematically more accretive than cash payouts.
* Balance Sheet: Proceeds from the Grayson Mill integration are also targeting debt reduction, creating a "fortress balance sheet" capable of weathering sub-$70 oil.
Cyber & Patent Analysis: The Digital Oilfield
Devon’s patent portfolio in 2025 reflects a shift toward Operational Technology (OT) defense and environmental surveillance.
* Methane Detection: New patents cover automated dump valve systems and drone-based leak detection, crucial for meeting 2025 EPA methane standards.
* Cyber Resilience: As operations become automated, Devon has increased investment in protecting its SCADA systems from state-sponsored cyber threats, treating data integrity as a tier-one safety metric.
Conclusion: A Strategic Infrastructure Play
Devon Energy is no longer just a proxy for WTI crude. It is a diversified infrastructure company feeding the two hungriest markets of the next decade: European energy security and AI data centers.
Key Takeaway: Investors looking at the lack of variable dividends in 2025 are missing the bigger picture. Devon is reinvesting in a tech-enabled moat that offers growth beyond the price of a barrel of oil.

I don't own enough!I don't own enough of NYSE:ZETA even with my massive 15-20% holding across my investment portfolios and leaps galore.
The fundamentals scream buy anything under $25-$30, while the stock sits at sub-$20.
P/S less than 3, DCF model spitting out massive Margin of Safety based on conservative projections, and they are about to report their first GAAP profitable quarter.
Never mind the chart that looks ready to have a blow-off top moment, friends absolutely.
Cup and Handle is ready to send us to new ATHs in 2026, from the looks of it.
This is a top-2 position for me, and I've personally met and interviewed the CEO, but I have no ties to the business beyond being a retail shareholder.
So take what I say as you may, and always DYOR, friends.
Not Financial Advice.
God bless!

S&P 500 Daily Chart Analysis For Week of Dec 5, 2025Technical Analysis and Outlook:
In the recent weekly trading session, the S&P 500 Index recorded significant gains, achieving our primary target at the Key Resistance level of 6,895. Presently, this market position indicates potential downward movement, with the primary target set at Mean Support at 6,816, and the possibility of further decline to Mean Support at 6,755.
Nevertheless, it is essential to acknowledge that, in light of the current market dynamics, there exists a considerable probability of a repeat retracement from the Key Resistance at 6,895, accompanied by a robust bounce from Mean Support at 6,816.

EUR/USD Daily Chart Analysis For Week of Dec 5, 2025Technical Analysis and Outlook:
In the most recent trading session, the Eurodollar currency rose sharply, reaching the Mean Resistance level at 1.167. Current market conditions indicate that the price may pull back to the critical Mean Support level at 1.160.
It is also crucial to monitor the breakout levels for this currency. On the upside, there is potential for a rise to the Mean Resistance at 1.167 once again and possibly extending to 1.175. Conversely, on the downside, a breakout could take it to the Mean Support at 1.160, with the possibility of retesting the completed Outer Currency Dip at 1.148.

Bitcoin(BTC/USD) Daily Chart Analysis For Week of Dec 5, 2025Technical Analysis and Outlook:
In the most recent trading session, the Bitcoin market experienced a Pump-and-Dump scenario and continued the downward trend observed over the past week. The price has reached the Mean Resistance level of 93,500.
Market sentiment is declining, with current price action focusing on identifying the Mean Support level at 88,000. Additional support is identified at 84,500, with a further significant drop possible to the Outer Coin Dip at 78,500.
Given the current dynamics of the crypto market, there is potential for an intermediate rebound from the Mean Support level of 88,000 back up to the Mean Resistance level of 93,500. Furthermore, an external extension may target the Interm Inner Coin Rally at 98,000.

We would buy quite a lot of NATGAS when $2 levels are reachedWe hope the price will go down so we can buy cheaper
