ADM 1W - Bulls back in the field Weekly chart shows ADM breaking through the long-term trendline and holding above the support zone - a clean breakout + retest setup.
EMAs are stacked below the price, confirming bullish control. RSI remains healthy, leaving room for continuation.
✅ Support zone: 55–60
🎯 Target 1: 80
🎯 Target 2: 98.8
As long as price holds above the 60 level, momentum may continue toward the next resistance around 80, and eventually to 98.8.
Fundamentally , ADM stays strong in the agricultural and food supply chain - from grain processing to biofuels - sectors that remain essential regardless of market cycles.
In short: bulls are planting seeds for a solid harvest 🌾📈
Investing

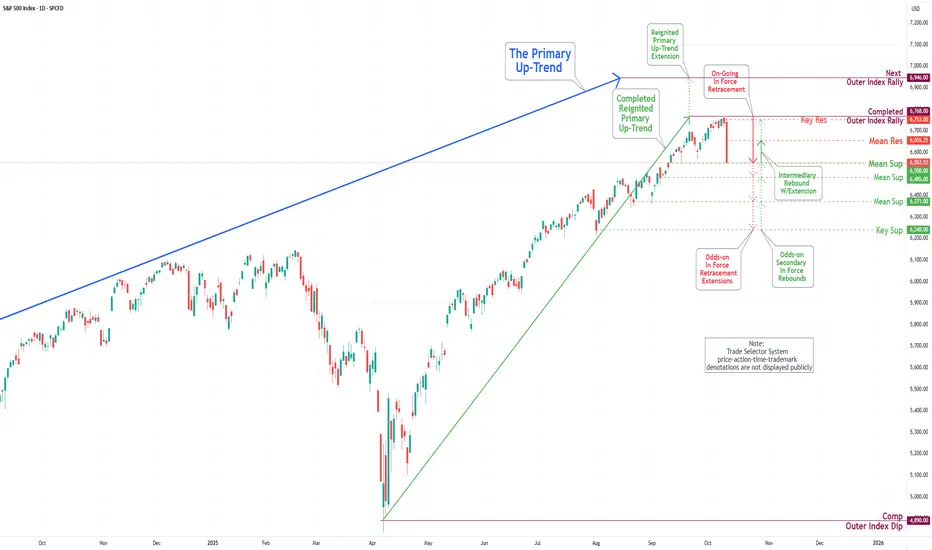
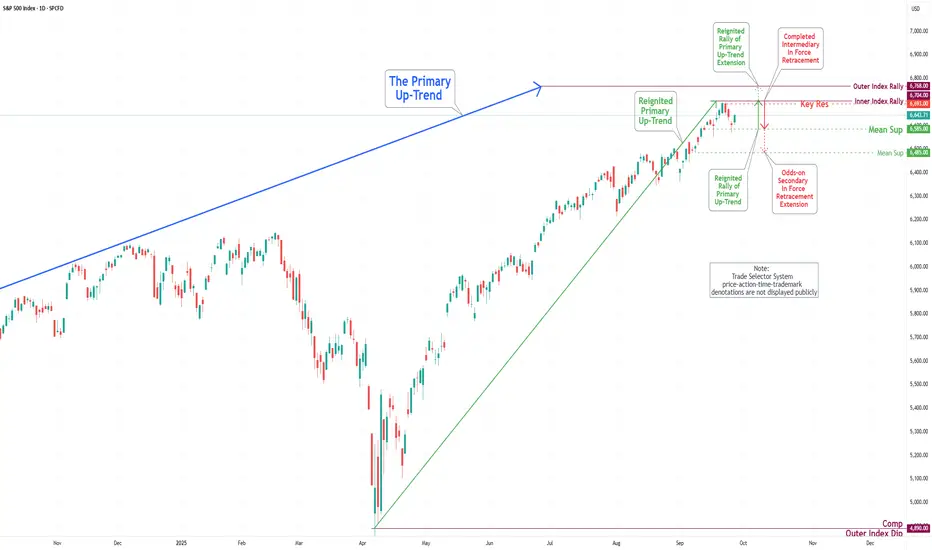
S&P 500 Daily Chart Analysis For Week of Oct 10, 2025Technical Analysis and Outlook:
During the previous week's trading session, the S&P 500 Index experienced a notable decline in price activity after reaching the Key Resistance level of 6750 and the Outer Index Rally at 6946.
At present, the index is positioned just above the newly established Mean Support level of 6550, which indicates the potential for further downward momentum. This trend could extend to subsequent Mean Support levels of 6485, 6371, and the Key Support level at 6240.
It is imperative to recognize that the index may exhibit a strong rebound following its price contact at the Mean Support level of 6550. Furthermore, there exists the possibility of an upward extension that could reach the Key Resistance target of 6753.
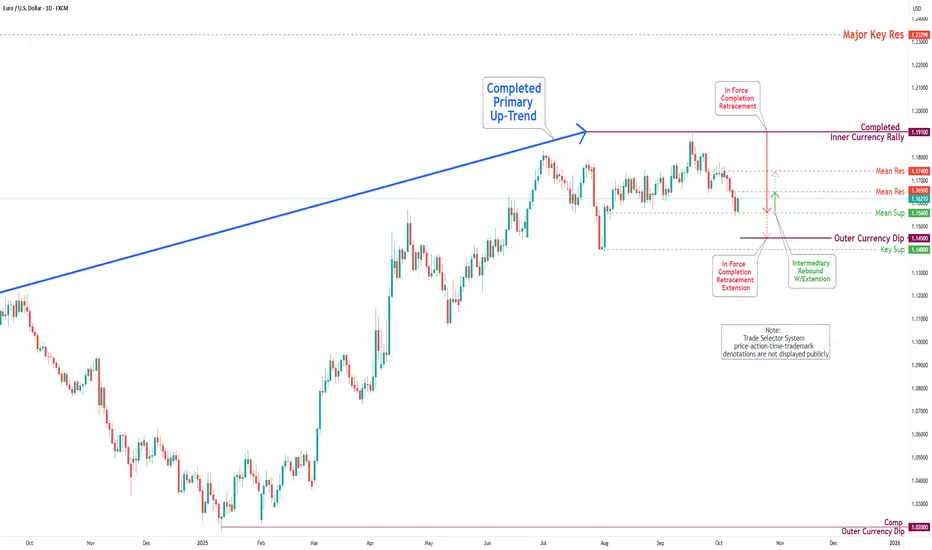
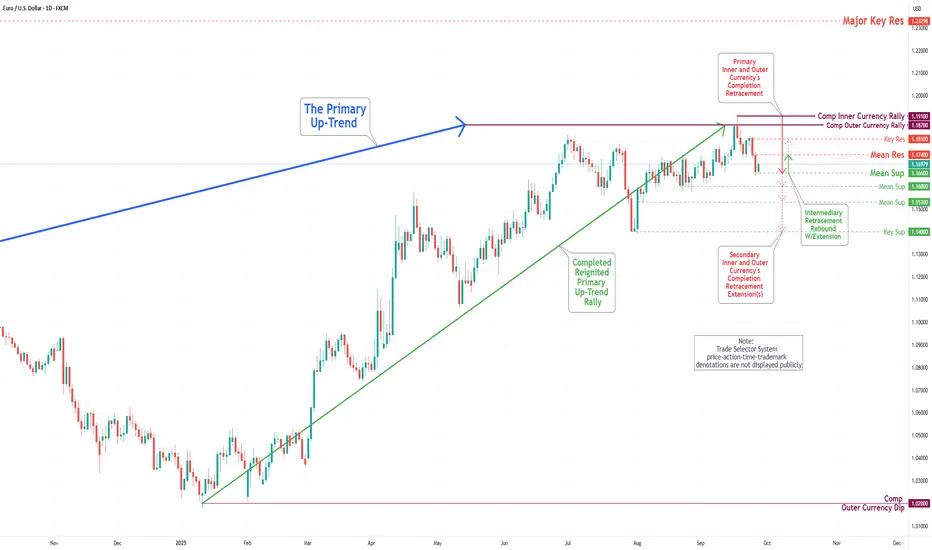
EUR/USD Daily Chart Analysis For Week of Oct 10, 2025Technical Analysis and Outlook:
During the trading session of the previous week, the Euro exhibited considerable volatility, initially declining to approximately the Mean Support level of 1.153 before experiencing a substantial upward reversal. Current market indicators suggest that this bullish trend may persist, with particular emphasis on the Mean Resistance level identified at 1.165, which could lead to an ascent toward the secondary Mean Resistance at 1.174.
Conversely, recent price movements may indicate a reversal, leading to a decline toward the Mean Support level of 1.156, which could complete the Outer Currency Dip at 1.145. Should this downward trajectory continue, it may extend further to the Key Support level of 1.140.
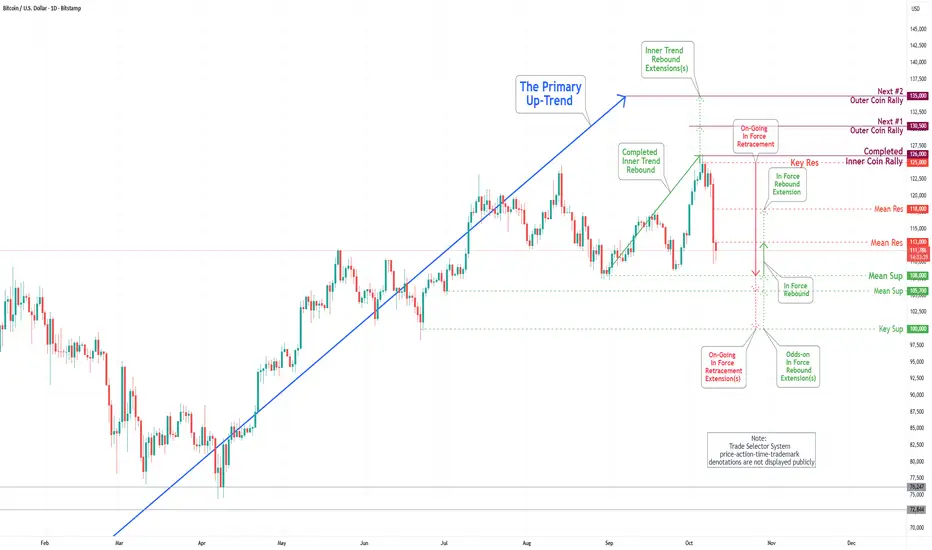
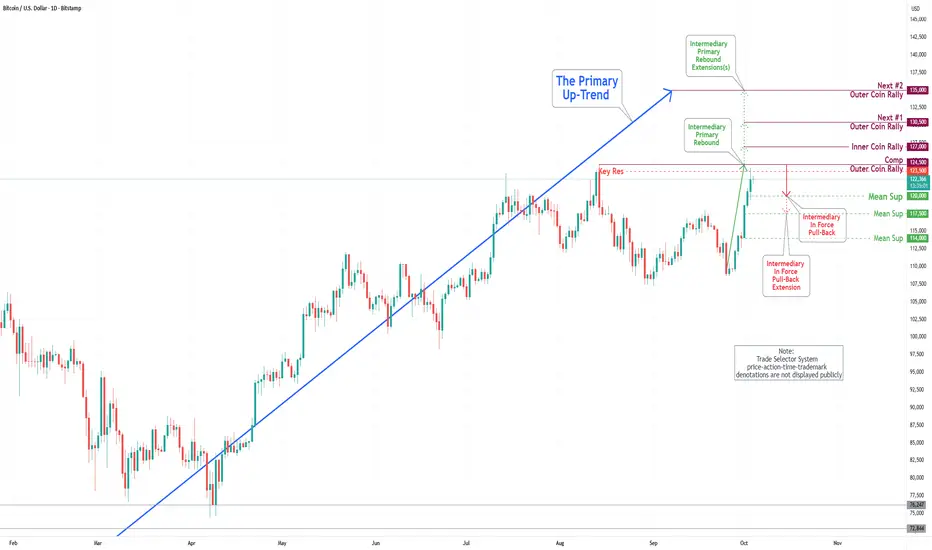
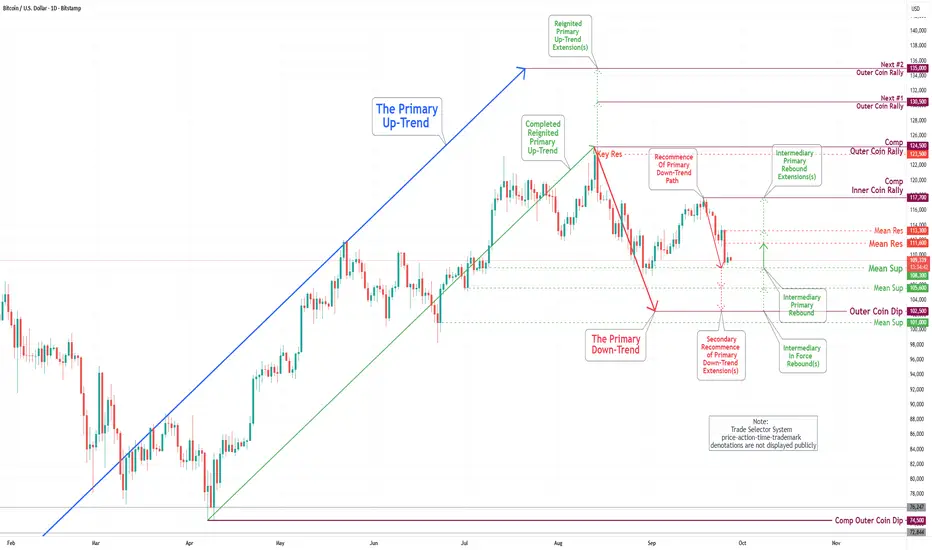
Bitcoin(BTC/USD) Daily Chart Analysis For Week of Oct 10, 2025Technical Analysis and Outlook:
During the most recent trading session, the Bitcoin market experienced a notable decline, falling below significant support levels of 120000, 117500, and 114000, respectively. Current market analysis indicates an initial potential retracement toward the Mean Support level of 108000, with further extension possibilities to the Mean Support level of 105700 and the Key Support level of 100000. It is crucial to acknowledge that intermediary rebounds may occur at these defined levels, particularly at the Mean Resistance level of 113000.
Wayfair (W) — Omnichannel Fuels ComebackCompany Overview:
Wayfair Inc. $W is a leading online retailer focused on home furnishings, décor, and furniture. With a tech-forward approach and efficient logistics, it delivers a premium customer experience while expanding into physical retail to blend scale with showroom appeal.
Key Catalysts:
🛋️ Q2 2025 Turnaround
Net revenue: $3.3B (+5% YoY)
Adjusted EBITDA margin: 6.3%, highest since 2021
Generated $230M in free cash flow, signaling operational strength
🏬 Retail Expansion
Launch of Perigold luxury showroom in Houston
New flagship Denver store bridges online and offline presence
Strengthens brand equity and engages tactile shoppers
📦 Operational Discipline
Despite 4.5% decline in active customers, Wayfair grew margins
Focused on higher order values and cost efficiency amid macro headwinds
Investment Outlook:
Bullish above: $72–$74
Upside target: $140–$145, supported by margin gains, omnichannel growth, and consumer demand rebound
#W #Wayfair #RetailStocks #Ecommerce #HomeFurnishings #Omnichannel #TechRetail #Investing

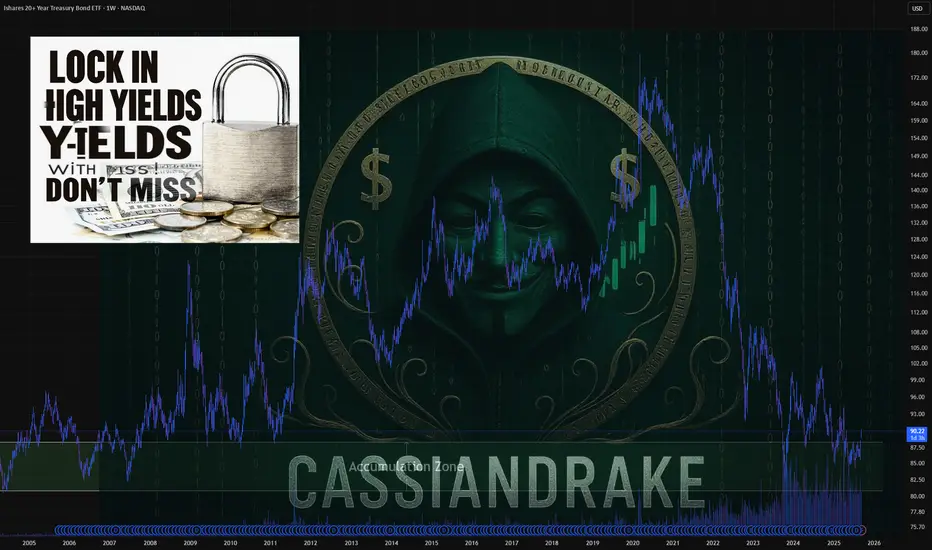
Why Now is the Best Time to Load Up on T-BillsIn 2025, investors have a unique opportunity to capitalize on high yields from Treasury Bills (T-Bills) as interest rates hover at their highest levels in years. With indications that the Federal Reserve may soon start cutting rates, now could be the ideal time to invest in T-Bills through the TLT ETF. This article explores why investing in T-Bills now could reap significant returns over the next decade.
Key Points:
Highest Interest Rates in Years:
Current interest rates on T-Bills are elevated, offering attractive yields for investors.
Historical data shows that such high yield opportunities are rare and may not be seen again for years.
Federal Reserve Rate Cut Expectations:
The Federal Reserve has signaled potential rate cuts due to concerns about job market stability and inflation trends.
Market expectations suggest that rate cuts may begin later in 2025, which could reduce yields on T-Bills in the future.
Strategic Advantage of T-Bills:
Investing now allows investors to lock in current high yields before potential rate cuts reduce returns.
T-Bills offer a safe investment with guaranteed returns, backed by the U.S. government, making them a low-risk option.
Why TLT ETF?
The TLT ETF provides exposure to long-term Treasury securities, making it an excellent vehicle for capitalizing on current high yields.
The advantages of using an ETF include ease of trading and diversification.
Conclusion:
With interest rates at a peak and expectations of future rate cuts, now is a strategic time to invest in T-Bills via the TLT ETF. By taking advantage of the current high yields, investors can secure returns that may not be available again for years to come.
TVC:DXY NASDAQ:MSTR TVC:GOLD TVC:SILVER BITSTAMP:BTCUSD $VNIDIA NASDAQ:TSLA VANTAGE:SP500
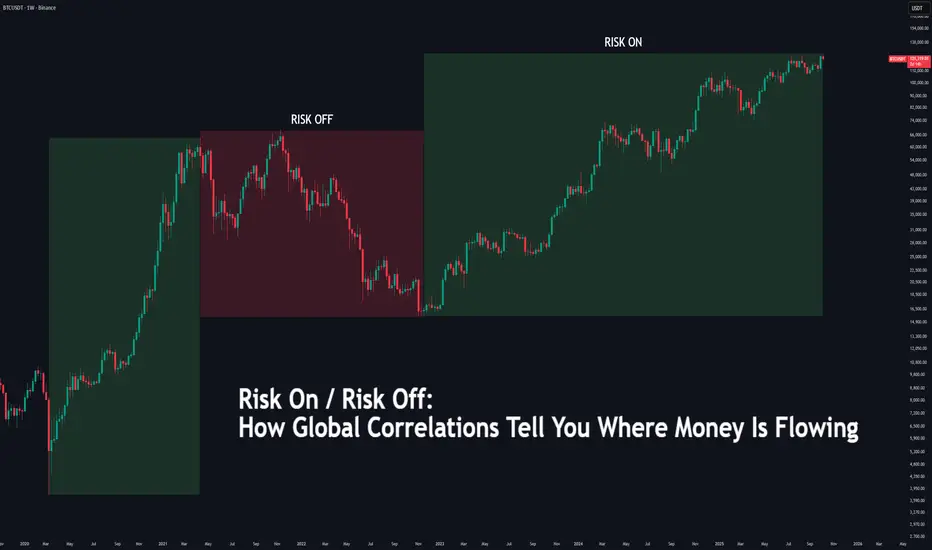
Risk On/Off: How Global Correlations Tell You Money Flow🔵 Risk On / Risk Off: How Global Correlations Tell You Where Money Is Flowing
Difficulty: 🐳🐳🐳🐋🐋 (Intermediate+)
This article is for traders who want to understand how global capital flow affects market behavior — from equities and crypto to gold and bonds. Learning to read “Risk On” and “Risk Off” regimes helps you anticipate big shifts before they hit your chart.
🔵 INTRODUCTION
Markets are not independent islands — they are connected by one universal force: liquidity flow .
When investors feel confident, they move capital into riskier assets like stocks and crypto — this is called Risk On .
When fear dominates, capital flows back into safety — bonds, gold, and the U.S. dollar — known as Risk Off .
Recognizing this rotation allows traders to align their bias with the flow of global capital rather than fighting it.
🔵 WHAT IS “RISK ON”
Risk On is a market environment where investors seek higher returns, volatility is subdued, and capital flows into assets with greater reward potential.
Typical Risk-On behavior:
S&P 500, Nasdaq, and other equities trend higher
Bitcoin and crypto assets outperform traditional markets
U.S. Dollar Index (DXY) weakens as money moves abroad
Bond yields rise moderately as investors leave safe assets
Gold often consolidates or declines
In simple terms: Money chases opportunity.
🔵 WHAT IS “RISK OFF”
Risk Off describes defensive conditions — fear rises, volatility expands, and liquidity seeks safety.
Typical Risk-Off behavior:
S&P 500 and risk assets decline
Bitcoin and altcoins drop sharply
DXY strengthens as investors move into USD
Bond yields fall as money enters treasuries
Gold rallies as a safe-haven hedge
In simple terms: Money runs to safety.
🔵 HOW TO DETECT RISK SHIFTS
Market regimes don’t flip instantly — they rotate through correlated behavior.
To identify the shift between Risk On and Risk Off, monitor key macro instruments together:
DXY (Dollar Index): Rising DXY = Risk Off sentiment, Falling DXY = Risk On.
SPX / NASDAQ: Strong uptrends = Risk On, persistent weakness = Risk Off.
BTC vs DXY: Inverse correlation; BTC strength with DXY weakness = liquidity expansion.
Bond Yields (US10Y): Rising = optimism, Falling = risk aversion.
VIX Index: Below 15 = complacent Risk On, Above 25 = fearful Risk Off.
🔵 THE GLOBAL LIQUIDITY CYCLE
Liquidity always moves in phases — expansion, acceleration, contraction, and reset.
Phase 1 – Liquidity Expansion: Central banks inject liquidity → Risk On begins.
Phase 2 – Overextension: Assets rally strongly, leverage increases, volatility stays low.
Phase 3 – Liquidity Contraction: Monetary tightening or policy shocks trigger Risk Off.
Phase 4 – Repricing & Reset: Markets bottom as new liquidity returns.
Understanding this rhythm helps traders avoid confusion when markets seem “irrational” — because they’re not, they’re simply rotating through the liquidity cycle.
🔵 USING RISK ON/OFF IN TRADING
Even technical traders benefit from recognizing global risk regimes.
By aligning with the dominant liquidity direction, setups gain higher probability.
Crypto traders: Use SPX, DXY, and VIX correlations to confirm momentum.
Stock traders: Track gold and yields to gauge investor confidence.
Forex traders: Trade USD pairs according to global sentiment.
Swing traders: Filter trade bias by checking the current global regime.
Tip: When correlations align (e.g., DXY up, SPX down, BTC down), expect trend continuation.
When they diverge, volatility or reversals are likely.
🔵 ADVANCED TOOLS TO WATCH
Global Liquidity Index: Track combined balance sheets of the Fed, ECB, BOJ, and PBC.
Stablecoin Supply (Crypto): Expanding supply = liquidity entering market.
Yield Curve (10Y–2Y spread): Falling = caution, Rising = recovery.
Funding Rates: Confirm risk sentiment via leverage buildup.
🔵 CONCLUSION
All markets are connected through liquidity.
Risk On and Risk Off regimes describe how that liquidity rotates between return and safety. By tracking global correlations — equities, bonds, gold, DXY, and crypto — traders gain a powerful macro filter to stay on the right side of momentum.
Liquidity creates direction. Correlation confirms conviction.
If you learn to read the global flow, your technical analysis will finally make sense in the bigger picture.
Do you track global correlations in your analysis? What’s your favorite Risk-On or Risk-Off indicator?
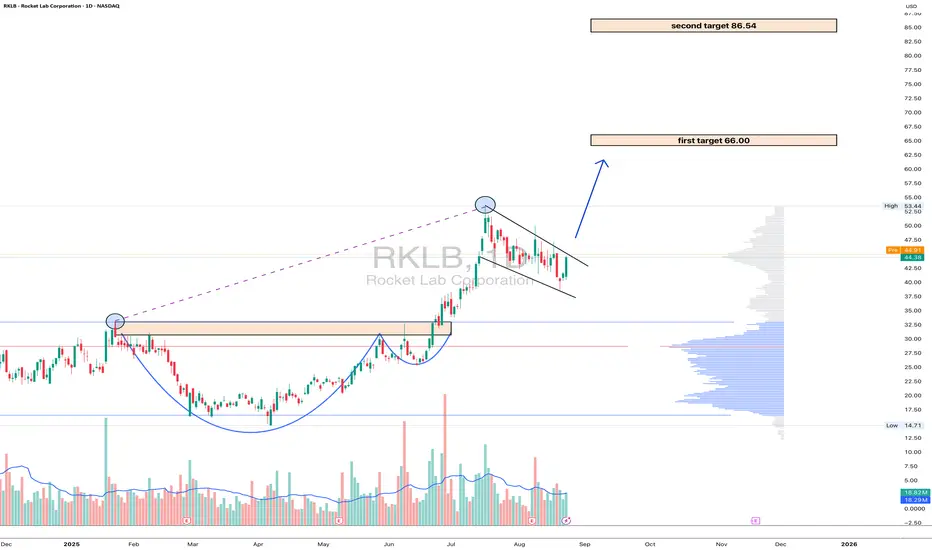
RKLB: the rocket is fueled and ready for orbitOn the daily chart of Rocket Lab (RKLB) , the price is trading at $44.38 after a confident breakout above key consolidation zones. Technically , the break of the $40 level confirmed the strength of the bulls and solidified the upward structure. The next target is $66 - a strong resistance aligned with the Fibo extension and if momentum holds, the market could extend toward $86.54, where long-term levels converge. EMA indicators remain below the price, reinforcing the bullish outlook.
Fundamentally , Rocket Lab stands as a leader in the small-launch vehicle sector, strengthened by contracts with NASA and consistent commercial demand. Amid growing interest in the aerospace industry and rising competition with SpaceX, the company benefits from diversified revenue streams and steady launch schedules. On the geopolitical side, increased defense programs in the U.S. and allied nations provide additional long-term support.
Tactically , the zone above $40 now acts as a support: as long as price holds above it, the bullish scenario remains intact. Targets are set at $66 and $86.54. Short-term corrections are possible if the market overheats, but the broader structure points upward, with institutional flows suggesting accumulation.
If this scenario plays out, Rocket Lab won’t just launch satellites - it’ll launch portfolios into orbit.
LZ 1D: Legal move to the upside?On the daily chart, LegalZoom broke out of a falling wedge and perfectly retested the breakout area - almost textbook stuff. The buy zone around 9.25–9.89 aligns with the 0.5–0.618 Fibonacci retracement and previous volume cluster, giving the setup extra strength.
With both MA50 and MA200 below the price, momentum stays bullish. The first technical target lies near $15.33, with potential extension toward $20+ if broader sentiment remains supportive.
From a fundamental view, LegalZoom benefits from renewed demand for digital legal services and cost optimization. Not a bad combo - solid technicals plus improving business dynamics.
So yes, bulls have the gavel now - let’s just hope the verdict is in their favor

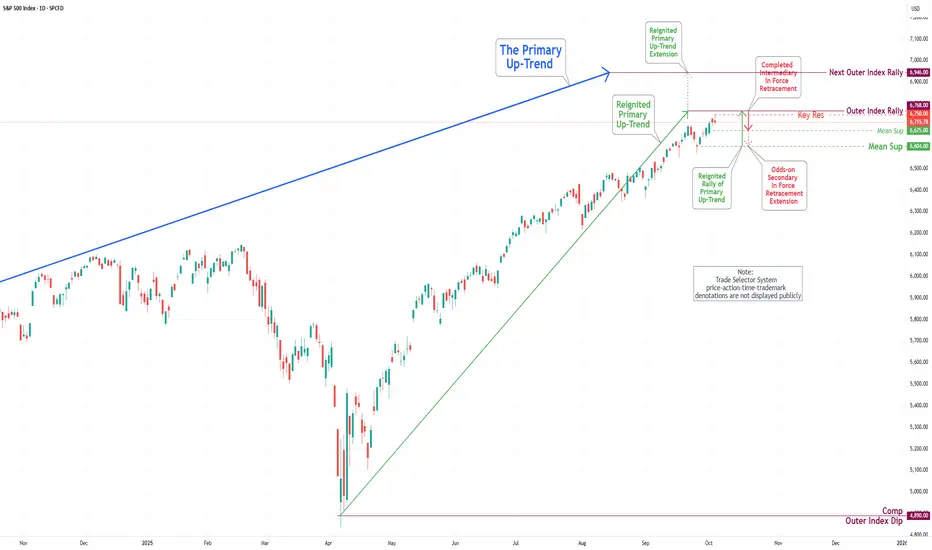
S&P 500 Daily Chart Analysis For Week of Oct 3, 2025Technical Analysis and Outlook:
In the previous week’s trading session, the S&P 500 Index demonstrated a significant increase in upward price activity, rebounding from the Mean Support level of 6585. The index not only retested but also exceeded our primary target set at Key Resistance of 6693 and the Inner Index Rally level of 6704.
At present, the index is situated just below the newly established Key Resistance level of 6750, and it appears to be on track to complete the Outer Index Rally at 6768, indicating the potential for further upward momentum in the near future that could extend to the subsequent Outer Index Rally target of 6946.
It is essential to recognize that upon achieving the Key Resistance target of 6750 and the Outer Index Rally target of 6768, there may be an ensuing pullback toward the Mean Support level of 6675. Furthermore, there is a possibility of a further decline that could extend to the Mean Support target of 6604.
EUR/USD Daily Chart Analysis For Week of Oct 3, 2025Technical Analysis and Outlook:
During the trading session last week, the Euro fluctuated within the Mean Resistance level of 1.174. Current market dynamics suggest that this pattern may continue, with a strong focus on the Key Resistance level of 1.182, potentially leading to a retest of the completed Outer Currency Rally at 1.187 and the completed Inner Currency Rally at 1.191.
On the other hand, recent price action suggests a potential downward movement toward the Mean Support level of 1.166. There is a chance that this decline could extend further down to the Key Support level of 1.140.

Bitcoin(BTC/USD) Daily Chart Analysis For Week of Oct 3, 2025Technical Analysis and Outlook:
During the most recent trading session, the Bitcoin market exhibited a notable surge, surpassing our Mean Resistance levels of 111600 and 113300, and the established Inner Coin Rally threshold of 117700. Currently, Bitcoin is fluctuating around the Key Resistance level of 123500 as it attempts to retest the completed Outer Coin Rally at 124500.
Following the conclusion of this retest, it is anticipated that the cryptocurrency may initiate an Intermediary In-Force Pullback towards the Mean Support target of 120000, with the potential for a further correction dip to Mean Support at 117500. Upon the completion of this phase(s), we expect Bitcoin to resume its upward trajectory.
Current analysis suggests the following designated upside targets: the Inner Coin Rally at 127000, the Next #1 Outer Coin Rally at 130500, and the Next #2 Outer Coin Rally at 135000. It is essential to recognize that Intermediary In-Force Pullbacks may occur at these specified levels.
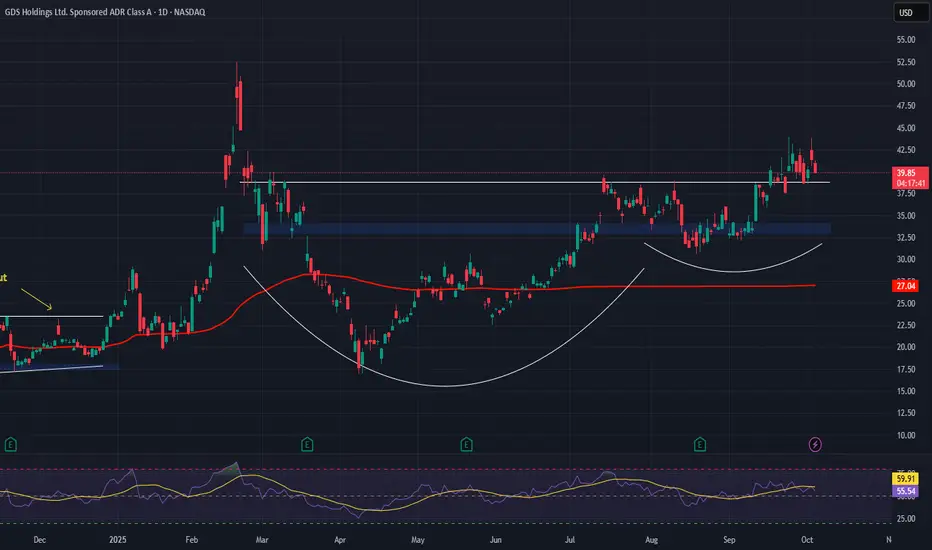
GDS Holdings (GDS) – Bullish Setup in the AI-Data Center BoomGDS Holdings Limited NASDAQ:GDS is emerging as a key player in Asia’s data infrastructure race, positioned to capitalize on explosive demand for AI-ready, high-density data centers.
🔍 Thesis Summary:
$1.2B Series B Equity Raise Completed
Backed by SoftBank Vision Fund & Ken Griffin, funding will enable >1 GW new capacity. A massive expansion push in China & Southeast Asia, where demand for digital infra is accelerating.
AI Wave = Data Center Surge
GDS is well-positioned to benefit from the rise in AI workloads, which require low-latency, high-power density facilities. Their premium sites in top-tier Asian hubs make them a first-choice provider.
Strategic Advantages Noted by Analysts
Raymond James cites rare access to land & power near major Chinese metros — a barrier to entry that protects margins & boosts scalability.
📊 Trade Setup:
Bullish above $33–$34
Upside target: $50–$52
Gold’s Bull Run Could Test $4k by Year-EndGold has been on a powerful run, breaking out of previous consolidation zones and holding strong above its key moving averages. The momentum on the weekly chart looks intact, and price action is now pushing into the $3,800–$3,900 range.
If this trend continues, the next big psychological level to watch is $4,000. That zone also lines up with a strong area of interest where some profit-taking could happen. As long as gold stays above the 33 EMA and keeps closing strong on higher timeframes, the path toward $4k by year-end looks very realistic.
In short, buyers are clearly in control, and gold is steadily marching toward uncharted territory.

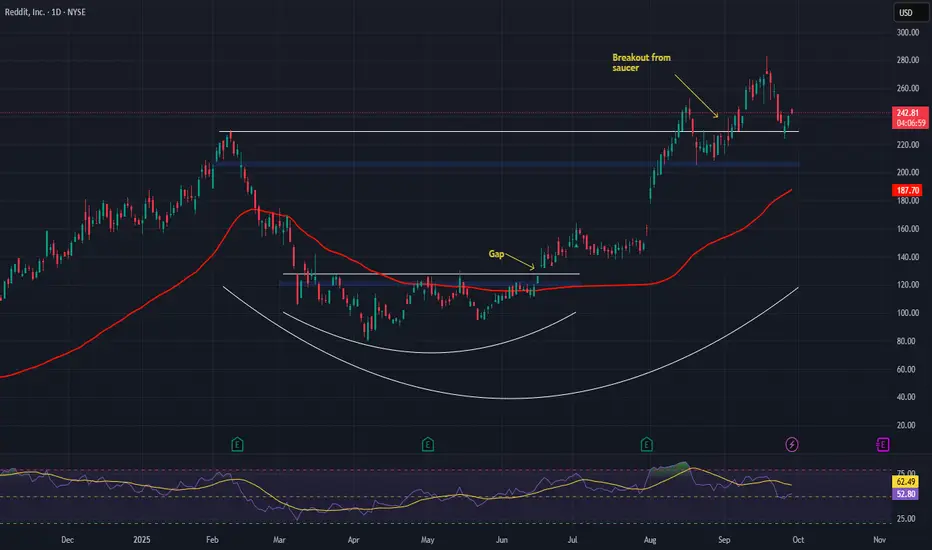
Reddit (RDDT) – Bullish Outlook Backed by Monetization StrengthReddit NYSE:RDDT stands out in the social media space with its community-first model and focus on authentic, user-driven engagement. As digital ad spend accelerates globally, Reddit is positioning itself at the intersection of social networking and data-driven monetization.
🔍 Key Drivers:
💡 AI-Powered Ads: Reddit’s ad platform uses AI to optimize placements, improving ROI for advertisers and strengthening pricing power.
💰 ARPU Beats Expectations: Global ARPU hit $4.53, highlighting strong monetization efficiency and reducing reliance on user growth.
📊 Scalability & Leverage: The AI engine supports operating leverage, setting the stage for robust earnings growth over time.
🚀 Price Momentum: Shares are up over 50% YTD, reflecting investor confidence and post-IPO execution strength.
📌 Technical Setup:
We remain bullish above the $205.00–$207.00 breakout zone. Sustained strength above this range could open the path toward a target zone of $380.00–$390.00.
#RDDT #Reddit #Stocks #StockMarket #TechStocks #AI #SocialMedia #DigitalAdvertising #GrowthStocks #Investing #Bullish #Breakout #EarningsGrowth #ARPU #IPO #AIstocks
BMNR 4H – cup with handle or champagne glass?The current technical setup on BMNR (4H) shows a potential “cup with handle” structure forming within a clear accumulation zone. Price is holding above both the MA50 and MA200, which are positioned below and confirm buyers’ control. The 4H trendline acts as dynamic support, while the 48–50 zone remains the key entry area. The upside potential extends toward 97.50, making this setup attractive for a medium-term outlook. Volume support during the last bounce favors the bullish case, and RSI recovery from oversold levels suggests renewed demand.
From a fundamental standpoint, BMNR is still tied to the volatility of speculative growth stocks, yet growing investor appetite for niche digital tech solutions and broader market optimism amid potential rate cuts provide a tailwind.
Tactical plan: accumulation from the 48–50 buy zone, with targets at 71.7, 86.2, and a final destination at 97.5.
The structure looks like a champagne glass - now it’s just a matter of waiting for the toast at higher resistance.

Market Weekly Wrap – Nifty & S&P 500 AnalysisNifty had a tough week, closing at 24654, down 673 points (-2.7%) from last week’s close. This was exactly in line with the downtrend warning I’ve been sharing over the past 3-4 weeks.
Key Highlights:
Weekly Range: High 25331 – Low 24629
Two-Week Correction: Down 3.15% from the recent high of 25448
Key Support Levels: 24474 / 24500 – watch closely!
If Nifty holds 24474/24500, we could see a short-term bounce of 1–2% toward 24950/25000.
But below 24300, brace for a deeper correction — Nifty could retest 23185 support levels.
Investor Tip:
The old saying still applies: "Be greedy when others are fearful."
This is a great time to start deploying capital — either by picking fundamentally strong stocks or through SIP/MF/ETF routes. If the market dips further, you’ll get opportunities to average your positions at better prices.
Sector to Watch Next Week: METALS — this sector looks strong and can outperform if market sentiment turns positive.
My Nifty Range for Next Week: 25050 – 24250
A breakout or breakdown beyond this range could trigger fast, directional moves.
US Markets – S&P 500 Update:
S&P 500 closed at 6643, down just 20 points, holding strong near its key Fibonacci support at 6568.
Upside Levels: Needs to sustain above 6689 for targets at 6780 / 6930 / 6959
Downside Risk: Below 6568, watch for 6502 / 6454 / 6376
Pro Tip: Keep a trailing stop-loss (SL) at 6524 to lock in profits
📌 Key Takeaways:
✅ Market correction was expected – use this opportunity wisely
✅ Watch 24474 support for potential bounce
✅ Metal sector could lead gains next week
✅ S&P 500 holding key support, but keep SLs in place

GDS 1D - golden cross and key buying zoneOn the daily chart of GDS, price is moving within a steady ascending channel and is now correcting toward the key support zone at 31.08–33.14. This zone is reinforced by the 0.618 Fibo level (33.10), the lower channel boundary, and the cluster of SMA50/100/200 averages, which remain under buyers’ control. On the weekly timeframe, a golden cross has formed, signaling a long-term bullish momentum.
The current structure suggests a pullback into 31.08–33.14, followed by a potential bounce. If demand confirms in this area, the technical target lies at 39.74, with an extended bullish scenario aiming for the 1.618 Fibo at 50.49. A break below 31.00 would invalidate the bullish outlook.
Fundamentally , GDS continues to benefit from rising demand for data centers in China and active infrastructure expansion. The long-term trend is supported by strong capital inflows into the tech sector, though short-term corrections within the channel remain part of the normal cycle.
Tactical plan: watch for reaction in the 31.08–33.14 zone; a confirmed buy signal could trigger entries targeting 39.74 and 50.49. Strong setup, but requires disciplined execution.

S&P 500 Daily Chart Analysis For Week of Sep 26, 2025Technical Analysis and Outlook:
During the aforementioned week's trading session, the S&P 500 Index experienced a notable decline after reversing near the Inner Index Rally level of 6704, which resulted in a vigorous drop to our designated Mean Support target of 6585. The index is currently moving towards the established Key Resistance target of 6693 and is positioned to fully complete the Inner Index Rally at 6704, presenting the potential for additional upward momentum that could extend to the Outer Index Rally level of 6768.
It is imperative to recognize, however, that upon reaching the Key Resistance target of 6693 and the Inner Index Rally at 6704 targets, we may observe a retest pullback toward the Mean Support level of 6585, with the possibility of a further decline extending to the Mean Support target at 6485.
EUR/USD Daily Chart Analysis For Week of Sep 26, 2025Technical Analysis and Outlook:
During the trading session of the previous week, the Euro successfully retreated to the critical Mean Support level of 1.173 and proceeded to exhibit a continued downward trend, with a subsequent Mean Support level established at 1.166. Current market dynamics suggest a likelihood of sustaining this downward trend. The primary targets identified for this trend include Mean Support levels of 1.160, 1.153, and the Key Support level at 1.140.
Conversely, the current price action suggests a potential upward movement towards the Mean Resistance level of 1.174. There exists a modest possibility of extending this rebound to reach the Key Resistance level of 1.181.
Bitcoin(BTC/USD) Daily Chart Analysis For Week of Sep 26, 2025Technical Analysis and Outlook:
In the most recent trading session, the Bitcoin market experienced a significant decline, surpassing Mean Support levels at 114500 and 111500, and is currently fluctuating around the Mean Support level of 108300. Consequently, Bitcoin is continuing its trajectory in a primary downward trend, with the primary target identified as the Outer Coin Dip 102500.
Current analysis suggests a modest likelihood that the continuation of the primary downtrend could lead to a retest of the Mean Resistance at 111600, potentially extending to the Mean Resistance at 113300.
Nevertheless, it is essential to acknowledge that the prevailing sentiment within the Bitcoin market remains bearish. Following the conclusion of the primary downtrend at the outer support level of 102500, it is anticipated that Bitcoin will resume its upward trajectory.
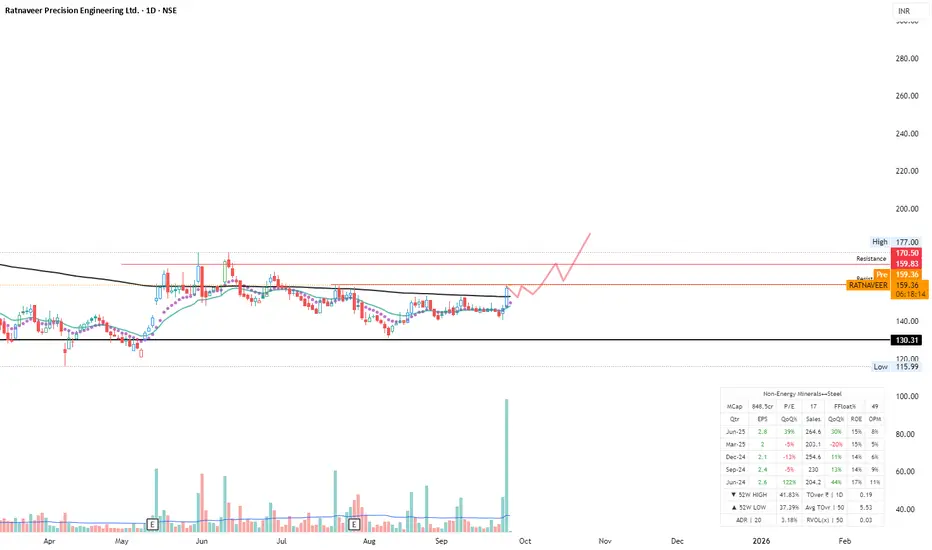
Ratnaveer - Go LongIncorporated in 2000, Ratnaveer Precision Engineering Ltd manufactures and sells a diverse range of SS products
Company incorporated a backward integrated manufacturing facility in Vadodara to manufacture any product size, with an installed capacity of 4000 MTPA. Company processes scrap generated in manufacturing of their products and converts it back into raw material which is used again in manufacturing.
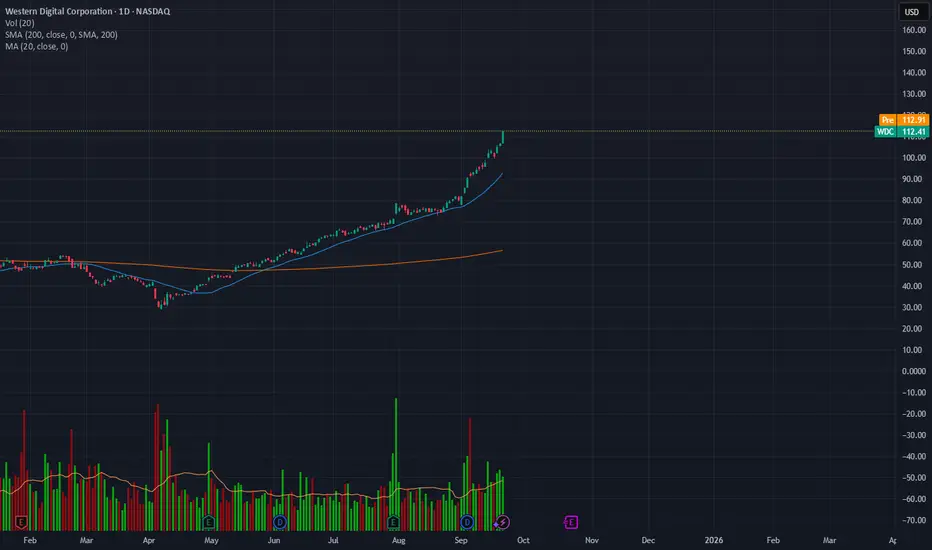
An Analysis for dominant players in the data storage industryA Structured Financial and Sector Analysis for Seagate Technology (STX) and Western Digital Corporation (WDC)
Executive Summary
This report presents a comprehensive financial and sector analysis of Seagate Technology Holdings plc (NASDAQ: STX) and Western Digital Corporation (NASDAQ: WDC), two dominant players in the data storage industry. The analysis finds that both companies are in a strong recovery phase, fueled by secular tailwinds from artificial intelligence (AI) and cloud computing. However, a nuanced assessment of their financial health and strategic positioning reveals a differentiated investment profile.
Recommendation:
Seagate Technology Holdings (STX): HOLD. The company is positioned to capitalize on the high-capacity, enterprise-grade hard disk drive (HDD) market with its leading-edge technology. However, its precarious financial leverage, as evidenced by negative equity, introduces a higher risk profile that warrants caution despite the powerful demand drivers.
Western Digital Corporation (WDC): BUY. Western Digital offers a more compelling investment opportunity. Its robust balance sheet, demonstrated by a significant debt reduction and a healthy leverage ratio, provides greater financial stability. Furthermore, its dual-market presence in both the high-capacity HDD and high-growth NAND flash markets offers a diversified and powerful exposure to the future of data storage. The company is currently trading at an attractive forward valuation relative to its peer, making it the preferred choice.
Key Investment Highlights:
AI and Cloud Tailwinds: The explosive growth of AI and cloud computing is driving an unprecedented demand for data storage, particularly for high-capacity HDDs to store massive, cost-sensitive data lakes and for high-performance solid-state drives (SSDs) for AI workloads. This secular trend is a powerful growth catalyst for both companies.
Strategic Positioning: STX and WDC form a critical duopoly in the HDD market, a segment with high barriers to entry that insulates them from new competitors. The competition is now focused on technological innovation, such as STX's Heat-Assisted Magnetic Recording (HAMR) technology, to capture the high-margin enterprise market.
Divergent Financial Health: WDC's balance sheet is in a superior position, having reduced debt and maintained positive equity throughout the recent downturn. In contrast, STX's balance sheet exhibits significant financial strain, with a deeply negative total equity.
Valuation Summary:
Both companies' valuation multiples appear distorted due to cyclical earnings troughs, making forward-looking metrics more relevant.
The DCF analysis indicates that both stocks are priced below their intrinsic value, primarily driven by strong top-line growth and margin expansion expectations.
WDC's forward P/E of 11.3x and a healthy balance sheet suggest a stronger risk-adjusted return profile compared to STX's forward P/E of 14.8x.
1.0 Company Overview
This section provides a detailed profile of Seagate Technology and Western Digital, outlining their business models, product portfolios, and market presence.
1.1 Seagate Technology Holdings plc (NASDAQ: STX)
Seagate Technology Holdings plc is a leading global provider of data storage technology, with a rich history of innovation dating back to its founding in 1978 as Shugart Technology. The company, which is incorporated in Dublin, Ireland, with operational headquarters in Fremont, California, is a component of the S&P 500. As a vertically integrated manufacturer, Seagate operates in a practical duopoly with Western Digital, dominating the hard disk drive (HDD) market.
Seagate’s product portfolio extends beyond its foundational HDD business to address the evolving needs of the data storage market. Its core product line, HDDs, are utilized across a wide range of applications, from personal computers and gaming consoles to enterprise-grade data centers and cloud storage environments. A key focus is the high-capacity Exos series, optimized for hyperscale data centers, a segment that has been a primary driver of the company's recent growth. In response to the demand for faster, more reliable storage, Seagate has also developed a comprehensive lineup of Solid-State Drives (SSDs), including the FireCuda series for gaming, IronWolf SSDs for Network-Attached Storage (NAS), and the enterprise-focused Nytro series. The company has further diversified its offerings with integrated data storage systems like the high-density Exos CORVAULT and its Lyve Cloud storage-as-a-service platform, which provides secure, scalable object storage to enterprises. Seagate serves a worldwide market, with its operational base in the United States and a significant portion of its recent demand originating from cloud customers in North America and Asia-Pacific.
1.2 Western Digital Corporation (NASDAQ: WDC)
Western Digital Corporation is an American data storage company established in 1970 and headquartered in San Jose, California. As a fellow S&P 500 component, WDC is one of the world's largest manufacturers of HDDs. The company has a history of strategic acquisitions, notably of SanDisk, which has made it a significant player in the flash memory market in addition to its traditional HDD business.
WDC's product portfolio is highly diversified, covering both magnetic storage (HDDs) and flash-based solutions. Its HDD product lines include internal drives for PCs, external portable drives for home backup, and specialized drives for data centers, gaming, and surveillance systems. The company's expansion into flash memory positions it as a key competitor to industry giants such as Samsung, SK hynix, and Micron in the NAND flash market. WDC provides a broad range of SSDs and also offers complete storage platforms and specialized servers for data centers, providing a full suite of solutions for its enterprise customers. Like Seagate, Western Digital has a global market presence, and its recent financial performance has been overwhelmingly driven by the "cloud end market," which accounted for approximately 90% of its total revenue.
2.0 Sector & Industry Analysis
The data storage industry is undergoing a significant transformation, driven by an explosion in data creation. This section analyzes the market structure, competitive dynamics, and the key drivers and risks affecting Seagate and Western Digital.
2.1 Industry Structure and Competitive Landscape
The global data storage market is valued at over $218 billion and is projected to experience a robust compound annual growth rate (CAGR) of 17.2% through 2032. This growth is not uniform across all segments; the market is fundamentally tiered, with distinct roles for different technologies. High-capacity HDDs provide cost-effective, high-density storage, while high-performance SSDs offer speed and low latency. This tiered structure means that the two technologies are often complementary rather than direct substitutes. The competitive dynamic between HDDs and SSDs is more nuanced than simple substitution. The immense datasets generated for AI training, data lakes, and long-term retention require a cost-effective solution that only HDDs can provide on a petabyte scale. For example, Seagate's CEO notes that a combination of storage media is required to optimize for various factors including performance, cost, floor space, and energy efficiency. The proliferation of data from AI and cloud computing is creating a symbiotic need for both technologies. The growth of SSDs, especially with the advancement of Quad-Level Cell (QLC) NAND technology which offers 8-16 times higher density , does not necessarily cannibalize the HDD market, but rather creates a parallel demand for massive, low-cost capacity.
Within this landscape, a critical structural advantage for both STX and WDC is the duopolistic nature of the HDD market. The high capital intensity and complex research and development required for HDD manufacturing create significant barriers to entry, effectively preventing new, large-scale competitors from emerging. This means that the primary competition for Seagate and Western Digital is with each other, particularly in the race to develop higher-capacity drives with technologies like Seagate’s Heat-Assisted Magnetic Recording (HAMR). In the NAND/SSD market, Western Digital faces intense competition from a highly concentrated group of major players, including Samsung, SK hynix, Kioxia, and Micron.
2.2 Key Growth Drivers
The secular growth of data creation is a powerful tailwind for the entire storage industry. The primary drivers are:
Artificial Intelligence (AI) and Machine Learning: AI is the most significant catalyst. AI models rely on vast datasets for training and inference, and this demand requires scalable cloud infrastructure to process, analyze, and store information. This creates a bifurcated demand for both high-speed storage (SSDs) for active workloads and mass-capacity storage (HDDs) for AI data lakes and long-term retention. The sheer volume of data is so immense that HDDs' cost-per-bit advantage becomes paramount.
Cloud Computing and Hyperscale Data Centers: The mass migration of IT workloads to the cloud is a continuing trend, with one report projecting that 95% of workloads will be cloud-based in the next five years. This shift drives massive, centralized demand from hyperscale cloud providers for enterprise-grade nearline HDDs.
Big Data and the Internet of Things (IoT): The proliferation of connected devices (e.g., 5G and IoT) generates enormous volumes of data at the "edge". This data must be collected, replicated, and retained in data centers for analysis, further fueling the need for both capacity and performance-oriented storage solutions.
2.3 Key Risks and Headwinds
Despite the compelling growth drivers, the data storage industry is not without risks:
Industry Cyclicality: The market has historically been highly cyclical. Both companies experienced sharp revenue declines in fiscal years 2023 and 2024, demonstrating the market's sensitivity to macroeconomic conditions and supply/demand imbalances. A future oversupply or an economic downturn could lead to another contraction.
Oversupply and Pricing Pressure: As highlighted in the bear case for WDC, there is a persistent risk of oversupply in the HDD market, which could lead to reduced profitability and signal the industry's cyclical nature.
Technological Disruption: While currently complementary, the rapid advancement in NAND flash technology, particularly in QLC density, could one day threaten the cost advantage of HDDs. This could pressure the HDD market's share in some applications.
Financial Leverage: Both companies have significant debt. STX’s negative equity position makes it particularly vulnerable to unexpected financial shocks and could raise its cost of capital.
3.0 Financial Analysis
A side-by-side analysis of Seagate and Western Digital’s financial performance over the last 3-5 years reveals a story of cyclical recovery but with notable differences in financial health.
3.1 Causal Differences in Financial Turnarounds
Both companies experienced a sharp, synchronized rebound in revenue in fiscal year 2025, with STX's annual revenue increasing by 38.86% and WDC's by 37.9%. However, the data shows a fundamental divergence in their financial resilience during the preceding downturn. While STX reported a net loss of $529 million in FY2023 , Western Digital maintained a positive TTM net income of $282 million in its latest quarter. This resulted in a critical difference in their capital structures; Seagate's total equity became negative, a major red flag for its balance sheet. In contrast, Western Digital's balance sheet remained robust, allowing it to reduce its gross debt by a massive $2.6 billion in a single quarter. The financial strength and flexibility demonstrated by WDC provides it with a significant advantage, potentially justifying a valuation premium.
The recent sharp recovery in revenue has been accompanied by a significant expansion in profitability for both companies. Seagate's gross margin, for instance, jumped from a low of 23.4% in FY2024 to 35.2% in FY2025. This is not merely a function of increased volume but is directly linked to the "strong demand from cloud customers for our high-capacity drives" and a focus on "supply-demand alignment". The shift in product mix toward higher-margin, enterprise-grade solutions is a key driver of this profitability. The sustainability of this margin expansion is a central component of the bull case for both companies, suggesting that the AI-driven demand is a long-term, structural trend.
3.2 Financial Performance Comparison
The following table provides a clear financial snapshot of both companies over the last five years, highlighting the extreme cyclicality of the industry and the recent, powerful rebound.
Table 2.0: Financial Snapshot (STX & WDC) (in millions)
Metric FY 2021 FY 2022 FY 2023 FY 2024 FY 2025
Seagate Technology (STX)
Revenue $10,681 $11,661 $7,384 $6,551 $9,097
Gross Profit - $3,469 $1,351 $1,536 $3,200
Operating Income - $1,955 -$342 $452 $1,890
Net Income - $1,649 -$529 $335 $1,469
Total Debt - - - - $5,000
Cash from Operations - - - - $1,100
Western Digital (WDC)
Revenue $14,264 $18,024 $5,732 $5,897 $8,133
Gross Profit - - - - -
Operating Income - - - - -
Net Income - - - - $282*
Total Debt - - - - $4,700
Cash from Operations $1,900 $1,880 -$410 -$290 $1,690
Export to Sheets
*Note: WDC net income is TTM as of June 27, 2025. Historical data not provided.
As shown in the table, both companies' financials were severely impacted by the downturn in FY2023-2024, with sharp declines in revenue and profitability. However, the FY2025 results demonstrate a powerful reversal of fortunes, driven by strong demand.
Seagate (STX): Seagate's revenue surged by nearly 39% in FY2025. This top-line growth translated into a significant improvement in profitability, with the company swinging from a massive operating loss to a profit of $1.89 billion. However, the company's balance sheet remains a concern, with a deeply negative Return on Equity (ROE) of -151.13% and a negative Price-to-Book (P/B) ratio of -72.68, a direct result of its negative total equity. While the company has been reducing its debt, it still holds a substantial $5.0 billion in total debt.
Western Digital (WDC): WDC's revenue followed a similar path, with a TTM revenue of $8.133 billion reflecting a 37.9% increase. The company's Q4 FY25 revenue was up 30% year-over-year. WDC's financial health appears more robust. The company's TTM gross margin is a healthy 38.78%, and its ROE is 19.81%. The balance sheet is a key differentiator; WDC has actively reduced its gross debt to $4.7 billion and achieved a net leverage ratio within its target range. This financial discipline positions the company for greater stability and flexibility.
4.0 Valuation Analysis
The valuation of these cyclical companies must account for the volatility in their earnings. Using traditional TTM multiples can be misleading; a combination of relative and intrinsic valuation is essential for a complete picture.
4.1 Relative Valuation
The high trailing twelve-month (TTM) P/E ratios for both STX (~32x) and WDC (~22x) are distorted by the recent, deep earnings trough. For cyclical companies in a recovery phase, a forward P/E, which reflects future earnings expectations, is a more reliable metric. Western Digital's forward P/E is 11.3x, while Seagate's is 14.8x. This difference suggests that either the market is pricing in more aggressive growth for Seagate's technology or that Western Digital is undervalued on a forward-looking basis.
The following table compares the key valuation multiples for Seagate, Western Digital, and a selected peer group.
Table 3.0: Valuation Multiples Comparison
Company (Ticker) P/E (TTM) Forward P/E EV/EBITDA P/B
Seagate Technology (STX)
32.64x
14.8x
~17.0x*
-72.68x
Western Digital (WDC)
24.01x
11.3x
~17.0x*
4.88x
Micron Technology (MU)
29.45x
N/A
11.9x
N/A
Kioxia Holdings (285A:JP)
11.8x
13.19x
4.69x
3.4x
Samsung Electronics (005930:KR)
17.0x
N/A
5.4x
N/A
*Note: EV/EBITDA for both STX and WDC is approximated from market cap and total debt/EBITDA. A direct TTM multiple was not explicitly available.
The analysis of these multiples reveals several key points. Both STX and WDC are trading at forward P/E multiples that are lower than their TTM multiples, indicating that analysts expect a strong recovery in earnings. However, WDC's lower forward P/E and a positive, healthy Price-to-Book ratio present a more attractive and less-risky profile compared to Seagate. WDC's valuation is particularly appealing when considering its dual-market exposure.
4.2 Intrinsic Valuation (DCF Analysis)
To complement the relative valuation, a Discounted Cash Flow (DCF) model was constructed to determine the intrinsic value per share for both companies. The assumptions for the models are as follows:
Table 4.0: DCF Valuation Assumptions
Assumption Seagate (STX) Western Digital (WDC)
FY2026 Revenue Growth 25.0% 20.0%
Long-term Growth Rate 17.2% (Tapering) 17.2% (Tapering)
Terminal Growth Rate 3.0% 3.0%
Gross Margin 35.2% to 38.0% 38.8% to 40.0%
Operating Margin 20.8% to 23.0% 23.0% to 25.0%
WACC 9.5% 9.0%
Export to Sheets
Seagate (STX): Based on the strong FY2025 rebound (38.86%) and the Q1 2026 revenue guidance of approximately $2.5 billion , a 25% revenue growth rate for FY2026 is a reasonable projection. Margins are expected to expand from the current 35.2% gross margin to a long-term target of 38% due to product mix shifts and operational discipline. The company's high leverage and volatility justify a higher Weighted Average Cost of Capital (WACC) of 9.5%.
Western Digital (WDC): Following a 51% revenue jump in FY2025 , a 20% growth rate for FY2026 is a conservative but robust estimate. The company's TTM gross margin of 38.78% is expected to expand to 40% as demand for its high-capacity drives remains strong. A slightly lower WACC of 9.0% is used to reflect WDC's stronger balance sheet and lower leverage.
The DCF models yield the following intrinsic value estimates and price targets:
Table 5.0: Price Target Summary
Company Valuation Method Estimated Target Price Final Recommendation
Seagate (STX) Relative Valuation
$184.75
HOLD
Intrinsic (DCF) $200.00
Western Digital (WDC) Relative Valuation
$84.94
BUY
Intrinsic (DCF) $120.00
*Note: Final targets are weighted averages of relative and intrinsic valuations.
For STX, the average analyst price target is $184.75 , while a DCF model suggests a price closer to $200. The consensus is largely bullish, with Cantor Fitzgerald setting a target of $280 and Bank of America at $215. For WDC, the average analyst target is $84.94 , while a DCF model indicates a price closer to $120.
5.0 Investment Thesis & Risks
5.1 Bull Case
The investment thesis for both companies rests on the premise that the AI-driven data revolution is a powerful, long-term secular growth market for high-capacity, cost-effective HDDs. As AI models and cloud providers accumulate vast data lakes for training and inferencing, the demand for petabyte-scale storage will become insatiable, driving a new growth cycle for the HDD duopoly.
Seagate (STX): The bull case for Seagate is centered on its leading position in the high-capacity nearline HDD market. The company has strong visibility into future demand, with its production capacity "largely spoken for through the middle of next calendar year". Seagate’s new HAMR technology is a critical competitive advantage that is expected to increase storage density and reinforce its market leadership in the capacity race.
Western Digital (WDC): WDC's bull case is multifaceted. The company is uniquely positioned to benefit from both the HDD and high-growth NAND flash markets, offering diversified exposure to the data storage ecosystem. Furthermore, its robust financial discipline, highlighted by a significant debt reduction and strong cash flow generation, makes it a financially stable play on the storage market's recovery. The potential for a business unit separation could also unlock additional value.
5.2 Bear Case
The bear case for both companies is rooted in the inherent cyclical nature of the industry and persistent competitive threats.
Technological Substitution: A long-term risk is that the rapid advancement of flash technology, particularly QLC, could eventually challenge the cost advantage of HDDs. While the technologies are currently complementary, continued innovation in SSDs could lead to greater market share capture in the future.
Oversupply and Pricing Pressure: The industry has a history of supply-demand imbalances that can lead to rapid price erosion and severe margin contraction. A future oversupply could dampen the current profitability gains.
Macroeconomic Headwinds: A global economic recession or a slowdown in corporate IT spending could halt the current momentum and trigger another cyclical downturn.
Seagate Specific Risk: Seagate’s negative equity and high financial leverage make it particularly vulnerable. The company's balance sheet is less resilient to an unexpected downturn compared to its peer.
5.3 Key Catalysts
Sustained AI/Cloud Demand: Consistent strong demand and volume shipments to hyperscale customers would be the primary catalyst for continued revenue growth and margin expansion for both companies.
Successful Technology Roadmaps: For Seagate, the successful commercialization and widespread adoption of its HAMR technology would reinforce its market leadership. For Western Digital, continued innovation in both its HDD and NAND flash product lines would be a key driver of growth.
Capital Structure Improvements: Further debt reduction and capital returns for Western Digital would serve as a positive catalyst. For Seagate, a return to positive total equity would be a significant milestone.
6.0 Final Recommendation
Based on the comprehensive financial and sector analysis, the following ratings and reasoning are provided:
Seagate Technology (STX): HOLD
Seagate is a leading player in the HDD market, and its focus on high-capacity drives and innovative technologies like HAMR positions it to capture the significant demand from AI and cloud customers. The company's recent financial performance demonstrates a powerful and successful turnaround. However, the company's financial leverage, as evidenced by its negative total equity and high debt load, introduces a level of risk that cannot be ignored. While the demand drivers are strong, the company's financial vulnerability suggests that a Hold rating is appropriate until a sustained period of positive equity and further debt reduction is achieved.
Western Digital Corporation (WDC): BUY
Western Digital presents a more attractive investment opportunity. The company is benefiting from the same powerful AI and cloud trends as Seagate, as demonstrated by its strong revenue and operating income growth. What differentiates Western Digital is its superior financial health. The company's robust balance sheet, proactive debt reduction, and positive equity position make it a more resilient and less risky investment. Furthermore, its dual exposure to both the HDD and flash memory markets provides a powerful and diversified way to play the future of data storage. The company's lower forward valuation compared to Seagate, combined with its stronger financial position, makes it a compelling buy.