EUR/USD Daily Chart Analysis For Week of Sep 19, 2025Technical Analysis and Outlook:
During the trading session of the previous week, the Euro successfully retested the completed Inner Currency Rally at 1.177 and displayed significant upside momentum, reaching and completing the Outer Currency Rally at 1.187, with Key Resistance noted at 1.181. Following this completion, the Euro reversed its course and experienced a sharp decline, ultimately resting at the Mean Support level of 1.173.
It is imperative to highlight that the current market dynamics indicate a likelihood of continued downward movement from recent price levels. Attention should be directed towards additional support targets established at 1.169 and 1.162.
Conversely, the present price action suggests a potential retest of the completed Inner Currency Rally at 1.177 and Outer Currency Rally at 1.187, which will lead to a substantial pullback from these upward targets.
Investing

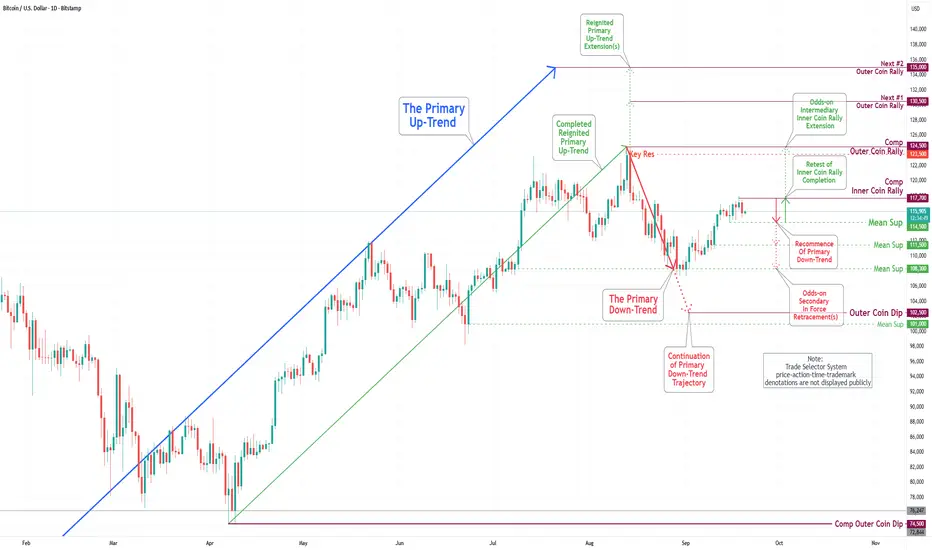
Bitcoin(BTC/USD) Daily Chart Analysis For Week of Sep 19, 2025Technical Analysis and Outlook:
In the previous trading session, the Bitcoin market exhibited a modest increase and completed Inner Coin Rally 117700. Consequently, the cryptocurrency is currently experiencing a resumption of the intermediate Primary Down-Trend rebound, with the primary target identified as Mean Support at 114500. Additional support levels are defined at 111500 and 108300, respectively.
Current analysis suggests a slight probability that the Intermediate Primary Rebound could facilitate a retest of the Outer Coin Rally at 124500, via the Key Resistance established at 123500.
However, it is critical to acknowledge that the prevailing Bitcoin market sentiment reflects a continuing downtrend. Whereas upon the conclusion of the Primary Down-Trend, the Outer Coin Dip at 102500, it is anticipated that Bitcoin will resume its upward trend.
OKLO — when nuclear momentum breaks resistanceSince late 2024, OKLO had been consolidating inside a clear rectangle between $17 and $59. The breakout from this long-term range triggered a new bullish impulse. The price has since returned to retest the breakout zone, now aligned with the 0.618 Fibonacci retracement at $51.94. The retest has completed, and the price is bouncing upward, confirming buyer interest.
Technically, the trend remains firmly bullish. The price closed above the prior range, EMAs are aligned below, and the volume spike during breakout supports genuine demand. The volume profile shows a clean path toward $100, indicating limited resistance ahead. The structure suggests a controlled rally rather than an exhausted move.
Fundamentally, OKLO is a next-generation SMR (Small Modular Reactor) company focused on delivering compact, efficient nuclear power solutions. Following its public debut via SPAC and recent capital injection, OKLO is transitioning from development to implementation. Institutional interest is holding strong, and the broader move toward decarbonization and energy independence places the company in a strategic position.
Target levels:
— First target: $100 — psychological and technical resistance
— Second target: $143 — projected from prior range breakout
OKLO isn’t just another clean energy ticker — it’s a quiet disruptor with nuclear potential. The chart broke out. The volume confirmed. Now it’s time to see if the market follows through.

ARM Holdings — reversal pattern signals growth potentialOn the ARM chart an inverted head and shoulders pattern is taking shape with price approaching the neckline around 144–145 and a confirmed breakout above this level could trigger an upward move toward 220 with extended targets at 310–330. In case of a pullback the 128 zone remains key support to preserve the bullish structure. Fundamentally ARM continues to strengthen its role in chip architecture while growing demand in artificial intelligence and mobile technologies drives institutional interest. As long as the pattern holds the bullish scenario stays in play.

Chipotle (CMG): Brand Power Meets Technical PatienceWhat they do: Fast-casual burritos/bowls with a heavy digital and throughput focus.
Why it’s strong: Industry-leading unit economics, brand love, and a deep U.S. runway—now going global.
Developments:
Asia entry JV (SPC Group): first restaurants in South Korea & Singapore in 2026.
Some metrics:
Forward P/E: ~27.5x.
ROIC (TTM): ~19–22%
Debt/Equity: ~1.35 (lease-heavy model).
Piloting kitchen automation like “Autocado” (guac prep) and “Chippy” (chips).
Risks: Food inflation; labor availability; brand hit risk from food-safety headlines.
Moat in a line: Brand + operational throughput at scale.
Technical view
A bit sloppy, but the criteria are in place. It’s “sloppy” because the levels don’t line up compactly — if they were a few percent tighter, it would form a stronger support zone.
Still, the high-probability area is there, between $32 - $43
- Trendline drawn from monthly closing prices
- Channel projection
- Previous highs turning into support
- 50% drop from the ATH
Cheers,
Vaido

Goldman Sachs - Too Cheap to Ignore?NYSE:GS and the general financial services sector as a whole has faced extreme trauma over this past month. However, one that particularly stands out is the "bad guy" of the industry who has taken the equivalent to a roundhouse kick to the face, and the chart shows it. But does this mean that someone looking for a dip shouldn't pick up strong equity on a discount? I say no, lets be greedy while other are fearful just like that one guy said. Warren something... I don't really remember his name.
Let's examine the numbers before we do the finance equivalent of astrology. This means that value investing and it's rather elementary techniques are going to give us some sort of indicator of a buy or a sell. Here's what you need to know.
1. Sachs has an attractive dividend yield of 2.14% ($11.50/share) and a gleaming dividend payout ratio (DPR) of 21.50%.
2. It is far from its high annual EPS sitting at 41.21 sliding from its high last December at 60.35.
3. It's price to earnings ratio (PE) is lounging nicely at 14.00 meaning we are at a generally cheap share price. This metric is what we're looking for.
4. Unfortunately, it has a rather higher price to book ratio (PB) at 1.64 which somewhat contradicts the PE ratio examined in #3.
5. Other metrics to keep in mind is an EV/EBITDA at 53.90 and a PEG at 16.23 which are both considered undesirable to investors.
So as far as statistics are concerned, Goldman is sending some mixed signals making a decision difficult at the moment. This means we're going to have to examine the general sector sentiment and general outlook.
Firstly, I'd like to point out Goldman's enterprise value. Sachs' EV is currently reported at 855.93 billion, 673 billion (78.63%) being debt (long term or short). This means NYSE:GS is a debt heavy company and we all know how debt works (the entity taking on the debt owes principal + interest). Well, this means that NYSE:GS is heavily going to be influenced by interest rates even considering their strong revenue. So, if we plan on interest rates being lowered long term (which I'm sure we all do), Goldman will be able to borrow from the Fed at a cheaper interest price while simultaneously owing account holders and bond holders less in interest (or APY yield for that matter). However, in the event that inflation runs wild and the Fed raises rates, NYSE:GS will face some turmoil along with the other commercial investment banks.
Great, so now for the fun part. Let's see what the charts have to say about this and what it could be implying.
Here is the 4H chart looking back into last October.
As you can see, Goldman posted a sweet rally followed by our current pullback. However, we are being flashed with various bullish technical patterns and a strong explanation for the drop (even considering the tariffs threats and indices pullback). In summary, we are examining a stock in gradual freefall towards what appears to be several safety nets.
On a psychological level, I find that most investors in the business of "smart money" wont let Goldman drop too low before they put their boot down. I also imagine this will happen pretty soon, but we need to hold the $540 price level.
As far as the MACD is concerned, we are experiencing weakness from the buyers are the bears are clearly on offense.
And lastly, the GS implied volatility shows that options traders aren't pricing in anything particularly unusual, and the most usual movement for the market is to climb higher so that's good news.
So, what's the conclusion. In my humble opinion, I believe that Goldman Sachs' stock is trading too low to not buy. Financially, the company is not showing anything particularly concerning and may just need to show some strength before the mass cash chases this play. As of right now, I am long on NYSE:GS considering the financial statistics, general industry sentiment, and technical analysis which was used as an assistance tool. This trade could be last anywhere from 1 day to 1 year, but I am prepared to hold for much longer.

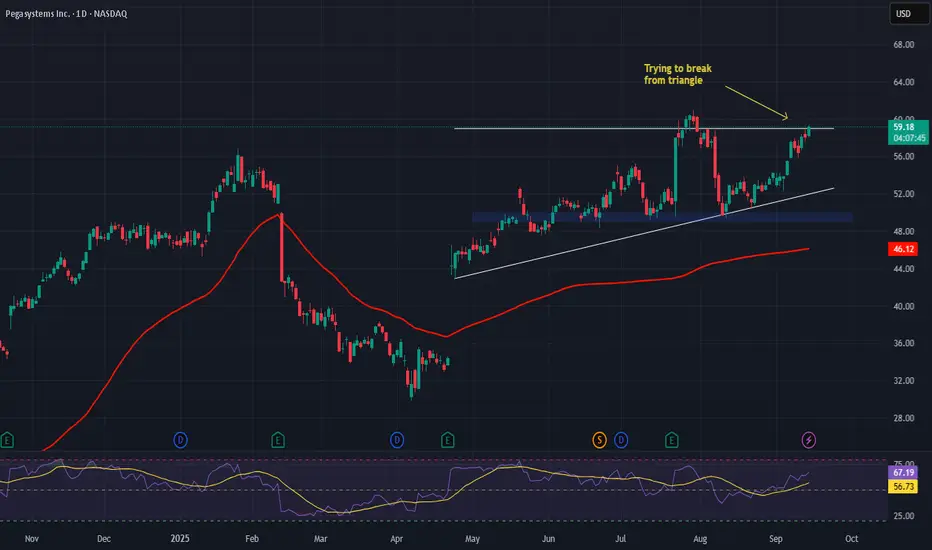
Pegasystems (PEGA) — Growth via AI & Cloud PartnershipsCompany Overview:
Pegasystems Inc. NASDAQ:PEGA is a leader in enterprise software, specializing in business process management and customer engagement solutions. Its offerings enable organizations to enhance efficiency, scalability, and customer experience, positioning it well within the fast-growing digital transformation market.
Key Catalysts:
AI acceleration: The Pega GenAI Blueprint platform reduces development time, delivering stronger ROI for clients such as Vodafone.
Cloud expansion: Partnerships with AWS and Microsoft boost integration, sales reach, and co-selling opportunities—supporting revenue scale.
Industry recognition: Named a Leader in Forrester’s Q3 2025 Digital Process Automation Platforms report, reinforcing brand credibility and competitive edge.
Investment Outlook:
Bullish above: $49–$50
Upside target: $85–$90, driven by AI adoption, cloud partnerships, and industry validation.
#PEGA #AI #CloudComputing #DigitalTransformation #EnterpriseSoftware #TechGrowth #Investing
Bitcoin — resistance test and growth targetsBitcoin is trading near the 115,000 zone, facing key resistance at the 0.705–0.79 Fibonacci levels. A breakout above 116,900 would pave the way toward the next target at 125,000. In case of a pullback, support lies at 112,000 and 110,000, with deeper support near 104,000.
From a fundamental perspective, cryptocurrencies remain supported by institutional inflows and the demand for digital assets as an inflation hedge. Growth potential persists as long as equity markets show strength and the US dollar remains under pressure.
A stock you buy and forget — the longer you hold, the more you earn.

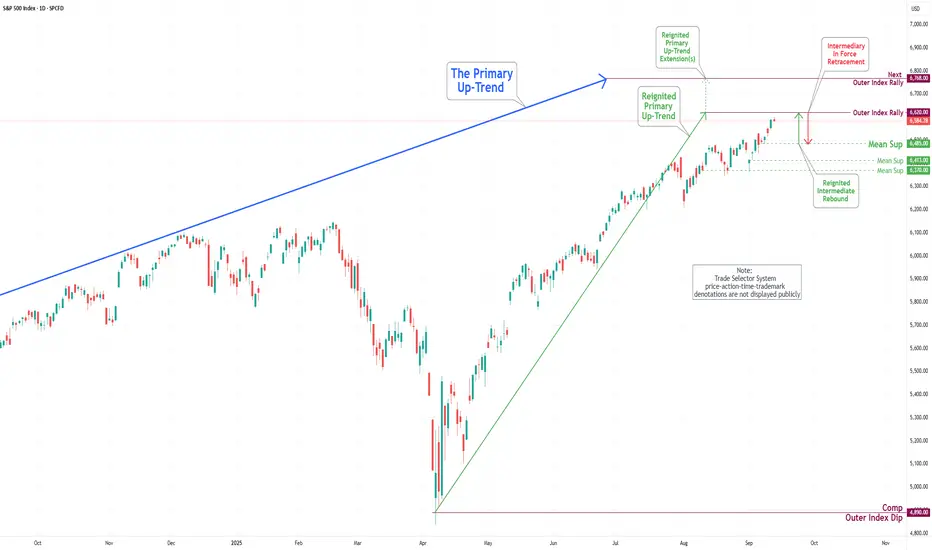
S&P 500 Daily Chart Analysis For Week of Sep 12, 2025Technical Analysis and Outlook:
In the previous trading session, the S&P 500 Index exhibited a substantial upward movement, reaching and completing the Outer Index Rally 6543, and it is striding towards our current designated target: Outer Index Rally 6620, as detailed in the prior S&P 500 Daily Chart Analysis.
It is critical to recognize that upon reaching this momentous target, the resulting price action is anticipated to initiate a significant pullback targeting the Mean Support level of 6485. This pullback is likely to facilitate a considerable rebound, allowing for a subsequent retest of the Outer Index Rally level of 6620.
EUR/USD Daily Chart Analysis For Week of Sep 12, 2025Technical Analysis and Outlook:
In the previous trading session, the Euro completed an Inner Currency Rally at 1.177, resulting in a significant decline towards the Mean Support level of 1.164. Subsequently, the Euro reversed direction and fell sharply below the completed Inner Currency Rally level of 1.177.
Current analysis indicates that the primary targets for the Euro include a retest of the completed Inner Currency Rally at 1.177, with the potential for further upward movement to the Key Resistance level at 1.181. Additionally, there is a long-anticipated target positioned at the Outer Currency Rally level of 1.187. The ongoing price action may yield a substantial pullback from these upward targets.
It is essential to emphasize that the current market dynamics suggest a substantial drop from recent price levels, with attention directed towards the primary target of Mean Support at 1.164, and the possibility of extending this trajectory towards Mean Support at 1.160.

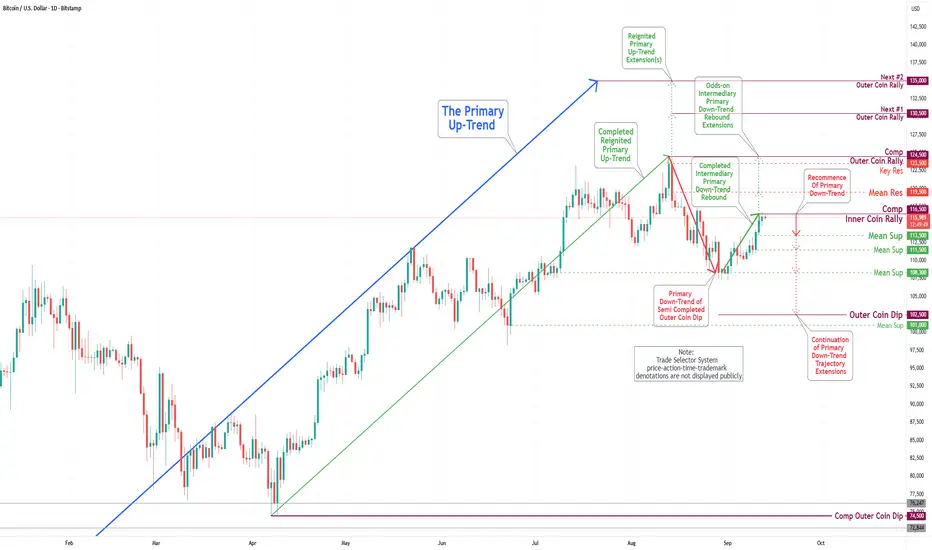
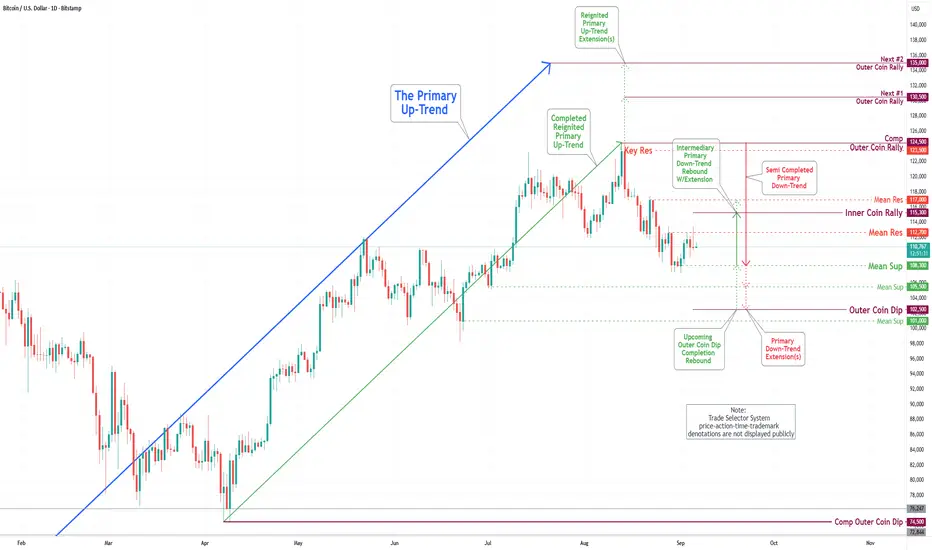
Bitcoin(BTC/USD) Daily Chart Analysis For Week of Sep 12, 2025Technical Analysis and Outlook:
In the preceding trading session, the Bitcoin market demonstrated an upside resurgence, ultimately completing Inner Coin Dip 116500. Subsequently, the cryptocurrency is experiencing a recommencement of intermediary Primary Down-Trend rebound with the main target being Mean Support 113500, and additional extensions marked as Mean Support 111500 and 108300, respectively.
Current analysis suggests a slight possibility that the Intermediate Primary Rebound may extend towards Key Resistance at 123500, potentially leading to a retest of the completed Outer Coin Rally at 124500.
It is crucial to emphasize that the Semi-completed Outer Coin Dip at 102500 signifies the principal ongoing downtrend and accurately reflects the prevailing market sentiment. Upon the completion of this phase, it is anticipated that Bitcoin will resume its bullish trajectory.
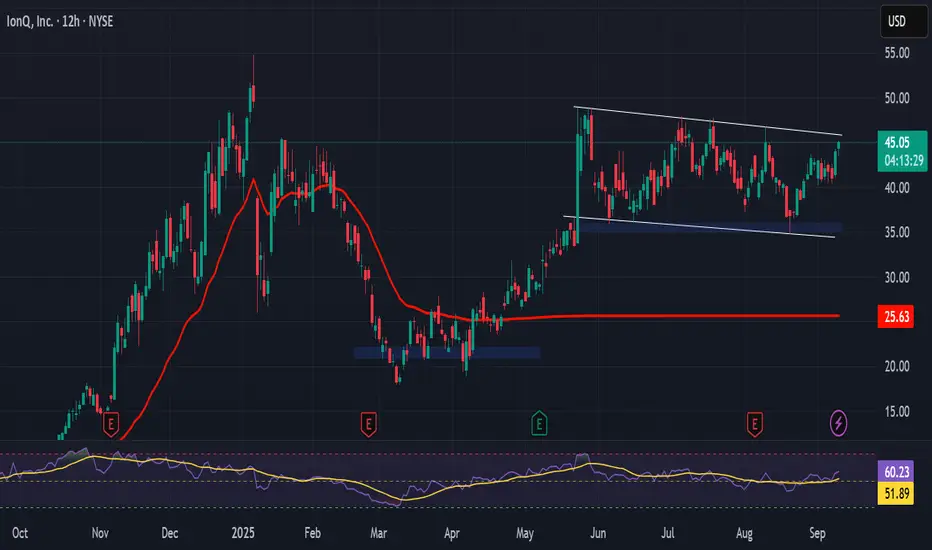
IonQ (IONQ) — Quantum Leader Targeting 8,000 Logical QubitsCompany Overview:
IonQ, Inc. NYSE:IONQ is a quantum computing pioneer using trapped-ion technology to solve problems beyond the reach of classical systems, offering investors exposure to the fast-growing quantum sector.
Key Catalysts:
Quantum communications expansion: Strategic acquisitions (e.g., Capella Space) and investments in quantum networking aim to build a future quantum internet.
Talent & execution strength: High-profile hires like Dr. Marco Pistoia (ex-JPMorgan) and Dr. Rick Muller (ex-IARPA) enhance R&D capabilities.
Long-term roadmap: Goal of 8,000 logical qubits by 2030, a milestone that could cement its competitive edge and drive adoption of practical quantum applications.
Investment Outlook:
Bullish above: $35.00–$36.00
Upside target: $80.00–$82.00, supported by tech milestones, strategic expansion, and top-tier talent.
#IONQ #QuantumComputing #Innovation #AI #QuantumInternet #Investing #TechGrowth
Sahara has a good entry at 0.0937sahara has a good entry today.
enter if the price is within ±2% of 0.0937.
tp: 0.15.
nb: don’t put all your funds in one basket.

DUOL: Premium Growth, Golden Ratio PullbackDuolingo is one of the rare consumer apps that has turned daily engagement into real money. Revenue is growing +40% year-over-year, gross margins sit above 70%, and the company is debt-free with over $1B in cash on the balance sheet. ROIC has now climbed into double digits, proving the model scales.
Yes, the valuation is rich — about 113× trailing earnings and 57× forward — but investors are paying for a clear growth runway: paid subscribers are compounding fast, new verticals like Math and Music are gaining traction, and the Duolingo English Test is carving out its own niche. For long-term holders, that combination of growth + financial safety is exactly what creates durable value.
Technically speaking, the stock has corrected sharply in recent months, mostly due to valuation concerns and profit-taking after a strong run. It almost feels like trying to catch a falling knife, but that’s exactly why it’s worth putting the gloves on and looking for strong support.
Around $200, there’s a powerful confluence of signals:
- Trendline support zone (both from wicks and closing prices)
- Previous highs that now act as support
- Fibonacci golden ratio (61.8%) retracement
- Round number magnet at $200
- Weekly EMA200
Do your homework, and if these align with your thesis, this could be a compelling setup. It’s definitely an area worth watching.
Regards,
Vaido

Weibo Corporation (WB) — Digital Ads Resilience & AI ExpansionCompany Overview:
Weibo Corporation NASDAQ:WB , a leading Chinese social media platform, offers real-time communication and content sharing, giving investors exposure to China’s expanding digital advertising and social networking market.
Key Catalysts:
Ad revenue growth: Q2 2025 ad revenue rose +2% YoY, showing resilience despite sector headwinds.
AI & engagement tools: Investments in AI-driven features and user retention initiatives aim to diversify revenue streams beyond ads.
Institutional support: Holdings increased by Zurcher Kantonalbank and AQR Capital Management, signaling institutional confidence.
Investment Outlook:
Bullish above: $9.50–$10.00
Upside target: $14.00–$15.00, supported by stable ad performance, AI investments, and institutional backing.
#WB #ChinaTech #SocialMedia #DigitalAds #AI #InstitutionalInvestors #Investing

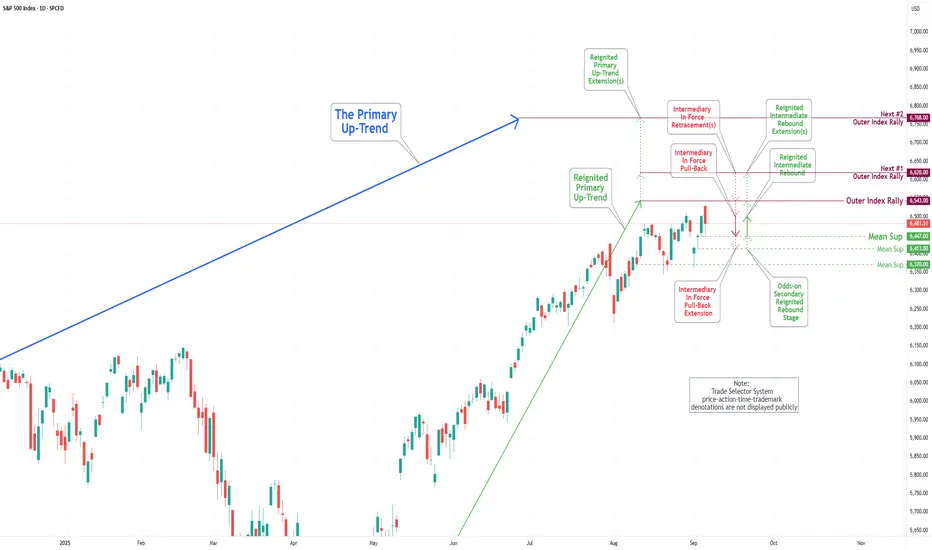
S&P 500 Daily Chart Analysis For Week of Sep 5, 2025Technical Analysis and Outlook:
During the trading sessions of the previous week, the S&P 500 Index exhibited a notable downward movement, reaching the Intermediary In Force Pullback Extension of 6370. An Odds-on Secondary Rebound subsequently followed this decline, as the index restored its upward trajectory by achieving the Mean Resistance level of 6502, although it subsequently settled below this benchmark.
It is essential to acknowledge that the current rebound from the Mean Support level of 6447 suggests a significant probability of a sustained upward movement toward the long-term objective, namely the Outer Index Rally at 6543, as detailed in the prior S&P 500 Daily Chart Analysis. Conversely, one must consider the potential for a substantial pullback to the Mean Support extension level of 6413, which would likely precede another rebound.
Moreover, it is critical to recognize that the ongoing price fluctuations may induce a considerable pullback after the fulfillment of the Outer Index Rally target at 6543. Following this anticipated downward adjustment, the index will likely resume its upward trend, targeting the completion of the Outer Index Rally at 6420.
EUR/USD Daily Chart Analysis For Week of Sep 5, 2025Technical Analysis and Outlook:
In the most recent trading session, the Euro demonstrated significant upward momentum. Initially, it declined to the Mean Support level of 1.164 before commencing a robust upward trend that culminated in reaching the Mean Resistance level of 1.172.
Current analyses indicate that the primary targets for the Euro include the Mean Resistance level of 1.177, as well as the Key Resistance level of 1.181, and a long-anticipated target set at the Outer Currency Rally level of 1.187. The ongoing price action may result in a notable retracement from these upward targets.

Bitcoin(BTC/USD) Daily Chart Analysis For Week of Sep 5, 2025Technical Analysis and Outlook:
During the trading session of the previous week, the Bitcoin market demonstrated a notable upswing, ultimately reaching our designated Mean Resistance level of 117000. Subsequently, the cryptocurrency experienced a retreat and is currently undergoing a consolidation phase.
The prevailing analysis indicates a firm probability of a continuation of the Intermediary Primary Rebound toward the Inner Coin Rally 115300, with the potential to extend its progression to the Mean Resistance level of 117000. However, it is essential to highlight that the Outer Coin Dip 102500 represents the primary ongoing trend and the overall direction of the market. Upon the completion of this phase, it is anticipated that Bitcoin will resume its bullish trajectory.
Bilibili Inc. (BILI) — Gaming Growth & Shareholder ValueBilibili Inc. NASDAQ:BILI , a leading Chinese online entertainment platform, continues to capture younger audiences through video, live streaming, and gaming while actively expanding into Southeast Asia for international growth.
Key Catalysts:
Gaming momentum: Mobile gaming revenue jumped +60% YoY, solidifying its role as Bilibili’s primary growth driver.
Shareholder returns: A $116M share repurchase underscores management’s confidence and enhances EPS growth.
Global expansion: Southeast Asia entry taps into a demographic closely aligned with its core user base.
Investment Outlook:
Bullish above: $19.00–$20.00
Upside target: $45.00–$46.00, supported by gaming growth, buybacks, and international expansion.
#BILI #ChinaTech #Gaming #Streaming #Ecommerce #ShareBuyback #Investing

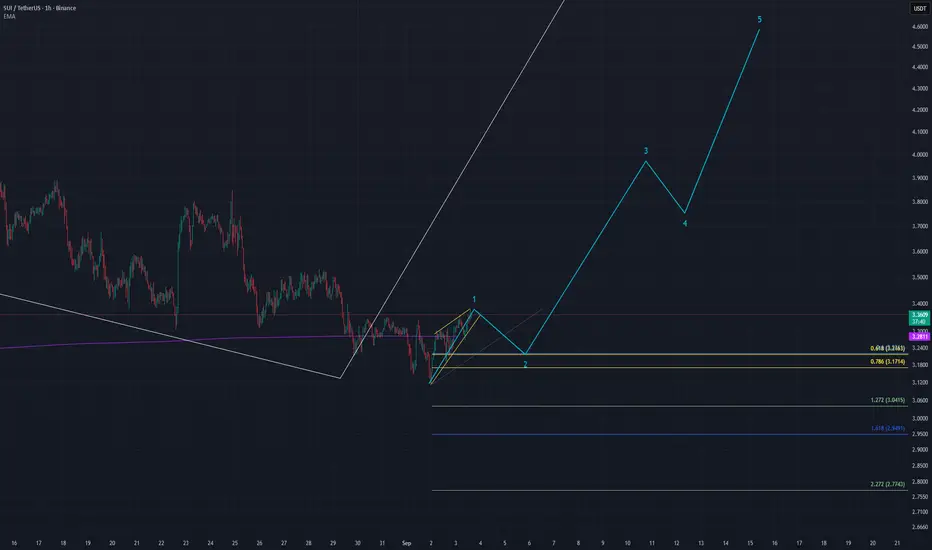
SUI bottom formedSui occuration making leading diagonal. If bottom is formed we can hunt pull back at 0.5 of 0.6 fibonacci level. Also Sui close candlestick above 200 Daily ema.
If Sui retest and find support on this level we can see bigger move elliot wave 3.
Targets 4.1 and above ATH. I think its good way to DCA and wait for confirmation.
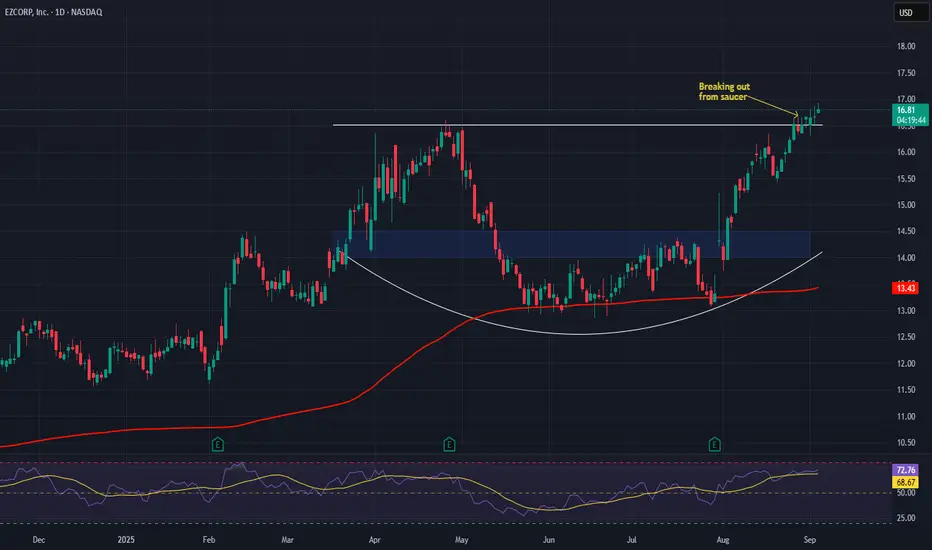
EZCORP (EZPW) AnalysisEZCORP, Inc. NASDAQ:EZPW , a leading pawn services and consumer lending provider, is scaling operations across the U.S. and Latin America—expanding its footprint, diversifying revenue streams, and enhancing resilience.
Key Catalysts:
Operational discipline: Focus on cost controls, inventory management, and service upgrades supports steady performance.
Growth expansion: Geographic diversification reduces reliance on any single market.
Valuation edge: Trading at a forward P/E of ~8.8, EZPW remains significantly undervalued vs. S&P 500 averages despite solid growth drivers.
Investment Outlook:
Bullish above: $14.00–$14.50
Upside target: $21.00–$22.00, backed by expansion momentum, cost efficiency, and attractive valuation.
📢 EZPW — a growth story trading at value multiples.
#EZPW #PawnServices #ConsumerLending #LatinAmerica #ValueStocks #Investing
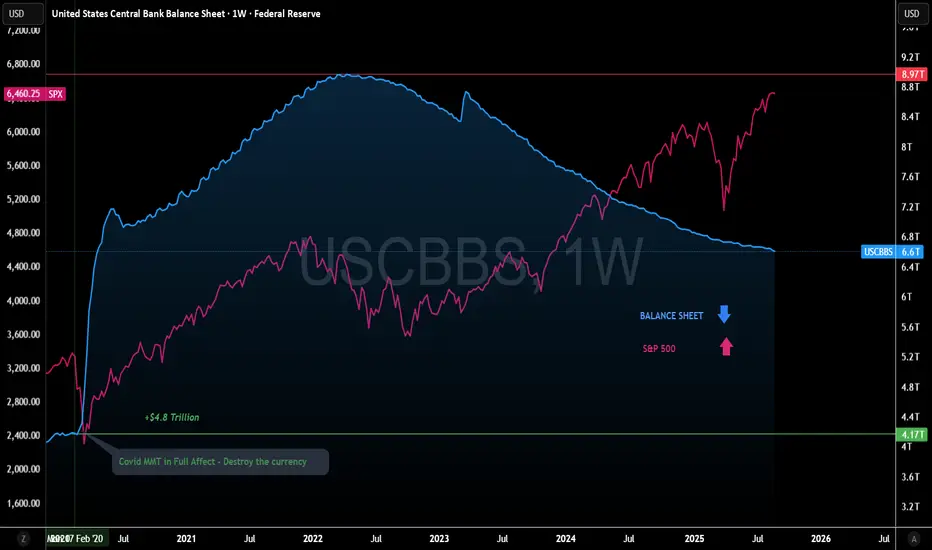
Federal Reserve Balance sheet vs SPXFed Balance sheet vs SPX
Its amazing to see the S&P500 breaking away from a long term correlation.
The Fed Balance sheet has shrunk from $8.97T to $6.6T but the markets have not been fazed.
Historically reductions in the balance sheet have resulted in markets selling off.
This time we are observing the markets trending higher.
Where is the liquidity coming from?
Is this time different?
Fannie Mae (FNMA) AnalysisCompany Overview:
Fannie Mae OTC:FNMA , the government-sponsored enterprise (GSE), plays a critical role in supporting the U.S. housing market through mortgage liquidity and stability.
Key Catalysts:
Q2 2025 support: Provided $102B in liquidity, helping 381,000 households—with over 50% being first-time buyers.
Earnings stability: Recurring guaranty fees ensure consistent revenue streams.
Capital strength: Net worth rose to $101.6B, highlighting robust capital buffers.
Tech partnership: New collaboration with Palantir enhances fraud detection & risk management, strengthening long-term earnings protection.
Macro headwinds: Higher mortgage rates and slower home sales remain challenges, but FNMA’s scale & systemic role provide resilience.
Investment Outlook:
Bullish above: $9.20–$9.50
Upside target: $18.00–$19.00, supported by housing liquidity leadership, capital growth, and risk-management innovation.
📢 FNMA — a housing backbone with strong buffers and growth optionality.
#FNMA #HousingMarket #GSE #MortgageFinance #Palantir #Liquidity #Investing
