Weekly Watchlist - 8/18 - 8/22 Top 3 - $CHWY, $LYFT, $YUM+BONUSThis is my weekly watchlist - solid setups going into this week.
Investing

S&P 500 Daily Chart Analysis For Week of August 15, 2025Technical Analysis and Outlook:
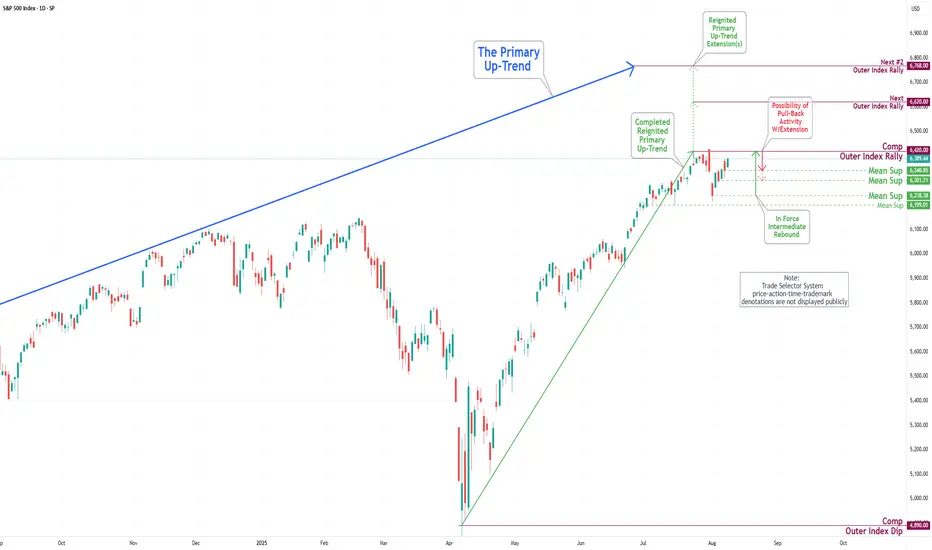
During the trading activity of the previous week, the S&P 500 Index exhibited a predominantly robust bullish trend, achieving a noteworthy marker by retesting the completed Outer Index Rally target of 6420, as outlined in last week’s Daily Chart Analysis. The primary objective now is to target the subsequent level, labeled the Outer Index Rally target, of 6620. On the downside, it is crucial to recognize that the current price movement is prone to retreat to Mean Support 6370 before the upward trajectory resumes.
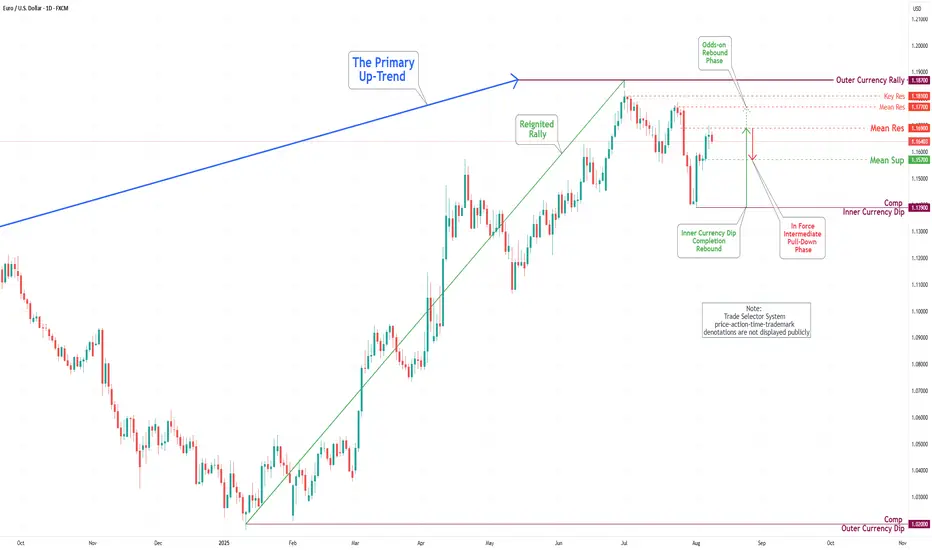
EUR/USD Daily Chart Analysis For Week of August 15, 2025Technical Analysis and Outlook:
During the last trading session, the Euro demonstrated a notable increase, retesting the Mean Resistance level of 1.169. Recent analyses suggest that the primary targets for the Euro are the Mean Resistance level of 1.177 and the Key Resistance level of 1.181, in addition to the Outer Currency Rally target of 1.187. Such movements may precipitate a considerable pullback before the upward trajectory resumes.

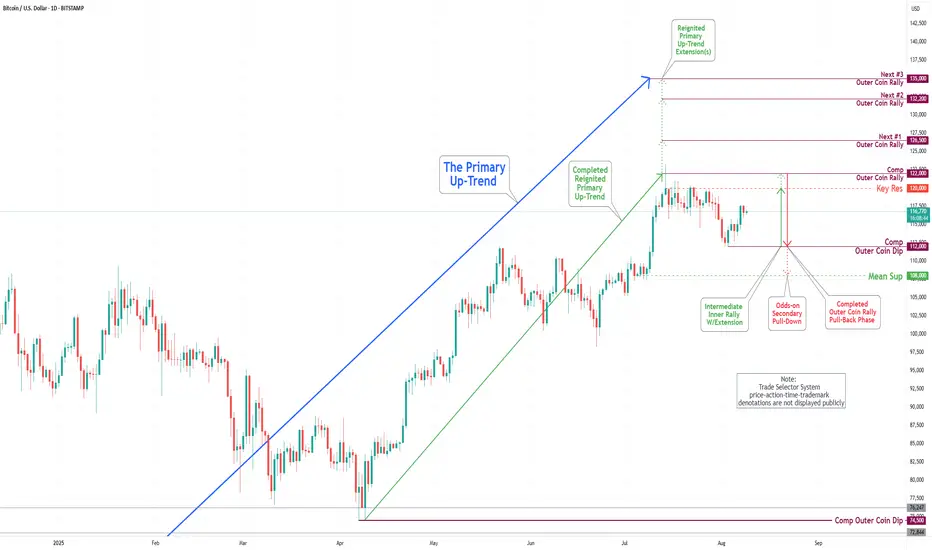
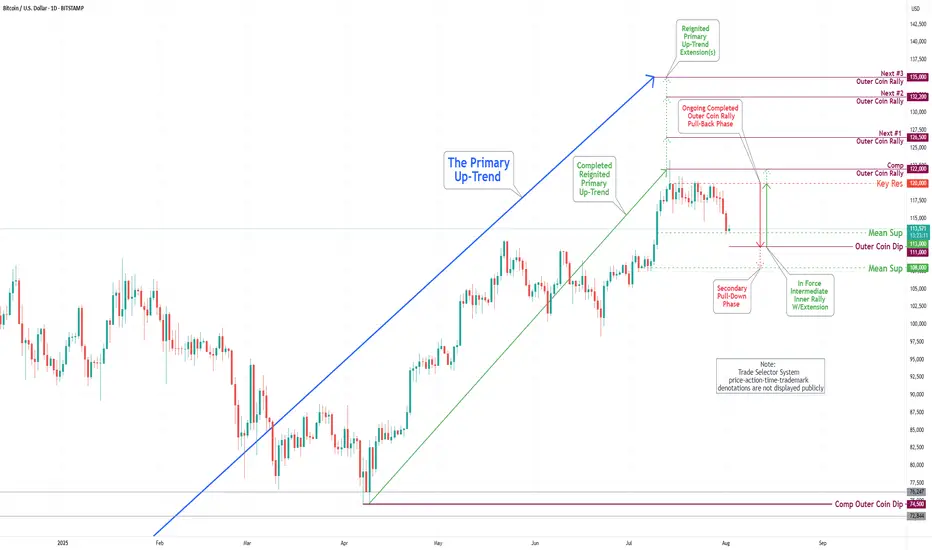
Bitcoin(BTC/USD) Daily Chart Analysis For Week of August 15 2025Technical Analysis and Outlook:
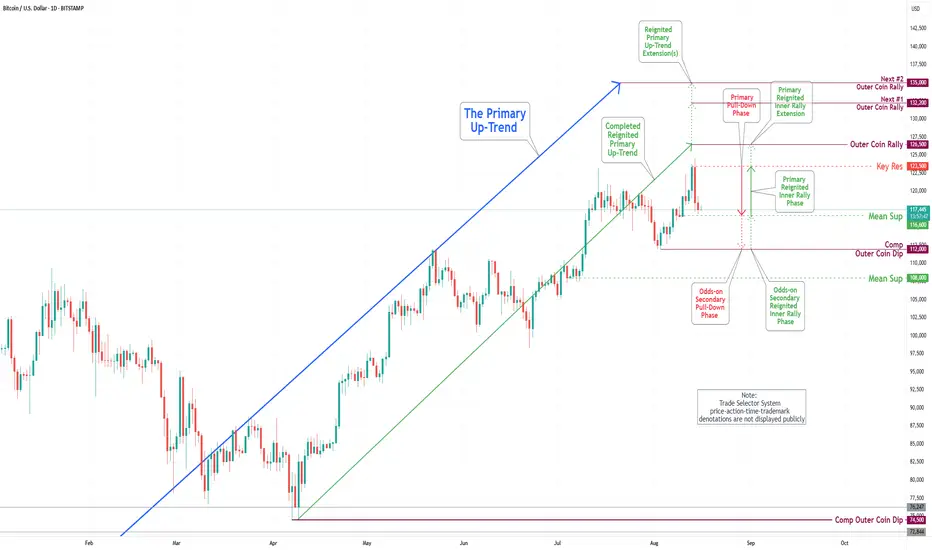
During the current trading session, the Bitcoin market has exhibited considerable volatility, marked by a notable retest of the completed Outer Coin Rally 122000 with a significant pullback to the Mean Support 116600. Current analysis suggests that the cryptocurrency may attempt to rebound from Mean Support at 116600, targeting Key Resistance at 123500. Furthermore, there is potential for this renewed rally phase to progress toward our next objective: Outer Coin Rally 126500. Conversely, a substantial pullback from Key Resistance 123500 is a high possibility before the upward trajectory continues.
Watchlist Wednesday - $SPY, $MS, $SMH, $ASPI, $XLC, $XLK, $SOFIWatchlist Wednesday - AMEX:SPY , NYSE:MS , NASDAQ:SMH , NASDAQ:ASPI , AMEX:XLC , AMEX:XLK , NASDAQ:SOFI

Eli Lilly (LLY) – Pharma Giant at a Key Price LevelHi,
Eli Lilly & Co. is one of the world’s largest pharmaceutical companies, founded in 1876 and headquartered in Indianapolis. It operates in over 125 countries and is best known for blockbuster treatments in diabetes, obesity, oncology, and immunology. Recent growth has been driven largely by its GLP-1 class drugs Mounjaro and Zepbound, which have quickly become industry leaders in the weight-loss and diabetes markets.
Recent Fundamentals (Q2 2025)
Revenue: $15.56 B (+38% YoY)
- EPS: $6.31 (beat expectations)
- Mounjaro sales: $5.2 B
- Zepbound sales: $3.38 B
- Full-year guidance: Revenue $60–62 B, EPS $21.75–$23.00
- Margins: Gross margin ~82.6%, net margin ~25.9%
- Profitability: ROE ~75.5%, ROIC ~29.6%
While fundamentals remain strong, the recent Phase III data for the oral weight-loss pill orforglipron came in below expectations, sparking a ~14% drop, the stock’s steepest one-day decline in decades. Analysts have since trimmed long-term sales forecasts for this product.
From a valuation perspective, the stock trades at a premium (~41× P/E, ~10.7× P/S), leaving little room for major disappointments.
Technicals
Technically speaking, the price has arrived in the zone where I’ve been patiently waiting to share it as an idea. This is a good area from where to start building positions if you’re interested.
There are quite a few technical confluence factors aligning here, but be ready to grab it also around $500 if the market offers it. Let that be your guide:
- If you’re not willing to hold long-term, don’t touch it.
- If you’re not willing to buy more at lower prices, don’t touch it.
Good luck,
Vaido

Numerico ( NWC) Nwc usdt Daily analysis
Time frame daily
Risk rewards ratio >2.5
Nwc is a weak asset but it is good for daily trading. Nwc is not good for investment but great for short time trading

ETHUSDTEthereum will definitely return from this price range to the target of $4000, the price range is the price retracement ($1428-$1125-$802).

S&P 500 Daily Chart Analysis For Week of August 8, 2025Technical Analysis and Outlook:
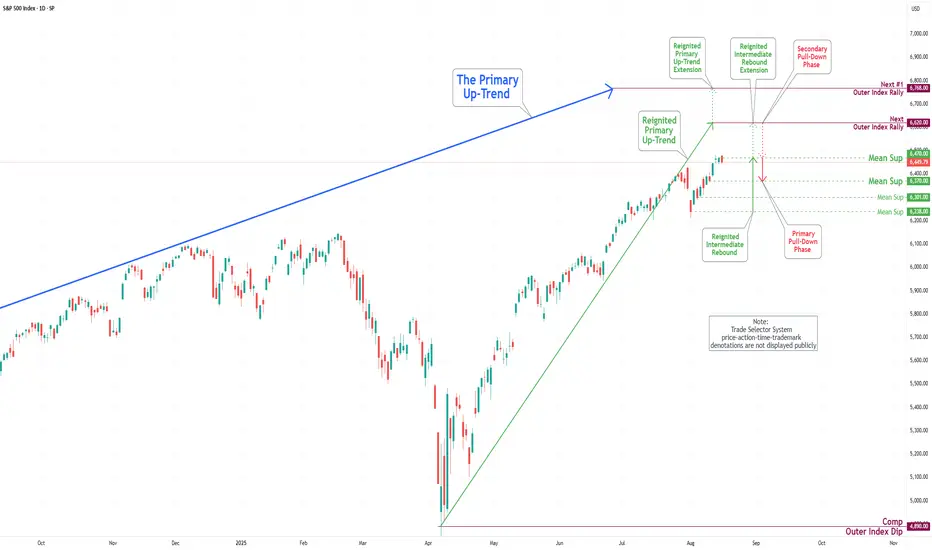
During the trading activity of the previous week, the S&P 500 Index exhibited a predominantly bullish trend and is poised to retest the completed Outer Index Rally target of 6420, as outlined in last week’s Daily Chart Analysis. The primary objective now is to target subsequent levels, specifically the next Outer Index Rally target of 6620 and beyond.
It is crucial to recognize that the current price movement may initiate a substantial pullback from the present price action, either before or following the attainment of the Outer Index Rally peak at 6420.
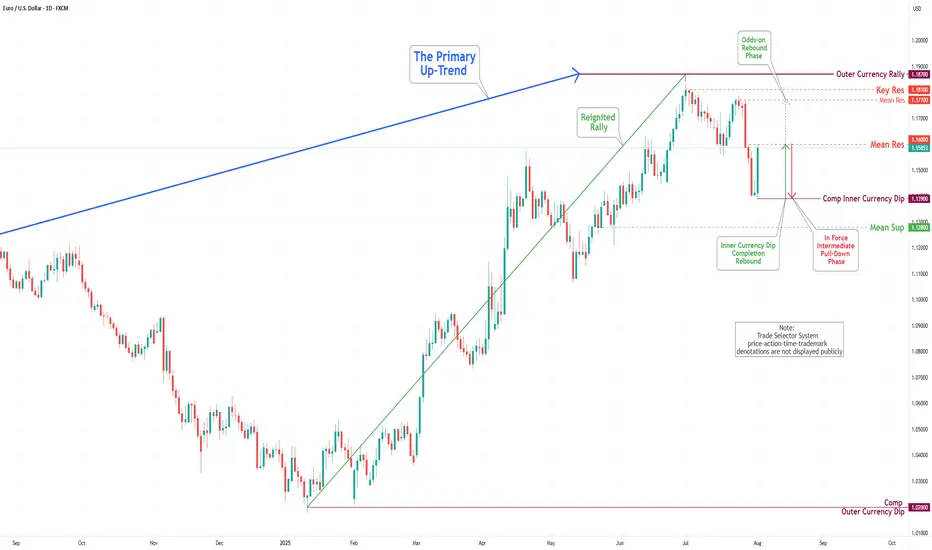
EUR/USD Daily Chart Analysis For Week of August 8, 2025Technical Analysis and Outlook:
During the current trading session, the Euro has exhibited notable volatility, marked by both a significant increase and subsequent decrease in value. Presently, it is approaching the Mean Support level of 1.157. Recent analyses suggest that the Euro is poised for a dead-cat bounce, potentially reaching the Mean Support level of 1.157, and revisiting the target set at the Mean Resistance of 1.169. Additionally, it is essential to assess the likelihood of continued upward momentum towards the Mean Resistance level of 1.177 and the Key Resistance level of 1.181. Such movements could instigate a substantial rebound and contribute to achieving the Outer Currency Rally target of 1.187.
Bitcoin(BTC/USD) Daily Chart Analysis For Week of August 8, 2025Technical Analysis and Outlook:
During this week's trading session, the Bitcoin market demonstrated significant resilience, recovering from our Mean Support level at 113,000 and completing the Outer Coin Dip at 112,000. Current analysis also suggests that the cryptocurrency is attempting to retest the completed Outer Coin Rally at 122000 and the critical Key Resistance level at 120000. Conversely, on the downside, Bitcoin may seek to revisit the completed Outer Coin Dip at 112000, with the potential to extend toward the Mean Support level of 108000 before continuing its bullish trajectory.
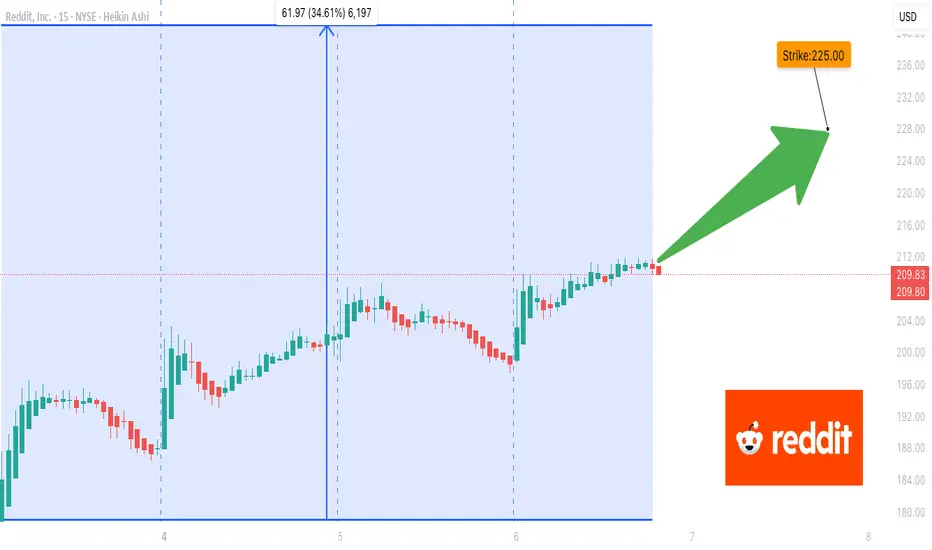
Smart Money Targets RDDT Calls – Are You In Before the Bang? ## 🚀 RDDT Options Signal: Bulls Loading Up Before Expiry!
**Only 2 DTE, But The Flow Is Screaming 📢**
📈 **\$225C @ \$0.86** — Risk Tight. Reward Clean.
🧠 Multiple AI Models Agree:
✅ Institutional Call Flow
✅ Bullish Weekly RSI
⚠️ Gamma & RSI Overheat = Manage Exit Timing Carefully!
---
### 🧩 Key Takeaways:
* Strong institutional flow backing the move 🔥
* Short-term risk? Absolutely.
* Reward? 50%+ if timed right ⏳
* Stop loss? Tight — don’t hesitate 🚨
---
### 💰 Trade Setup (Based on AI Consensus)
* **Strike**: \$225
* **Expiry**: 08/08
* **Premium**: \$0.86
* **Target**: \$1.29
* **Stop**: \$0.34
* **Confidence**: 70%
---
## ⚠️ 2 DTE — Trade Fast or Stand Aside
Not financial advice. This is flow-based probability.
Sometimes **opportunity hides behind time decay**. ⏳💥
---
### 🔖 Tags:
`#RDDT #RedditIPO #OptionsFlow #AITrading #TradingView #GammaRisk #BullishSetup #ShortTermPlay #WeeklyOptions #EarningsFlow`
S&P 500 Daily Chart Analysis For Week of August 1, 2025Technical Analysis and Outlook:
During the trading activity of the previous week, the S&P 500 Index displayed a predominantly bearish movement after completing our Outer Index Rally target of 6420, as highlighted in the prior week’s Daily Chart Analysis, with the primary objective now being to plug our Mean Support at 6200.
It is essential to recognize that the current price movement may trigger a significant further pullback to the Mean Support level of 6090. Following this downturn, it is expected that the index will resume its upward momentum, aiming for a retest of the Outer Index Rally peak at 6420.

EUR/USD Daily Chart Analysis For Week of August 1, 2025Technical Analysis and Outlook:
In this week's trading session, the Euro experienced a significant drop, reaching the 1.139 level, and completing what is referred to as the Inner Currency Dip. As a result of the completion, the currency reversed direction and made a strong rebound, hitting the Mean Resistance level at 1.160. Recent analyses suggest that the Euro is likely to enter a sustained downward move after retesting the Mean Resistance at 1.160, with the target set to revisit the completed Inner Currency Dip at 1.139. However, it is essential to consider the possibility of continued upward momentum towards the Mean Resistance level of 1.177. Such a movement could trigger a significant rebound and lead to the completion of the Outer Currency Rally at 1.187.
Bitcoin(BTC/USD) Daily Chart Analysis For Week of August 1, 2025Technical Analysis and Outlook:
In this week's trading session, the Bitcoin market experienced a notable pullback. The primary reason for this movement was the Key Resistance level, which led to a decline that reached our Mean Support level of 113000. This anticipated pullback is prompting the completion of the Outer Coin Dip target of 111000, with a strong likelihood of moving towards the Mean Support level of 108000.
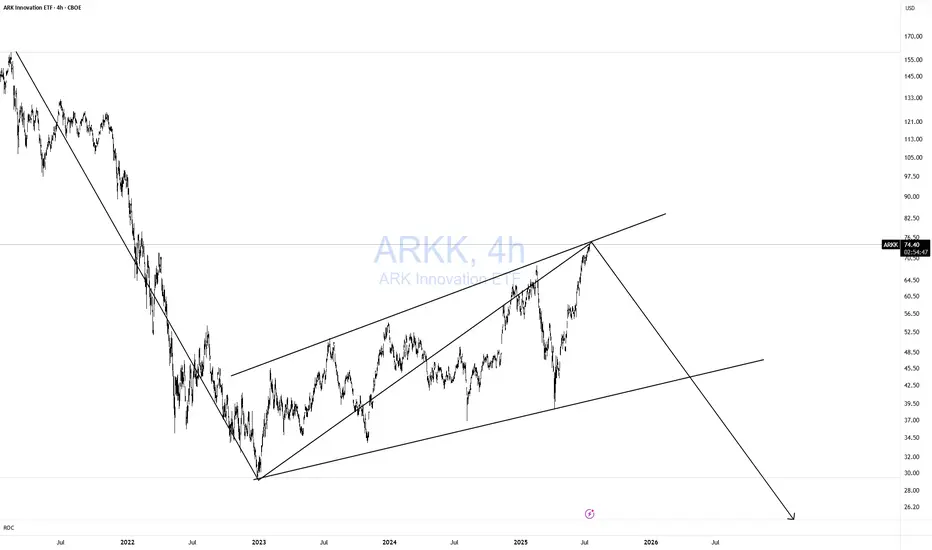
ARKK DOOMED!Classic 123 wave move down! As I like to say Short when no one else is looking! Not when everyone is looking. TOO LATE!
Simple but very effective pattern with excellent risk-reward. Remember, I am a macro trader, so don't expect to see a return on this investment tomorrow.
I won't get into the macro stuff.
You've Already Lost: The Bitcoin Delusion of FOMO and False HopeLet’s get one thing straight: if you’re staring at Bitcoin, squinting past the red flags, and convincing yourself it’s not a Ponzi scheme because of that one shiny feature that screams “legit,” you’re not investing—you’re auditioning for the role of “next victim.” And if your motivation is the fear of missing out (FOMO) or the fantasy of getting rich quick, well... congratulations. You’ve already lost.
The 99%: Red Flags Waving Like It’s a Parade
Let’s talk about the indicators—the ones that make Bitcoin look suspiciously like a Ponzi scheme. No, it’s not technically one, but the resemblance is uncanny:
- No intrinsic value: Bitcoin isn’t backed by assets, cash flow, or a government. It’s worth what the next person is willing to pay. That’s not investing. That’s speculative hot potato.
- Early adopters profit from new entrants: The people who got in early? They’re cashing out while newcomers buy in at inflated prices. That’s the classic Ponzi dynamic: old money out, new money in.
- Hype over utility: Bitcoin’s actual use as a currency is minimal. It’s slow, expensive to transact, and volatile. But hey, who needs functionality when you’ve got memes and moon emojis?
- Opaque influencers: From anonymous creators (hello, Satoshi) to crypto bros promising Lambos, the ecosystem thrives on charisma, not accountability.
- Scam magnet: Bitcoin has been the currency of choice for over 1,700 Ponzi schemes and scams, according to a University of New Mexico study cs.unm.edu . That’s not a coincidence. That’s a pattern.
The 1%: The “But It’s Decentralized!” Defense
Ah yes, the one redeeming quality that Bitcoin evangelists cling to like a life raft: decentralization. No central authority! No government control! It’s the financial revolution!
Except… decentralization doesn’t magically make something a good investment. It just means no one’s in charge when things go wrong. And when the market crashes (again), you can’t call customer service. You can tweet into the void, though.
FOMO: The Real Engine Behind the Madness
Let’s be honest. Most people aren’t buying Bitcoin because they believe in the tech. They’re buying because they saw someone on TikTok turn $500 into a Tesla. FOMO is the fuel, and social media is the match.
Bitcoin’s meteoric rises are often driven by hype cycles, not fundamentals. Tesla buys in? Price spikes. El Salvador adopts it? Price spikes. Your cousin’s dog walker says it’s going to $1 million? Price spikes. Then it crashes. Rinse, repeat.
This isn’t investing. It’s gambling with a tech-savvy twist.
The Punchline: You’ve Already Lost
If you’re ignoring the overwhelming signs of speculative mania and clinging to the one feature that makes you feel better about your decision, you’re not ahead of the curve—you’re the mark. And if your motivation is “I don’t want to miss out,” you already have. You’ve missed out on rational thinking, due diligence, and the ability to distinguish between innovation and illusion.
Bitcoin might not be a Ponzi scheme in the legal sense. But if it walks like one, talks like one, and makes early adopters rich at the expense of latecomers… maybe it’s time to stop pretending it’s something else.
INDEX:BTCUSD NYSE:CRCL NASDAQ:HOOD TVC:DXY NASDAQ:MSTR TVC:SILVER TVC:GOLD NASDAQ:TSLA NASDAQ:COIN NASDAQ:MARA

EUR/USD Daily Chart Analysis For Week of July 25, 2025Technical Analysis and Outlook:
During the previous week's trading session, the Euro experienced an increase following the completion of the Inner Currency Dip at the 1.156 level. It subsequently surpassed two significant Mean Resistance levels, namely 1.167 and 1.172; however, it reversed direction by the conclusion of the trading week. Recent analyses indicate that the Euro is likely to undergo a sustained downward trend, with a projected target set at the Mean Support level of 1.169 and a potential further decline to retest the previously completed Currency Dip at 1.156. Nonetheless, it remains essential to consider the possibility of renewed upward momentum towards the Mean Resistance level of 1.177, which could initiate a preeminent rebound and facilitate the completion of the critical Outer Currency Rally at 1.187.

TSLA Honey Ticking Bull Trap! UPDATE 1This is an updated chart, as I keep being prompted to reach "My Target" by TV.
No matter how bad things get for Elona and TSLA, there are always people who are willing to pile in and buy at any price. The problem is the chart is showing lower highs, as TSLA no longer attracts the people needed to boost price, just like TSLA the brand. As a result, people keep getting honey ticked.
Don't Get HONEY TICKED!
As I always say, never EVER!! Invest in toxic people like Elona. They always blow themselves up in the end. It's in their nature!
Click Boost, Follow, subscribe, and let's reach 5,000 followers. ;)

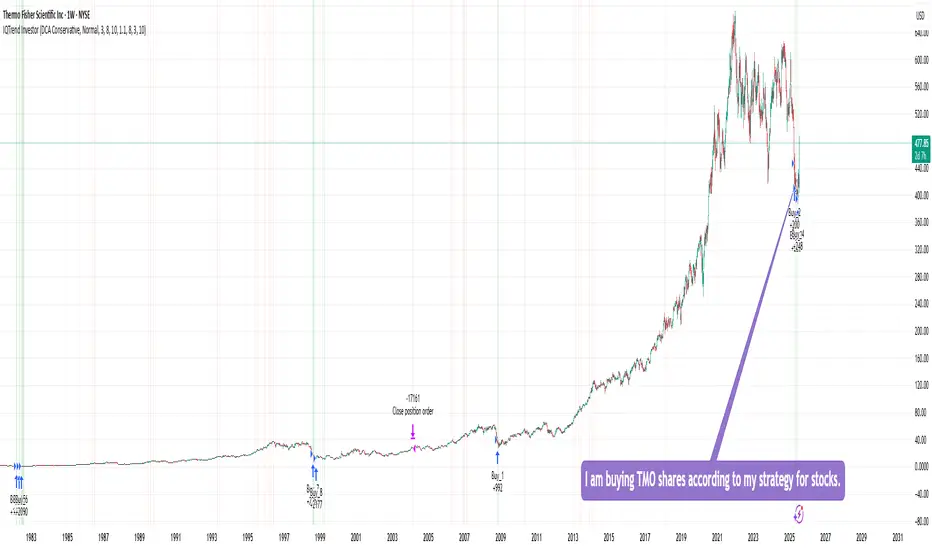
Buying TMO sharesI am buying TMO shares according to my strategy for stocks, ETFs, and precious metals.
This strategy shows 100% performance on this stock on a weekly timeframe. Therefore, I am investing a small percentage of my deposit in it and will wait for it to perform. I hope that everything will work out this time too :)
Of course, the price may go even lower, but I will buy more if the strategy shows a buy signal. In the long run, I think there will be an excellent profit.
DYOR
STOXX50: Still at good place for buysHello,
The Eurostocks 50 is in a bullish correction forming an expanding triangle pattern. We still see an opportunity for investors who missed the entry at the bottom of the correction to join the risk averse trade once we have a strong breakout of the corrective pattern. The STOXX50 is coming close to the moving average being a further confirmation that we are setting up for an upwards move.
To reinforce our bullish bias, the MACD is showing signs of a zero bullish crossover. We remain aligned with our target of Eur 5980 on this.
Disclosure: I am part of Trade Nation's Influencer program and receive a monthly fee for using their TradingView charts in my analysis.

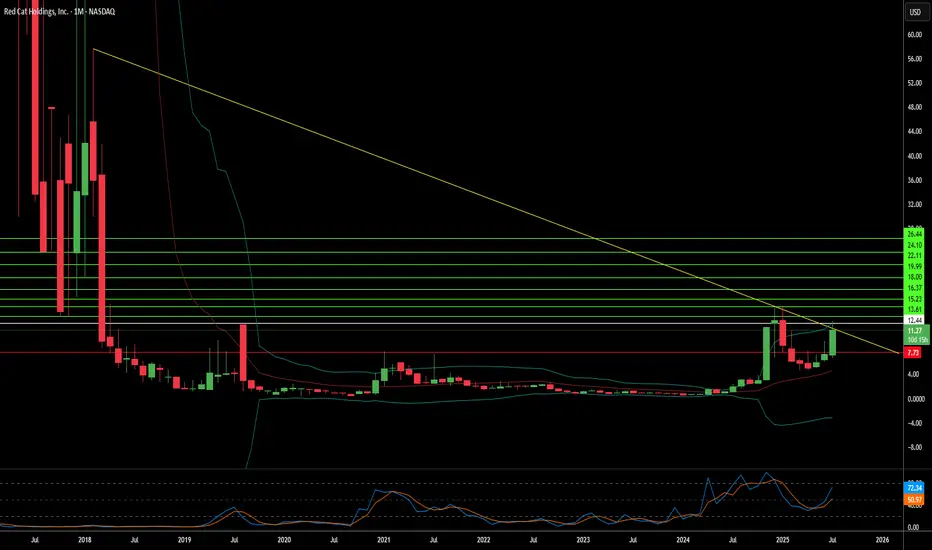
Is Red Cat Holdings a Drone Industry Maverick?Red Cat Holdings (NASDAQ: RCAT) navigates a high-stakes segment of the burgeoning drone market. Its subsidiary, Teal Drones, specializes in rugged, military-grade uncrewed aerial systems (UAS). This niche positioning has attracted significant attention, evidenced by contracts with the U.S. Army and U.S. Customs and Border Protection. Geopolitical tensions, particularly the escalating demand for advanced military drone capabilities, create a favorable backdrop for companies like Red Cat, which offer NDAA-compliant and Blue UAS-certified solutions. These certifications are critical, ensuring drones meet stringent U.S. defense and security standards, differentiating Red Cat from foreign competitors.
Despite its strategic positioning and significant contract wins, Red Cat faces considerable financial and operational challenges. The company currently operates at a loss, with a net loss of $23.1 million in Q1 2025 against modest revenues of $1.6 million. Its revenue projections of $80-$120 million for 2025 underscore the lumpy nature of government contracts. To bolster its capital, Red Cat completed a $30 million equity offering in April 2025. This financial volatility is compounded by an ongoing class action lawsuit. This lawsuit alleges misleading statements regarding the production capacity of its Salt Lake City facility and the value of its U.S. Army Short Range Reconnaissance (SRR) program contract.
The SRR contract, which could involve up to 5,880 Teal 2 systems over five years, represents a substantial opportunity. However, the lawsuit highlights a significant discrepancy, with allegations from short-seller Kerrisdale Capital suggesting a much lower annual budget allocation for the program compared to Red Cat's initially intimated "hundreds of millions to over a billion dollars." This legal challenge and the inherent risks of government funding cycles contribute to the stock's high volatility and elevated short interest, which recently exceeded 18%. For risk-tolerant investors, Red Cat presents a "moonshot" opportunity, contingent on its ability to convert contract wins into sustainable, scalable revenue and successfully navigate its legal and financial hurdles.
S&P 500 Daily Chart Analysis For Week of July 18, 2025Technical Analysis and Outlook:
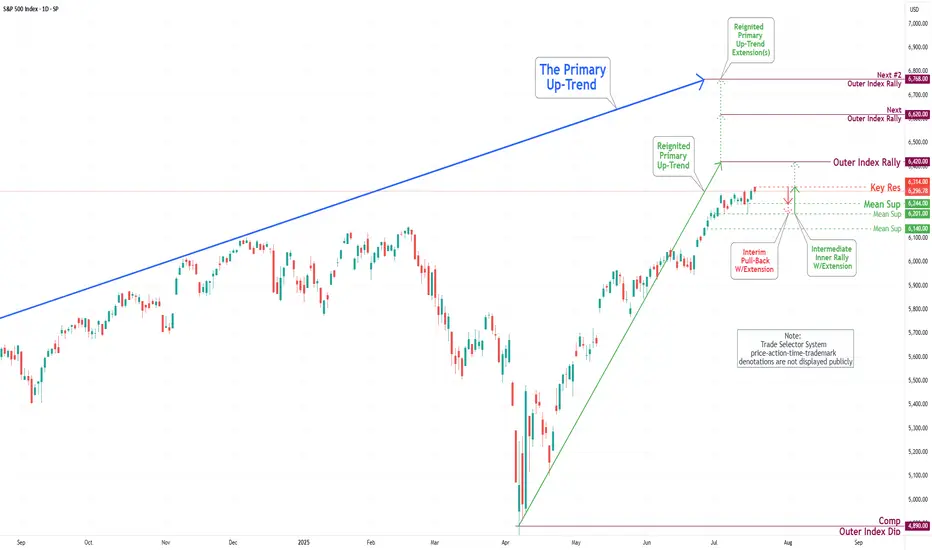
During the current trading week, the S&P 500 Index has demonstrated a predominantly upward trajectory. It has successfully retested the Mean Support level at 6200 and established a new Key Resistance level at 6314. Currently, the index displays a bullish sentiment, with the objective for the Outer Index Rally set at 6420.
Nevertheless, it is essential to recognize that the current price action may result in a decline, potentially leading to a retest of the Mean Support at 6244 and extending to the Mean Support at 6201. Following this potential downward movement, it is anticipated that the index will resume its upward trend, driving the price action towards the Key Resistance level at 6314 and ultimately achieving the Outer Index Rally target of 6420.