IOTA Potential Long tradeIOTA seems to be forming a pattern here
RSI seems to be bouncing off the trend line
Every time IOTA closes above the trend line(White) it pumps to +30%
SBS indicator yet to signal BUY
BUY - wait for the price to closes above Trend Line (White) and above EMA 21
Targets are on the chart
SL -5% of buy-in or below last support
This trade mite take time to develop
Iotabtc

IOTA to the MOON ! 27.04%Are you ready to make money ? :-D
I think there is a good support at this price level, so we will see after some hours/days how it will move...
What do you think about that?
Feel free to leave your comment to discuss and share information with crypto community ;-)
NB : I share informations in a neutral way, I don't offer any investment advice on specific currencies, or initial offers, and does not encourage anyone to enter what may appear to be investment advice, and then completely disclaims any liability for any investment decision made by the reader.


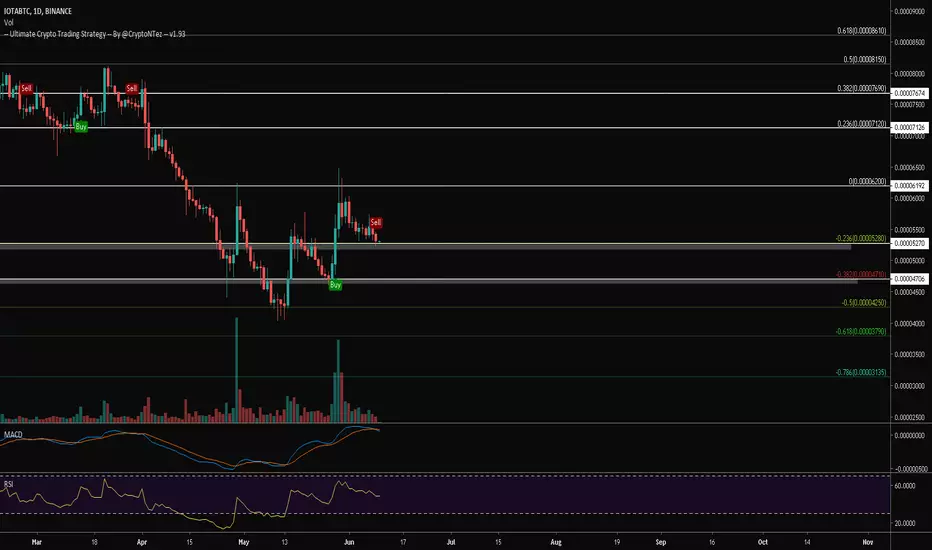
$IOTA Reached support at ~5270sats w/ decreasing volume...$IOTA Reached support at ~5270sats w/ decreasing volume...
Last iteration with this level went no good..
UCTS Flashing sell signal on the 1D
MACD just bearish cross
Not hodling this level would mean a new drop to 4700sats (10%)
Protecting your capital is your 1st priority
#IOTA
IOTABTC BINANCEIOTABTC formed inverted head and shoulder and reached the target of 43% over long period.
Currently, it is testing support at lower Fib level and soon it may break and reach multiple TP's as listed on chart.
Major resistance is 50% Fib level which would take another few weeks to reach over there, so holding coin is good for a couple of weeks.

#IOTABTC #IOTA BTC BAT PATTERN UPDATEPlease follow BAT PATTERN we will see which way we go on
Please follow me for more drwaings and please push like button
Thank you


Iota TAI believe Iota will bounce back against a former resistance then find support on old resistance to jump it to higher highs.


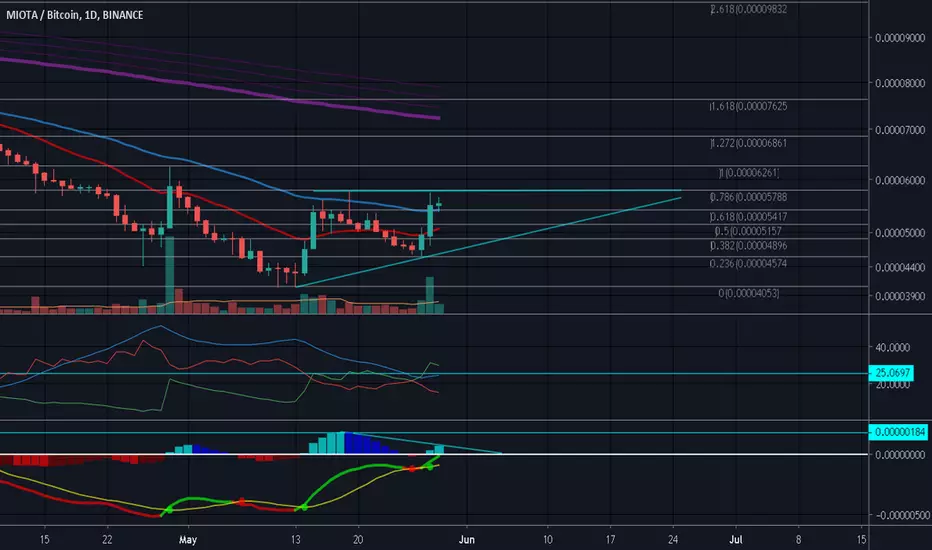
$IOTA - Breakout Decision Time?IOTA has broken above my trendline. Confirmation has not occurred yet as we need to see the next move.
MACD with a bullish crossover
RSI holding trend so far
Current push has came close to 55 EMA as resistance
STOCH looking like we may re-test this trendline for confirmation

$IOTA Looking strong here... Lot of bullish news around$IOTA Looking strong here... Lot of bullish news around
UCTS Buy signal active on the 1D since May 28
Volume strong & healthy
RSI near overbought values
Showing some resistance at 5.9k sats, breaking above should unleash another big leg
#IOTA

IOTA...looking bullish!!IOTA is looking bullish on some indicators on the daily Binance chart! RSI, STOCH and MACD creating higher highs! OBV at a high point! Your opinions are welcome! Thanks


IOTA/BTC looks good.IOTABTC is made a higher low for quite a while
DMI : DMI+ is rising, slightly down from yesterday (28may) while DMI- is still down create a range between each of them which is good for bullish trend for now. keep in my the DMX is still not confirm this is a strong bull momentum yet (below 25)
Macd : still expanding it's buyer volume while it's still lower than previous buy volume which is higher.. creating exaggerated bearish divergence until it invalidated if the buyer volume could be higher than the previous high.
Volume MA still neutral although there's a spike of buy volume yesterday (28may)
if it's remain above current trend line it's good sign for bullish momentum to developed.
$IOTA Support Found for Bounce or Sideways Action?$IOTA looks to be fueling for a greater move north. In consideration to many alt charts, $IOTA may be towards the front of the pack for the upcoming race?

posible H-C-H en IOTA/BTC iota ha tenido buenos fundamentales recientemente y hace no mucho toco minimos historicos en el iota/btc de binance, desde entonces el precio a venido subiendo y en los proximos días podria dar un rally al alza importante con lo que parece ser un H-C-H en graficas de un día, todavía necesita confirmación, pero parece ser que podría tener buenas ganancias los proximos días.


IOTA primed for a moveQuick TA on IOTA
Indicators:
DI crossover signalling trend reversal
MACD crossover as well
Stochastic trailing behind
Primary focus would be strong volume and breakout to the upside from the inverse H&S neckline.
Look out for ADX momentum to come in (>25) as well as Stoch above 80. Volume is still weak so it will take sustained volume to keep price momentum upwards.
At the moment, still seems like a fakeout is possible and just a completion of an inverse Elliot Wave. If indeed a breakout occurs, the 200MA (in red) would serve as the strongest resistance.

$IOTA first target 6.200 sat then 7.000 sat$IOTA first target 6.200 sat, visiting daily 100 ma and might test trendline. 2nd target 7.000 sat!

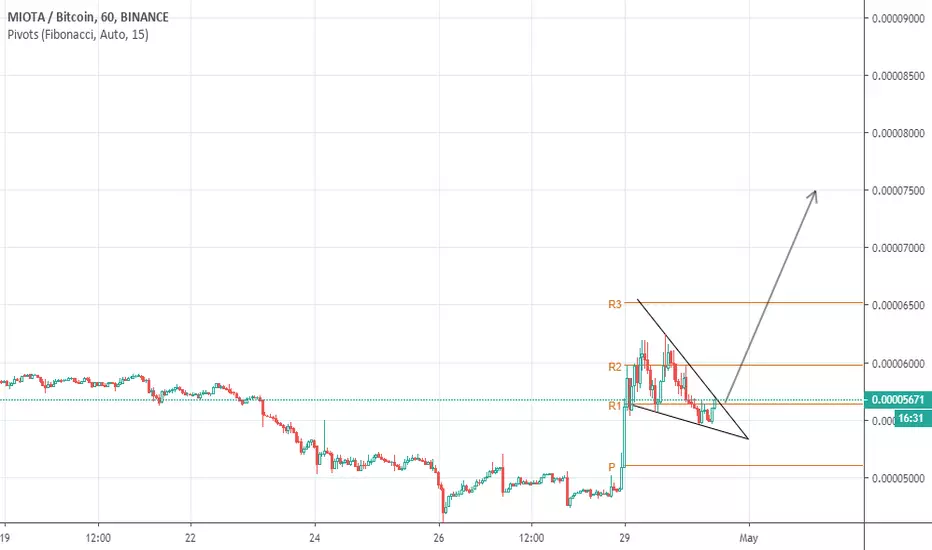
Miota/Bitcoin (29 May) #IOTA $IOTA #BTC $BTC#BUY #WAIT
Current price : 5300
Buyzone : Buy close to 5000 as possible
Sellzone : 6200-8100
Stoploss if price is lower than 4500

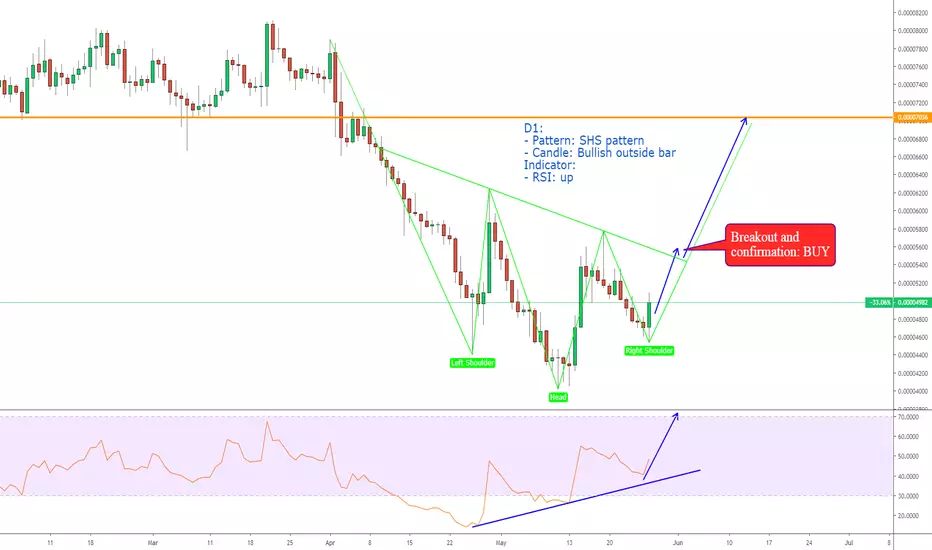
IOTABTC, SHS pattern on D1.D1:
- Pattern: SHS pattern
- Candle: Bullish outside bar
Indicator:
- RSI: up
IOTABTC BINANCE IH&SIOTABTC is forming an inverted head and shoulder for long term holders. Please note that this may change based on mother BTC coin.
Best time to enter IOTA is near right shoulder and expect a breakout near the neckline with 35% profit reaching target 7400- 7600 sats
