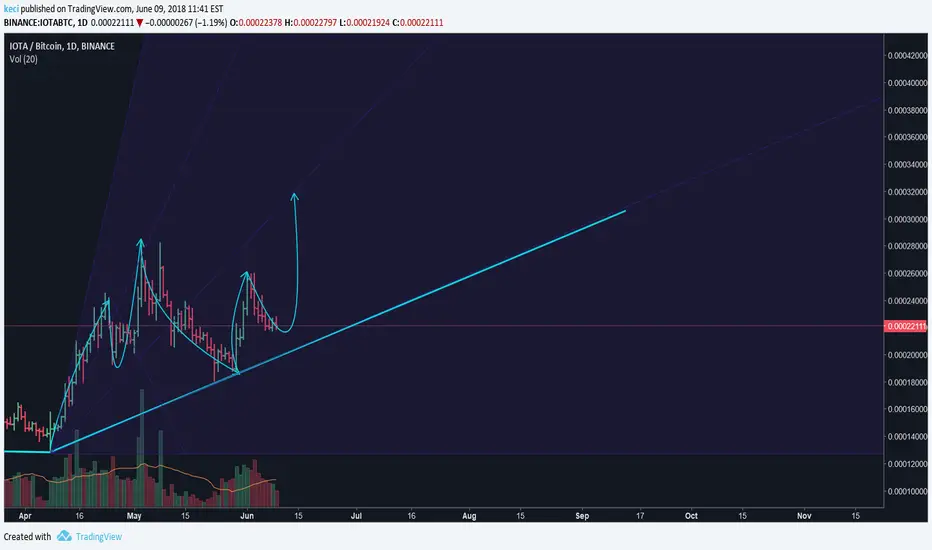
$IOTA #IOTA - FLAGS - third HUGE flag in a row??? 4th next??Hello Lads and Ladies,
Today we are taking a look at IOTABTC - the 9th most capitalised coin in the whole market. We are going to look at the very interesting structure and the possibilities we have now with IOTABTC.
First of all, we are seeing a very huge push from 14000 satoshi to 24000 satoshi about two months ago. After this push a very interesting and predictable structure has started. Fibonacci retracement lines are as well very well respected.
So, here is what happened and what we see.
A push starts and forms a double top at its top, in the second step it basically crashes straight down, forms a double bottom at the bottom and starts a new very strong push again, where at that top it forms a double top again and after doing that it crashes again. We have already seen that 3 times and the big question is how many more times is that going to happen again?
I have to add a very strange fact that I recognise in the IOTABTC chart. If you take a very close look, you can see that the first double bottom was exactly at the 50% fibs line, the second was exactly at the 61.8% fibs line, the THIRD one seems to be forming at the 78.6% fibs line - based on that, are we going to see the fourth double bottom at the 100% fibs line?
The same decrease is also seen with the double tops. The second double top was formed at a very strong resistance and support line of IOTABTC above 0% fibs line, so if you inverse it to would be the 23.2% fibs line, the third double top has been formed at the 0% fibs line, so based on that decrease are we going to see the next double top being formed at 23.6%??
I strongly believe that we are going to see a double bottom formed on the 78.6% and then see a huge push again. Nevertheless, I do not believe that we are going to see a fourth flag forming by following the same rules as sated before. This would be TOO predictable and this normally does not happen. I would still keep this possible structure in mind just watch the chart what it does and where we are heading to.
I am actually more seeing this decreasing double top resistance being broken and the push continuing towards 26000 or even 28000 satoshi. ANYHOW, I will first watch IOTABTC very closely and look for the double bottom. This double bottom might be very narrow, because the double top was very narrow as well and there is not a lot of space left between the current position and the blue dotted flag resistance.
It seems like we have touched very shortly the 78.6% fibs line and going up, taking a look at RSI, we should go up to about 50 points, fall down below 35 points and then start the push. Again, this might happen very quick. If you are not into watching the chart the whole time and believe in this structure repeating jus put a buy order at 17300 and chill. Should this structure actually happen agin towards the anticipated resistance, then that would be around 40% gains within this week.
Nevertheless, this might be nothing and we are going to move sideways or head even more down - you should always keep that in mind, that big negative days are actually a thing in this market. But then speaking of the market, like we have seen not only one bloodbath day, so we will most likely see not only one day where all coins just go straight up within a few hours.
Like and Follow me and you will find this page interesting because I am a TA expert and day trader that does daily updates and new posts about the hottest and most discussed coins.
Fell free to request TA for ANY coin you are interested in!!!
Cheers, Tomas
Iotabtc

IOTA - Bullish BatMy plan:
1) wait for 14770 sats
2) buy 14470 to 13000 sats.
3) stop under 13000 sats :)
#YTD
#DYOR

IOTA - Falling Wedge within Symmetrical TriangleFalling wedge starting to form, indicating a reversal with the bottom of the symmetrical triangle acting as support.


IOTA: From Bear To BullIOTA Has finished wave 1 according to my elliot wave count.
A falling wedge has formed which is a bullish fractal and can confirm the trend reversal once a breakout happends.
We can expect an impulsive wave 3 these coming months.


IOTA READY TO BREAK OUT OF THIS PATTERN? - CryptoManiac101IOTA is a great coin with new partnerships, however pattern we are working has is not an easy one in current market. According to this particular pattern we have over 60% probability to see upward break, however if Bitcoin remains under $6,500 we will see a possible downward break.
Recommendation
Investors looking for safe entry, wait for firm break, then do tight Stop Loss.
Current investors should set SL at rising line with rebuy order at demand zone thereafter.
Please remember that only firm break counts. We have many false breakout this year, so don't do automatic SL.
We are neutral on this trade until Bitcoin goes into recovery.
Enjoy this trade my Crypto Maniacs, but remember to invest only what you can afford to lose or you're going right back to poverty on drop. We are not your financial advisors.

IOTAMoving in triangle. IOTABTC touch support line and dont break, now need go to the resistance line

#iotaHello Every One .. Iota is Inside A Pattern If Break the pattern can Start Moving To target Pls if you want Buy try to buy near entre Price


[IOTA/USD] IOTA IS IN DANGER ZOON?H&S Pattern is being formed.
Right shoulder has been formed, from here we should see a downtrend in price.
My Targets are Dotted lines.
As always this is my trade opinion.

IOTA. Anybody needs internet of things?Coin of the day is IOTA.
While Bitcoin is falling and dragging markets behind him, It is a good time to consider blockchain technologies which could contribute to future by not replacing fiat money.
IOTA is an ambitious project that was founded in 2015 by David Sønstebø, Dominik Schiener, Sergey Ivancheglo.
In a blog post discussing IOTA’s roadmap, David Sonstebo, co-founder of cryptocurrency, wrote that it was developed to enable the “paradigm shift” to the Internet of Things by establishing a “de facto standardized “Ledger of Everything.” Simply put, this means the cryptocurrency will enable data exchange between sensor-equipped machines that populate the Internet of Things.
The Internet of Things is a glamorous buzzword, but there is less and less doubt that soon in our smart houses toasters will communicate with each other. Good examples are given in the Reddit post:
"For example, you might be able to scan the code at the bottom of your milk carton and have it delivered to your door from Amazon using IOTA funds. Again, this is not possible with bitcoin because of its high transaction costs and network delays."
"Or a vending machine, in which you would normally use your credit card gives the option to pay with iota as it saves Pepsi or Coke-Cola the overhead of authorizing transactions through the Visa or MasterCard network. This cannot be done with bitcoin because of transaction speed. additionally, because of the financial framework the cryptocurrency provides..."
IOTA does not use the traditional blockchain design used by most cryptocurrencies. Instead, it has developed a new platform called Tangle, which uses a mathematical concept known as Directed Acyclic Graphs (DAG). For its transaction to be valid, each node in a DAG Tangle must approve two previous transactions at other nodes. This has two consequences. First, it removes “miners” as entities to validate transactions, thereby eliminating a possible bottleneck when transaction speed and numbers are high. Second, the network’s growth and speed become directly proportional to the numbers of its users.
In Aug 2017, a team at MIT published an article detailing their investigation into IOTA. The IOTA team developed their own cryptographic hash function which was discovered to have vulnerabilities involving different inputs hashing to the same output, which should never happen.
Neha Narula, director of MIT’s Digital Cryptocurrency Initiative, wrote:
“Once we developed our attack, we could find collisions using commodity hardware within just a few minutes, and forge signatures on IOTA payments,”
IOTA later rectified the problem.
Latest news
Bitpanda announced that they are planning to list of IOTA on 14 June.
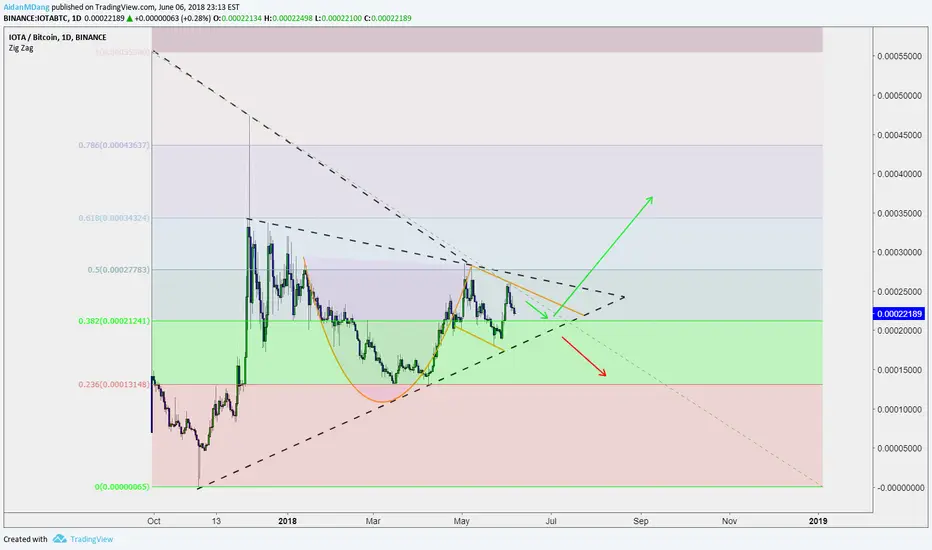
Technicals
Overall pattern on the chart - correction of the 2017.12 peak, though since 2018.05 coin attempts to break free from the correctional bias. March - April uptrend peaked not reaching 0.0003 psychological level. Throughout May the coin was stagnating and now showing bottoming patterns at the 0.0002 support level. Lately, the price came to the intersection of three support factors: 0.0002 psychological support, Global Bullish Trend Line, and 100-days EMA. Nonetheless, the overall pattern still looks bearish; buy-in should be considered if the price will show consistent upward momentum and rise above Bearish Trend Lines (orange lines on the chart) and 0.00021.


I O T A continuingIOTA/BTC divergance between Commodity Channel Index and real price action.
Short-term (till 1.5 week)
Enter
now - 0.00023.4
Target
0.000196 - 0.000182
Stop
0.000245

Iota shortsTargets
1- 0.00020415
2- 0.00018926
3- 0.00017225
Bearish big trend. Positional trade, which takes time.

IOTA Potential long setupPrevious setup made some gain, now continue to grab the opportunity and been patient till correction is over. Miss the falling wedges breakout trade but there always a retracement and REMEMBER it.
TA:
- Golden ratio zone
- Formation of 3rd of 3rd subwave
TP:
-1:1 for 3rd wave (never the shortest wave)
- Previous high with around 1.27% extension
- Break previous high for 1.618% extension
- Conclusion:
RR is resonable as long my count (2) is holding well
TRADE with RISK MANAGEMENT!!!
I am an individual trader, based on personal analysis.
Welcome to share your ideas and let's improve i

IOTA Cup and Handle/Symmetrical Triangle IOTA has formed a Cup and Handle Pattern as well as a Symmetrical Triangle Pattern on the daily chart.
I have always been bullish on IOTA as it unique from most Cryptocurrencies in the sense that it uses Directed Acyclic Graph technology as opposed to using Blockchain.
Since each user of the IOTA network has to verify two transactions before theirs is verified, scale ability is unlimited because the network gets faster the more users there are (as opposed to blockchain where more users on the network can slow it down).
If IOTA follows and breaks the Cup and Handle Pattern, and breaks the upper resistance of the triangle, we should see IOTA take off.
IOTABTC - A Chance To Find Support Before A RallyPosting about a series of Alt Coins that follow my relatively straightforward criteria these days for when Bitcoin is in a slide. The four parameters are:
1. Above the 50 day MA (RED).
2. Above the 9 day EMA (Orange).
3. Above 50 RSI - Even better if Above 60 RSI .
4. Positive trend in MacD .
Coins already meet the parameters include VEN ONT BNB and EOS. ZIL will join them soon, as will WTC.
IOTA has an opportunity to be a perfect example of why I am confident when coins meet these parameters.
The problem: Will IOTA continue to retrace down?
My prediction - No.
Why? There is a reason why my parameters are what they are. I like multiple day/week long swing trades and I am relatively risk adverse. I like to buy a coin after its passed known resistance, when its bullish on the MacD and when its bullish or about to be bullish on RSI . I like to know that I have support close below my purchase price in the form of the 9 Day EMA and the 50 Day MA. Here, the price is currently finding support on the Fib Retracement level and is just below the 50 day MA. The 9 day EMA recently provided support on 5/30. Until a a candle closes below both the 9 Day EMA and the 50 Day MA, I see no reason to think it will continue to fall.
How to play it: If not already holding, then wait to confirm the RSI bounce off the 50 and wait for the price to climb back above the 50 Day MA and possibly 9 Day EMA . I was holding and took profit above 25000 so I too am trying to find the right time to buy back in as well. The initial target will be top of the triangle pattern at around 25000, and then focus will be on the potential breakout which would create a new target of 28000 and require reevaluation.
If the current candle does not climb back above the 50 day MA and above the 9 day EMA, then the RSI is unlikely to bounce on the 50 RSI and we will likely see a further drop in price which I do not want to be a part of.

IOTA correction down to 1.5$ rangeIOTA had a massive move up due to the recent new.
Like they say buy the rumour and sell the news
IOTA is doing ABC zigzag now. Wave A is almost finished, expecting a bounce soon to complete wave B and then a final 5 waves down to finish off C leg.

IOTA wave 3/5hi
IOTA showing high probability of upwards action
market sentiment is positive for IOTA as well as BTC showing bullish divergence
thank you for the likes :)


IOTA ZIG ZAGWe can try to short IOTA till 1.64. 1. 64 is the 0.5 retracement of AB … 5-0 reversal pattern. This is more than an hypotesis.. there is a nice support there. I think that we could reach 2.20 after that.
Wait for confirmations and always a look at what bitcoin does..
You can see in an old idea that we are again at resistance against ETH and BTC.
