USDJPY bullish setupHarmonic ABCD pattern 4 hour
Trend reversal with RSI div at 1 hour
Support at fib 0.382
RRR > 1:3
Risk 1-5%
Japaneseyen

Final Target yet to be run on CHFJPYThis inverse Head and shoulders has produced fantastic gains already
What suggests that final target will be met
is that Yen vs other crosses is still yet trigger their respective necklines!
I assume more madness to come from the #BOJ in the next Financial Panic.
Like the Bank of England another Island nation probably first to embark on a new wave of #QuantitativeEasing

USDJPY Channel Up is pulling back in search of a bottom.The USDJPY pair has been trading within a Channel Up pattern since the April 22 market bottom. Right now it is on its latest Bearish Leg, correcting the rally that priced the Higher High, in search of a bottom (Higher Low).
The last pure Higher Low was priced exactly on the 1D MA100 (green trend-line). We expect the price to bounce either on the 1D MA50 or on the 1D MA100, which means for traders that they can allocate the risk (lots) evenly on those entries. The Target is the 162.000 Resistance.
---
** Please LIKE 👍, FOLLOW ✅, SHARE 🙌 and COMMENT ✍ if you enjoy this idea! Also share your ideas and charts in the comments section below! This is best way to keep it relevant, support us, keep the content here free and allow the idea to reach as many people as possible. **
---
💸💸💸💸💸💸
👇 👇 👇 👇 👇 👇

$USDJPY Short Position - Target 152 YenUSDJPY seems to be breaking support for positive volume. If it breaks support, it might retrace back down to at least 152 yen. The bollinger bands and the last 24hr volume is telling. As always, none of this is investment or financial advice. Please do your own due diligence and research.

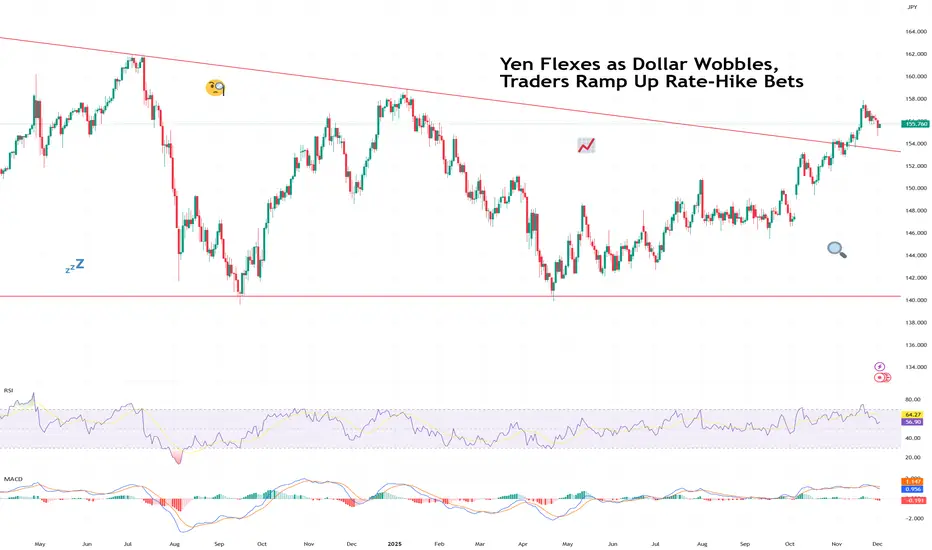
Yen Flexes as Dollar Wobbles, Traders Ramp Up Rate-Hike BetsThe yen came into Monday looking calm… and then proceeded to bench-press the dollar.
The FX:USDJPY pair slid under ¥155, hitting a session low of ¥154.65, after BoJ Governor Kazuo Ueda dropped one of the most powerful phrases in global FX:
“We will weigh the pros and cons of tightening.”
In Tokyo-speak, that’s basically suggesting “rate hike incoming!”
The greenback instantly shed over 100 pips (every day trader’s dream), a half-percent haircut that reminded traders just how exquisitely sensitive the yen is to hints of policy change after 30 years of ultra-loose money.
The next day, however, was a bit different. Early Tuesday morning, the pair gained back about half of what it lost the day before. Still, some things to note about Monday's slide:
It wasn’t just FX that reacted. The yen’s surge:
Knocked the Nikkei FX:JPN225 down 2%,
Pushed Japanese government bond yields to 17-year highs,
And forced traders to reprice Japan’s entire risk landscape in real time.
🕰️ The Market Has Been Waiting for This Moment
FX traders have been staring at the FX:USDJPY for months, waiting for a sign — any sign — that Japan was finally ready to pivot. In the meantime, officials have made a sport out of verbal interventions:
“We are watching FX moves with urgency.”
“We will not tolerate excessive yen weakness.”
“We have tools, and we are not afraid to use them.”
Translation: Stop shorting the yen, it stresses us out.
With Ueda openly weighing a rate hike at the December 19 Bank of Japan meeting, traders are scrambling to unwind one of the most crowded trades in global macro: the “short yen” position.
A country that’s really truly reluctant to raise rates is suddenly hinting at liftoff — or at least a step towards it.
📉 Dollar Wobbles as Macro Crosswinds Build
While Japan is drifting away from negative-rate territory, the US dollar faces a catalyst-packed December that could amplify or counter the yen’s breakout.
Four major US data releases stand between now and the BoJ’s meeting:
Dec 5: Fed’s preferred inflation gauge (PCE)
Dec 10: CPI inflation report
Dec 10: Fed interest-rate decision
Dec 16: Nonfarm payrolls (US jobs report)
If the Fed so much as hums a dovish note, yen strength could accelerate fast.
If Powell surprises with a hawkish tone, the dollar may find a floor.
Either way, this is the first time in years that both sides of the dollar-yen have meaningful rate catalysts.
🔄 A Trend Reversal in the Making?
Big macro traders — the same funds that spent the last year squeezing every drop out of the yen carry trade — are taking profits, reducing leverage, and even tiptoeing into long-yen bets.
When one of the world’s great one-way trades starts wobbling, liquidity thins, and volatility spikes.
This is precisely the environment where this volatile beast can swing 100 pips before your coffee cools.
And if Japan genuinely signals the start of a tightening cycle? Carry unwinds can get violent.
One central bank hint today can become a multi-month trend tomorrow.
🧭 So What Happens Next?
The yen’s flex this week may be just the opening act.
Everything now hinges on:
BoJ clarity on Dec 19
How soft (or not) US inflation comes in
Whether the Fed’s tone shifts on Dec 10
And how the labor market behaves into year-end
Watch the economic calendar and get ready for action. FX volatility is back on the menu.
Now that it’s happening, everyone’s asking the same question:
We’ll leave it to you : Was this a one-day pop — or the start of the yen’s long-awaited comeback tour? Share your views in the comments!
JP225 Layered Buy Plan – Institutional Pullback Zone MappedJP225 – Index Market Trade Opportunity Guide (Swing Trade)
🔥 TRADE PLAN OVERVIEW
The current structure shows bullish confirmation supported by:
✔️ 200 Simple Moving Average pullback (strong trend continuation zone)
✔️ SuperTrend ATR line pullback (momentum still on the buy side)
Both indicators align to show buyers defending higher-timeframe demand, giving us a clean structure to execute a layered entry strategy.
🎯 ENTRY PLAN – THIEF LAYERING STRATEGY
This setup uses the classic Thief multi-layered limit order method, allowing traders to scale into the move with controlled risk.
💰 Buy-Limit Layers (example levels):
49200.0
49600.0
49800.0
(You can add more layers according to your own capital and risk structure.)
This structure spreads risk, improves average entry, and lets the market come to you instead of chasing candles.
🛡️ STOP LOSS (Risk Section)
🟥 Thief SL: 48500.0
Dear Ladies & Gentleman (Thief OG’s):
This SL is my version of protection, but you must adjust your own SL based on your personal risk, capital size, and strategy rules.
Use this only as a reference, not a strict rule.
🎯 TAKE PROFIT (Exit Section)
Targeting the POLICE BARRICADE zone – a well-known strong resistance area where:
Supply increases
Price becomes overbought
Trap formations tend to emerge
📈 Primary TP: 52500.0
Dear Ladies & Gentleman (Thief OG’s):
Again, this TP is my version. You can take profits earlier, later, or scale out depending on your risk tolerance. Trade wisely and escape with profits before the police arrive.
🌐 RELATED PAIRS TO WATCH (Correlation Guide)
Monitoring correlated markets gives early signals of strength or weakness in JP225. Here are key pairs:
1️⃣ USDJPY ( FX:USDJPY )
JP225 generally rises when USDJPY rises because a stronger yen hurts Japanese exporters.
If USDJPY stays bullish, JP225 usually maintains upside momentum.
2️⃣ Nikkei Futures ($NKD or CME JP225)
Directly correlated.
Futures breaking resistance often lead the cash market.
3️⃣ US30 ( CAPITALCOM:US30 ) & SPX500 ( SP:SPX )
Global risk sentiment drives JP225.
When US indices rally, JP225 tends to follow with bullish continuation.
4️⃣ VIX Index ( TVC:VIX )
Higher VIX = fear = pressure on JP225
Lower VIX = bullish environment favorable for your long plan
5️⃣ USD Index ( TVC:DXY )
Strong DXY → may pressure JP225
Weakening DXY → supportive for risk assets globally
📌 SUMMARY
The JP225 is setting up a structured bullish swing pattern supported by two strong technical confluences (200 SMA + SuperTrend ATR pullback).
The multi-layer Thief entry strategy gives flexibility and safety while positioning for a potential ride toward 52500.
Trade safe, scale smart, and execute with discipline.
Good luck, Thief OGs! 🚀📈

GBPJPY Strongly bullish long-termThe GBPJPY pair has been trading within a 6-year Channel Up and is currently on its 3rd Bullish Leg.
With the 1W MA100 (green trend-line) in firm Support, we expect this rally to continue long-term (even at a slower pace as per 1W RSI comparison with previous Legs) and rise by at least +36% in total (minimum on both previous Legs), targeting 240.00.
---
** Please LIKE 👍, FOLLOW ✅, SHARE 🙌 and COMMENT ✍ if you enjoy this idea! Also share your ideas and charts in the comments section below! This is best way to keep it relevant, support us, keep the content here free and allow the idea to reach as many people as possible. **
---
💸💸💸💸💸💸
👇 👇 👇 👇 👇 👇

Is the BoJ Planning a Thanksgiving Ambush at 207.00?The "Guppy" (GBP/JPY) surges toward a critical 15-month peak. This rally highlights a clash between Japanese fiscal stimulus and UK fiscal prudence. Traders must navigate high-stakes geopolitical tension and potential central bank intervention during the Thanksgiving holiday.
Macroeconomic Divergence: The Core Catalyst
The Yen and Sterling displayed powerful, opposing dynamics this month. Japan faces market anxiety regarding government spending. Conversely, the UK is regaining fiscal credibility.
Japanese Prime Minister Sanae Takaichi recently approved a massive ¥21 trillion stimulus package. This figure represents the largest injection since the COVID-19 era. Markets historically view such aggressive spending as a negative for currency strength. Consequently, investors priced in this fiscal dovishness heavily since Takaichi’s appointment.
In contrast, the UK’s recent budget avoided reckless pivots. The government aims to cut expenses for a better fiscal balance. While higher income taxes may slightly dampen consumption, the overall stance stabilizes the Pound. This prudence makes the GBP the third-best performer in today’s session.
Leadership and Monetary Strategy
A paradox emerges in Tokyo. PM Takaichi’s fiscal expansion may force the Bank of Japan (BoJ) to pivot. The BoJ might turn hawkish to counter inflation and protect the Yen.
Investors now eye the December 18th policy decision. The central bank could hike rates sooner than expected to offset the government's spending spree. Meanwhile, the threat of direct intervention looms large. The BoJ may utilize foreign reserves to buy back Yen if depreciation accelerates.
Technological and Algorithmic Impacts
Modern trading relies heavily on high-frequency trading (HFT) and algorithmic models. These "Cyber-Finance" systems identified the GBP/JPY’s tight bull channel since November 5.
Furthermore, Japan’s export-heavy "High-Tech" sector influences this dynamic. A weak Yen usually boosts profits for Japanese patent-holders in robotics and automotive industries. However, rising energy import costs counteract these gains. This economic friction creates volatility that algorithmic traders exploit, pushing momentum indicators like the RSI to overbought levels.
Technical Analysis: The 207.00 Threshold
Technically, the pair sits at a decisive inflection point. The price action evolved in a relentless upward trend. However, overbought RSI levels warrant caution.
Momentum still tilts upwards, suggesting the top is not yet in. Traders must watch the 207.00 resistance level closely. Last week, action stalled at 206.86. A daily close above this zone confirms a breakout, targeting the 208.120 highs (July 2024 peak).
Conversely, failure to break 207.00 suggests a "double-top" pattern. This technical formation typically precedes a sharp reversal.
Strategic Outlook
Liquidity often thins during the Thanksgiving break. This environment increases the risk of "flash crash" scenarios if the BoJ intervenes. Traders should monitor the 207.00 level and manage risk strictly. The convergence of fiscal policy, algorithmic momentum, and central bank anxiety guarantees a volatile end to November.

GBPJPY rejected at the top of its 6-month Channel Up.The GBPJPY pair has been trading within a 6-month Channel Up and yesterday got rejected exactly on its top, making a Higher High. That completed a +3.92% rise, similar to all previous Bullish Legs of this pattern.
As a result, we technically view yesterday's rejection as the start of the new Bearish Leg. All previous corrections hit at least the 1D MA50 (blue trend-line) and we expect that to happen at 202.400 at least.
As for the most optimal buy, that will be on the 1D MA100 (green trend-line), which marked all previous four bottoms (Higher Lows) and initiated the Bullish Legs. The 1D RSI testing its Support Zone, is an additional buy indicator. We expect the next Bullish Leg to reach at least 208.250 (+3.92%).
---
** Please LIKE 👍, FOLLOW ✅, SHARE 🙌 and COMMENT ✍ if you enjoy this idea! Also share your ideas and charts in the comments section below! This is best way to keep it relevant, support us, keep the content here free and allow the idea to reach as many people as possible. **
---
💸💸💸💸💸💸
👇 👇 👇 👇 👇 👇

USDJPY long-term bullish within 3-year Channel UpThe USDJPY pair has been trading within a 3-year Channel Up ever since the October 17 2022 High.
Right now it has been unfolding its latest Bullish Leg since the April 21 2025 bottom (Higher Low), turning its 1W RSI this week overbought (>70.00).
This signal along with the similarities with the June 26 2023 local High, point towards a potential short-term pull-back to test the 1W MA50 (blue trend-line) - 1D MA100 (red trend-line) Support cluster.
As you can see, those have been the two Support levels on every major rally within this 3-year pattern.
As a result, we will look for an additional opportunity to buy there, maintaining a medium-term Target for this pair at 161.500 (Resistance 1).
---
** Please LIKE 👍, FOLLOW ✅, SHARE 🙌 and COMMENT ✍ if you enjoy this idea! Also share your ideas and charts in the comments section below! This is best way to keep it relevant, support us, keep the content here free and allow the idea to reach as many people as possible. **
---
💸💸💸💸💸💸
👇 👇 👇 👇 👇 👇

'Sell Japan' trade opens door to 160 USDJPY on fiscal concernsUSDJPY has ripped through 157 with RSI pushing near extreme overbought, and the pair is now magnetised towards a key Fibonacci and prior-high cluster around 158.70–159.
In this video, I break down how the FOMC minutes maintained the recent status quo from the Fed, while blockbuster Nvidia earnings and Japan’s significant new stimulus package have combined to drive the latest leg of the USD/JPY rally. On the chart, the focus is a completed triangle breakout above 155 and an upside trajectory toward 158.70, 160 and potentially the 162 high reached in 2024.
Key drivers
Fed minutes offer no signals that policymakers should cut in December, keeping US yields and the dollar supported.
Nvidia’s earnings beat and guidance have boosted risk appetite and underpinned broad USD strength.
Japan is finalising a ¥17–21 trillion stimulus package, stoking fiscal concerns and encouraging a “sell Japan” trade that weakens the yen.
USDJPY has broken out our prior target of 155 from a triangle pattern, with Fibonacci projections and prior highs aligning around 158.70–159, then 160–162.
If you find this USDJPY roadmap useful, drop your trade levels in the comments and follow for more Fibonacci-based, fundamentals-plus-technical setups in real time.
This content is not directed to residents of the EU or UK. Any opinions, news, research, analyses, prices or other information contained on this website is provided as general market commentary and does not constitute investment advice. ThinkMarkets will not accept liability for any loss or damage including, without limitation, to any loss of profit which may arise directly or indirectly from use of or reliance on such information.

GBP/JPY: An Unusual Ascent Amid Global RiskThe GBP/JPY pair currently sits near 204.00, retracing from a six-week high. This movement reflects a complex tug-of-war between the Pound Sterling (GBP) , which faces uncertainty from upcoming UK inflation data, and an uncharacteristically weak Japanese Yen (JPY) . We analyze the diverse forces driving this pair's recent unusual ascent, where the JPY fails to act as its traditional safe-haven counterweight.
Macroeconomics & Monetary Policy Divergence
The immediate market focus centers on divergent monetary policy expectations. The Bank of Japan (BoJ) faces pressure to align its policies with fiscal objectives, potentially limiting future rate hikes. This uncertainty, coupled with the new government's plan for large economic stimulus and lower taxes, dampens JPY demand. Conversely, the Bank of England (BoE) awaits crucial UK Consumer Price Index (CPI) data, which is expected to show headline inflation moderating to *b]3.6% annually. This data will significantly influence the BoE's rate hike outlook, injecting caution into GBP trading ahead of the 07:00 GMT release.
Geopolitics & Geostrategy: The Taiwan Factor
A key reason for the JPY's recent underperformance is a shift in geopolitical sentiment toward Japan. New Prime Minister Sanae Takaichi adopted a firmer pro-Taiwan stance than her predecessors, triggering unease in Beijing. This heightened political tension weighs heavily on sentiment surrounding Japan, effectively diluting the Yen's traditional safe-haven magnetism against global risk. This specific anxiety overshadows the Yen's long-term status as the principal global currency counterweight.
Fiscal Policy & Economic Outlook
Concerns about Japan's fiscal health are also eroding the JPY's strength. The government is preparing a large economic stimulus package to boost growth. This spending raises concerns among investors worried about Japan's already stretched finances . These fiscal anxieties add direct pressure to the currency, making the JPY less attractive despite the current risk-off environment observed in global equity markets. This fiscal trajectory contrasts with the Bank of Japan's potential monetary hesitancy.
Industry Trends & Corporate Vulnerabilities
Corporate Japan's deep integration with the US technology sector presents another vulnerability. Many major Japanese companies maintain significant earnings exposure to the health and performance of the US tech boom. Corporate vulnerabilities tied to the US technology cycle are eroding the JPY’s traditional safe-haven appeal. Consequently, negative headlines or wobbles on Wall Street disproportionately mute the Yen's response, preventing it from rallying when global equities come under pressure.
Management, Innovation, and Patent Analysis -
While not an immediate driver, Japan's long-term currency strength relies on its competitive edge in high-tech and science . The current vulnerability suggests that the market is discounting the perceived innovation premium of corporate Japan. Traders see a connection between the dependency on US tech and a potentially lagging pace in domestic, cutting-edge patent analysis and independent industry leadership. Weak corporate sentiment reflects doubts about resilience and adaptive business models under new management.
Conclusion for Strategic Hedging
The Yen's uncharacteristic weakness creates a unique setup. The currency is behaving out of character relative to the worsening risk backdrop. This anomaly presents tactical opportunities for hedgers with exposure to the Yen. However, this phase is likely temporary. Japan’s enormous net international investment position and its central role in funding global carry trades mean the Yen's safe-haven DNA remains intact. If global markets experience a sharper, sustained downturn, expect the traditional gravitational pull into the JPY to reassert itself.

Intervention risk levels of USD/JPY setup USD/JPY is pushing into the top half of 155, and that’s the level both banks and policymakers care about.
Goldman Sachs says the yen can still weaken near-term, but the upside from here is limited because intervention becomes more likely the higher the pair goes.
Credit Agricole notes that Japan’s Ministry of Finance has already issued warnings, though its intervention gauge is only at 4 out of 7, not yet at the point where Tokyo typically steps into the market.
Every tick above 155 increases the probability of verbal or direct intervention. If price clears 156 decisively, those warnings could intensify. If the move becomes fast or disorderly, the risk of actual intervention rises sharply.
Possible weak support sits at 38.2% fib level noted on the chart. If the pair breaks below that level, it could be the first sign that intervention talk is starting to influence price action.

CHFJPY 9-month Channel Up looking for a pull-back.The CHFJPY pair has been trading within a 9-month Channel Up with the current Bullish Leg approaching its Top (Higher Highs trend-line).
Given that with its +7.77% rise it has already marginally exceeded the maximum Bullish Leg extension within this pattern, we expect a technical pull-back (Bearish Leg) to start now given that the 1D RSI turned overbought (above 70.00).
Both previous Bearish Legs declined by -2.45%, testing the 1D MA50 (blue trend-line). As a result, our short-term Target here is 191.000.
---
** Please LIKE 👍, FOLLOW ✅, SHARE 🙌 and COMMENT ✍ if you enjoy this idea! Also share your ideas and charts in the comments section below! This is best way to keep it relevant, support us, keep the content here free and allow the idea to reach as many people as possible. **
---
💸💸💸💸💸💸
👇 👇 👇 👇 👇 👇

Can The Yen Fight Inflation While Rates Stay Low?The AUD/JPY currency pair's surge above 101.00 is a direct result of two opposite forces. The Australian Dollar (AUD) is strong because inflation is unexpectedly high, forcing the RBA to keep its interest rate at 3.60%. This high rate attracts global investment, as traders move money to Australia for better returns. Meanwhile, the Japanese Yen (JPY) is weak because the BoJ maintains an extremely low interest rate, near zero, to boost its economy. This wide gap in rates makes the AUD/JPY a favorite for the "Carry Trade," where investors earn the difference, pushing the pair higher.
Beyond just interest rates, geopolitics is playing a crucial role. The recent US-China trade deal, which saw a truce on certain tariffs and export controls on rare earth minerals, strongly benefits the commodity-linked AUD. Australia is a major exporter of these minerals. This trade calm reduces global risk and boosts demand for Australian goods. Conversely, the JPY suffers from political choices, as Japan's new government plans aggressive spending. This combination of low rates and high spending ensures the JPY remains weak, reinforcing the strong case for continued AUD/JPY strength.

JP225 Pullback Complete? Next Stop 50K Resistance?🎌 JAPAN225 (JP225): Bullish Retest Play at 786 LSMA - Thief's Layered Entry Strategy 🎯
📊 Market Overview
The Nikkei 225 (JP225) is showing bullish confirmation with a pullback retest at the 786 Least Squares Moving Average (LSMA)—a classic swing/day trade setup for those who love precision entries with a side of controlled chaos. 🎰
This isn't your grandma's single-entry trade. We're going full Thief Mode with layered limit orders to maximize positioning while the market does its thing. Think of it as "dollar-cost averaging" but cooler and with more risk. 😎
🎯 Trade Setup
📈 Bias: BULLISH
🔍 Confirmation: Retest & bounce at 786 LSMA support zone
⚡ Strategy: Thief's Layered Entry Method (Multiple Limit Orders)
Entry Strategy: The Thief's Ladder
Instead of going all-in at one price (boring! 😴), we're layering buy limit orders like a pro:
Layer 1: 46,500
Layer 2: 46,800
Layer 3: 47,000
Layer 4: 47,500
💡 Pro Tip: You can add more layers based on your risk appetite and account size. The deeper the pullback, the more contracts you accumulate. This is how the Thief OG's do it. 🦝💼
🛑 Stop Loss
Thief's SL: 46,000
⚠️ Important Note: Dear Ladies & Gentlemen (Thief OG's), I'm NOT recommending you blindly follow my stop loss. This is your money, your rules. Set your SL based on your own risk tolerance. If you make money, take money—at your own risk. 💰🎲
🎯 Take Profit Target
Target Zone: 50,500
Why? This level coincides with:
Strong resistance 🧱
Overbought conditions 🔥
Potential bull trap zone 🪤
💡 Exit Strategy: When we hit overbought + resistance, it's time to escape with profits like a true thief in the night. 🌙💨
⚠️ Another Note: Dear Ladies & Gentlemen (Thief OG's), I'm NOT saying you MUST take profit here. Scale out, trail your stop, or hold for glory—your choice, your consequences. 🚀
📈 Key Technical Points
✅ 786 LSMA Support: Acting as dynamic support—this is our retest zone
✅ Bullish Structure Intact: Higher lows forming on multiple timeframes
✅ Risk-to-Reward: Solid 1:3+ R:R depending on your layer average
✅ Momentum Confirmation: Watch for bullish divergence on RSI/MACD if you're into that stuff 📊
🌍 Related Pairs to Watch
Keep an eye on these correlated assets for confirmation:
$USD/JPY (DXY correlation): Inverse relationship—weak USD = stronger Yen = potential JP225 boost 💴
SP:SPX (S&P 500): Risk-on sentiment in US markets often lifts JP225 🇺🇸📈
HSI:HSI (Hang Seng Index): Asian market correlation—regional sentiment matters 🇭🇰
TSE:TOPIX (Tokyo Stock Price Index): Direct correlation with broader Japanese equities 🎌
💡 Correlation Play: If US indices are pumping and USD is weakening, JP225 tends to follow the party. 🎉
⚙️ Risk Management Reminder
This is a layered entry strategy—meaning your average entry price will depend on how many layers get filled. The beauty? You're not FOMOing at one level. The downside? You need proper position sizing across layers to avoid overexposure. 🧮
Golden Rule: Never risk more than 1-2% of your account on a single trade idea. Thief's honor. 🤝
✨ If you find value in my analysis, a 👍 and 🚀 boost is much appreciated — it helps me share more setups with the community!
#JP225 #Nikkei225 #JapanIndex #ThiefStrategy #LayeredEntry #SwingTrading #DayTrading #LSMA #TechnicalAnalysis #ForexCorrelation #RiskManagement #BullishSetup #TradingView #PriceAction #SupportAndResistance #TradeSmart

USDJPY - OG FlowMaster SetupFX:USDJPY is rejecting from premium levels but the main bullish leg is not broken. I will wait for price to return to the OG demand around 152 for cleaner longs back into 154.5–155. I am Using OG FlowMaster to map imbalance zones you can add it to your chart as a free and strong tool.💪📈

$JPINTR -Japan Interest Rates (October/2025)ECONOMICS:JPINTR
October/2025
source: Bank of Japan
- The Bank of Japan kept its benchmark short-term rate unchanged at 0.5% in October 2025, maintaining borrowing costs at their highest level since 2008 and extending a pause since the last hike in January.
The decision, in line with market expectations, was approved by a 7-2 vote, with board members Naoki Tamura and Hajime Takata again proposing a rise to 0.75%, as they had in September.
The central bank reaffirmed its commitment to continue raising borrowing costs if the economy follows its projections.
The move came hours after the U.S. Federal Reserve delivered its second rate cut of the year.
In its quarterly outlook, the BoJ held core inflation for FY 2025 at 2.7%, expecting it to ease to 1.8% in FY 2026 before rising slightly to 2.0% in FY 2027.
GDP growth for FY 2025 was revised up to 0.7% from 0.6%, supported by a trade deal with Washington and new leadership under Prime Minister Sanae Takaichi, while GDP projections for FY 2026 and 2027 remained at 0.7% and 1%, respectively.

Fifth straight gain for USDJPY - can bulls clear 153 before CPI?USD/JPY is advancing for a fifth consecutive day after the ruling LDP confirmed Sanae Takaichi as its new leader. Traders are preparing for possible increased fiscal spending, and this is weighing on the yen.
However, upward momentum could be tested later this week ahead of the US CPI release on Friday.
Momentum indicators remain constructive for now, with the RSI holding above 60 and price action potentially supported by the rising 20-day moving average near 150.40.

Tech & Rates: The Unstoppable Force Driving USD/JPY SkywardThe USD/JPY exchange rate has exhibited a clear upward trend, recently touching a one-week high before a slight pull-back to around 151.74. This sustained yen weakness reflects a convergence of factors across global finance, domestic Japanese policy, and international relations. Traders must analyze these multi-faceted pressures to accurately forecast future movements.
Domestic Japanese Fiscal Expansion
Japan's new Prime Minister, Sanae Takaichi, is preparing an aggressive economic stimulus package likely exceeding last year's $13.9$ trillion yen ($92.19$ billion). This expansionary fiscal policy aims to counter rising inflation and support household incomes. Markets anticipated this policy shift, contributing to the yen's $2.6\%$ decline this month, its biggest monthly drop since July. A combination of significant fiscal spending and a challenging relationship with the central bank typically weighs heavily on a currency.
Geopolitical Instability and Safe Havens
Global political risk typically favors the U.S. dollar, cementing its position as the world's primary reserve currency. The ongoing $\mathbf{U.S.}$ $\mathbf{government}$ $\mathbf{shutdown}$, now into its third week, injects domestic uncertainty. This standoff complicates the Fed’s data-driven decision-making, potentially reinforcing expectations for rate cuts, which can weaken the dollar. Despite this, the dollar index (DXY) remains resilient at $98.84$. A brief drop in gold prices recently triggered market volatility and a rebalancing of safe-haven assets, briefly allowing the yen to climb. Yet, the persistent US political gridlock maintains a background risk premium that supports the dollar as the ultimate haven.
Geostrategy and Technology Competition
Geostrategic competition, especially involving China, supports the USD through capital flow redirection. Diversification and resilience strategies in global supply chains lead to investment shifts toward Southeast Asia and other strategic areas, often bypassing the yen. Furthermore, the dollar benefits from the High-Tech sector's dominance. High-tech and cyber security, and the associated intellectual property (IP), including patent families, are key drivers of economic growth. A country's strength in technology, quantified by international patents, significantly impacts its currency's global competitiveness and valuation, often bolstering the dollar’s perceived "soft power" relative to the yen. (www.worldscientific.com)
Conclusion and Outlook
The primary drivers of the USD/JPY's ascent are the widening interest rate differential and Japan’s expansionary fiscal outlook. While a short-term correction occurred due to safe-haven rebalancing, the structural forces remain dollar-positive. The US government shutdown presents a risk, but its historical impact on the dollar has typically been modest and short-lived. Traders should expect USD/JPY to test new highs, especially if the new Japanese fiscal policy exacerbates bond market concerns.

USDJPY Had its 1st 1D Golden Cross since Dec 2024.The USDJPY pair has been trading within a Channel Up pattern since the April 22 2025 market bottom and just last week, it formed the first 1D Golden Cross since December 16 2024. As you can see, all three 1D Golden Crosses since June 2023 have been strong Buy Signals.
All have been formed within Channel Up patterns that formed Higher Highs just after the crosses. The target of the current Channel Up is 154.000, which represents a +6.06% rise, similar to both previous Bullish Legs of this pattern. The uptrend is so far restricted by the presence of the Lower Highs trend-line that started back on the July 03 2024 market Top.
This time however we may see this break as the 1W RSI has already broken above its own Lower Highs trend-line, signaling an early bullish warning. As a result, if the July 2024 Lower Highs trend-line breaks, we expect the pair to eye the upper Resistance at 159.000.
-------------------------------------------------------------------------------
** Please LIKE 👍, FOLLOW ✅, SHARE 🙌 and COMMENT ✍ if you enjoy this idea! Also share your ideas and charts in the comments section below! This is best way to keep it relevant, support us, keep the content here free and allow the idea to reach as many people as possible. **
-------------------------------------------------------------------------------
💸💸💸💸💸💸
👇 👇 👇 👇 👇 👇

GBP/JPY 4H Analysis A bit of a tricky one on GBPJPY, no clear formation, however, we still have that unaddressed gap that was formed in the previous week, maybe we can see that getting filled. Pin off the Mayo.

GBPJPY starting a new multi-year Bear Cycle.The GBPJPY pair gave us recently (October 02, see chart below) an excellent buy signal on the 1D MA100, which instantly hit our 201.200 Target:
This time we view the market on the longest scale possible, the 1M time-frame, where since August 1990 High, it has been declining under the pressure of a Lower Highs trend-line.
The price is approaching that Lower Highs trend-line again after more than 18 years and in our perspective, sell any rally is the way to go long-term as it has much greater return potential than risk.
The first two Bearish Legs of this pattern (Bear Cycles) have declined by around -55%, the next one was shorter at -37.35%. As a result, we expect a minimum of -37.35% decline from the Lower Highs trend-line, which gives us a long-term Target of 136.000.
It is worth pointing out that the 1M Golden Cross that was priced in December 2023, is a formation that last time it emerged (December 2005), preceded a market Top. Also notice the presence of the 1M RSI Resistance Zone, which is holding since 1990 and when the RSI double tops there, it has been the most reliable Sell Signal.
-------------------------------------------------------------------------------
** Please LIKE 👍, FOLLOW ✅, SHARE 🙌 and COMMENT ✍ if you enjoy this idea! Also share your ideas and charts in the comments section below! This is best way to keep it relevant, support us, keep the content here free and allow the idea to reach as many people as possible. **
-------------------------------------------------------------------------------
💸💸💸💸💸💸
👇 👇 👇 👇 👇 👇
