CADJPY - NEW BREAKOUT !Hello Traders👋🏻
On The Daily Time Frame The CADJPY Price Reached A Supply Zone (99.828-100.880) ✔
Currently, The Price Broke Higher High (Resistance Level Becomes New Support Level)
If Price Stays Above The Key Zone,
CADJPY Can Create New Higher Low and Continue The Bullish Move 📈
-----------
TARGET: 102.810🎯
___________
if you agreed with this IDEA, please leave a LIKE, SUBSCRIBE or COMMENT!
Japaneseyen

USD JPY - FUNDAMENTAL ANALYSISYen Undervalued, Yuan to Lose Ground
Danske Bank continues to expect that the Bank of Japan will tighten monetary policy this year, although the timing remains very uncertain.
While a key argument against the Euro is that the currency is overvalued, it considers that the Japanese currency is substantially undervalued.
According to Danske; “Overall, USD/JPY seems fundamentally overvalued and combined with potential monetary policy tightening; we expect the cross to drop below 130 on a 6-12M horizon. If inflationary pressures in Japan continue to persist, it will increasingly build pressure on the ultra-dovish stance that the BoJ has.
Danske expects the Chinese yuan will lose ground due to broad dollar gains. A weaker Chinese currency would also act as a barrier to Euro gains.

GBPJPY: Technical sell signal to the 1D MA50.GBPJPY got rejected on R1, making so far a Double Top with the October 31st 2022 High pausing a rally that has started at the beginning of the year. As the 1D technicals show (RSI = 62.785, MACD = 1.330, ADX = 28.382) the trend hasn't changed, technically it does only with a candle under the 1D MA200. But every such HH rejection always tests the 1D MA50. Based on this we are selling on the short-term, TP = 167.500.
Prior idea:
## If you like our free content follow our profile to get more daily ideas. ##
## Comments and likes are greatly appreciated. ##

USD JPY - FUNDAMENTAL ANALYSISBOJ governor Kazuo Ueda is a scholar, so if the BOJ does conduct a review, he will probably be forced to recognize the impossibility of the BOJ’s current monetary policy. With the phase of rate hikes also coming to an end in the US, the dollar/yen pair’s topside will gradually grow heavier from here on.

USDJPY - New Bullish MoveHello Traders👋🏻
On The Daily Time Frame The USDJPY Price Broke The Higher High
If Price Stays Above The Key Zone,
USDJPY Can Create New Higher Low and Continue The Bullish Move 📈
-----------
TARGET: 136.812🎯
___________
if you agreed with this IDEA, please leave a LIKE, SUBSCRIBE or COMMENT!

USD JPY - FUNDAMENTAL ANALYSISJapan: High expectations for Q1 GDP, with persistent inflation concerns
Japan’s preliminary GDP for Q1 is due on Wednesday and will provide the latest insight into the health of the economy. Bloomberg consensus expects an improvement to 0.8% Q/Q annualized from 0.1% in Q4 when the economy narrowly avoided a recession. While a broader reopening of the economy in the first quarter and the return of some Chinese tourists may have meant a further uptick in the services sector, exports and manufacturing likely remained weak on the back of weakness in global demand. If domestic consumption weakens substantially despite the government travel subsidies and high winter bonuses, it could continue to highlight the risk of a recession.
April CPI will also be released on Friday which will likely confirm that price pressures remain concerning. Tokyo CPI for April had come in above expectations despite the falling commodity prices and the base effect. Bloomberg consensus expects national CPI for April to come in at 3.5% for the headline from 3.2% previously while the core-core measure (ex-fresh food and energy) is expected to rise to 4.2% from 3.8% in March.

GBP JPY - FUNDAMENTAL ANALYSISJapan: High expectations for Q1 GDP, with persistent inflation concerns
Japan’s preliminary GDP for Q1 is due on Wednesday and will provide the latest insight into the health of the economy. Bloomberg consensus expects an improvement to 0.8% Q/Q annualized from 0.1% in Q4 when the economy narrowly avoided a recession. While a broader reopening of the economy in the first quarter and the return of some Chinese tourists may have meant a further uptick in the services sector, exports and manufacturing likely remained weak on the back of weakness in global demand. If domestic consumption weakens substantially despite the government travel subsidies and high winter bonuses, it could continue to highlight the risk of a recession.
April CPI will also be released on Friday which will likely confirm that price pressures remain concerning. Tokyo CPI for April had come in above expectations despite the falling commodity prices and the base effect. Bloomberg consensus expects national CPI for April to come in at 3.5% for the headline from 3.2% previously while the core-core measure (ex-fresh food and energy) is expected to rise to 4.2% from 3.8% in March.

USD/JPY BUY PRICE ACTION- I'm expecting the price to retest the resistant again for the 3rd time. If buyers succeed to break this strong resistant then I'm expecting the price to rocket to a big imbalance zone seen in 1-day chart which is 142-146
I'll be watching 30 min chart to enter this buy opportunity, expecting a round .... ( watch for bullish patterns to confirm your entry)
Have a safe trade-> Fifi

USD JPY - FUNDAMENTAL ANALYSISJapan: High expectations for Q1 GDP, with persistent inflation concerns
Japan’s preliminary GDP for Q1 is due on Wednesday and will provide the latest insight into the health of the economy. Bloomberg consensus expects an improvement to 0.8% Q/Q annualized from 0.1% in Q4 when the economy narrowly avoided a recession. While a broader reopening of the economy in the first quarter and the return of some Chinese tourists may have meant a further uptick in the services sector, exports and manufacturing likely remained weak on the back of weakness in global demand. If domestic consumption weakens substantially despite the government travel subsidies and high winter bonuses, it could continue to highlight the risk of a recession.
April CPI will also be released on Friday which will likely confirm that price pressures remain concerning. Tokyo CPI for April had come in above expectations despite the falling commodity prices and the base effect. Bloomberg consensus expects national CPI for April to come in at 3.5% for the headline from 3.2% previously while the core-core measure (ex-fresh food and energy) is expected to rise to 4.2% from 3.8% in March.
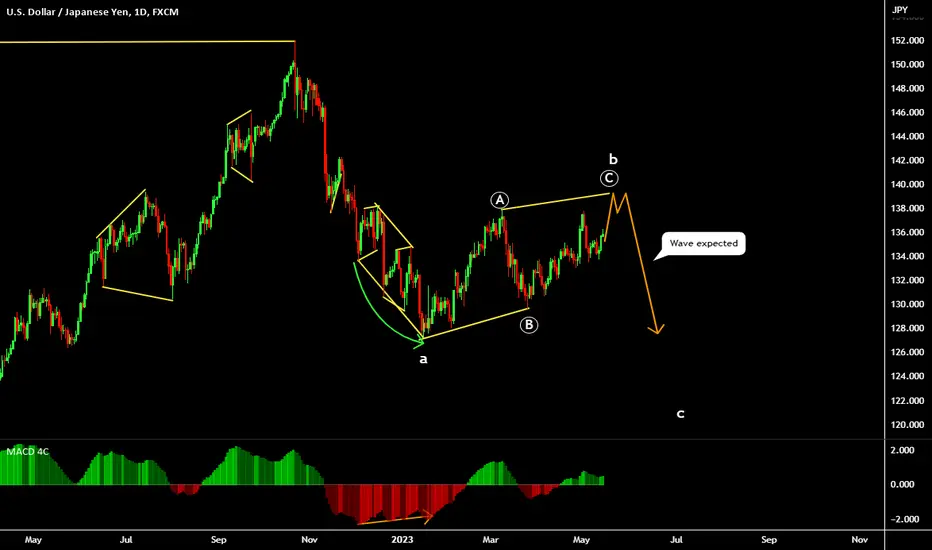
Japanese Yen can make small correction and continue to riseHello traders, I want share with you my opinion about Japanese Yen. Watching the chart, we can see how the price has been moving up for a long time. After breaking through the resistance level 136.55, the Japanese Yen to rise and above created a resistance area 137.50-137.75 from which began to fall. The price declined, reached the support line and formed a buyer zone 133.90-133.50 after which it bounced, then re-tested it and continued to rise. Not so long ago, the price dropped, re-tested the buyer zone, but never updated the low (LL) the previous week, began to grow and broke of structure (BoS). Japanese Yen continued to move up, updated its previous high, and changed of character of price movement (CHoCH). I think the price can continue to rise and reach the resistance level. The Japanese Yen, after a small downward correction, can continue the upward movement and collect previously accumulated liquidity. So, I decided to set the target at level 136.55. Please share this idea with your friends and click Boost 🚀

GBP JPY - FUNDAMENTAL ANALYSISJapanese yen strength over time.
While the yen underperformed during the global monetary tightening phase, in our view, the currency has scope to outperform later this year. We now believe the BoJ will take advantage of a tactical opportunity to further tweak its policy settings in Q4-2023 to further normalize the government bond market. Such a policy move adds to our constructive medium-term outlook for the yen. Yen outperformance over time should also be supported by the end of central bank tightening and a transition toward easing, as well as a U.S. recession in the second half of 2023.
USD JPY - FUNDAMENTAL ANALYSISJapanese yen strength over time.
While the yen underperformed during the global monetary tightening phase, in our view, the currency has scope to outperform later this year. We now believe the BoJ will take advantage of a tactical opportunity to further tweak its policy settings in Q4-2023 to further normalize the government bond market. Such a policy move adds to our constructive medium-term outlook for the yen. Yen outperformance over time should also be supported by the end of central bank tightening and a transition toward easing, as well as a U.S. recession in the second half of 2023.

USDJPY: Detailed Video Analysis 🇺🇸🇯🇵
Price action analysis for USDJPY.
Key levels, trend analysis.
Potential scenarios & thoughts.
❤️Please, support this video with like and comment!❤️

How I missed you UJOANDA:USDJPY
Crazy NY morning, waited until the dust settled and charts refreshed back to the normal ebb and flow.
Wanted EU, but I saw UJ setting up, so what the heck, 10 pips hard TP hit....

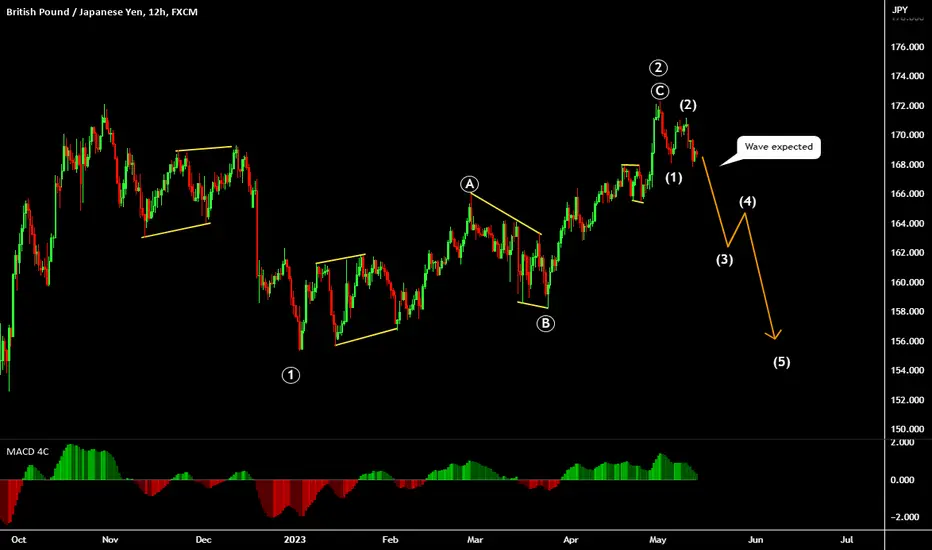
GBPJPY Sell Signal, top of the Megaphone.The GBPJPY pair was rejected on May 2nd on Resistance (1), a level holding since October 31st 2022.
The pattern is a Rising Megaphone and the rejection was on its top, indicating a significant downside potential.
Trading Plan:
1. Sell on the current market price.
Targets:
1. 164.500 (the MA200 (1d)).
Tips:
1. RSI (1d) being under its MA line is an early bearish signal, same as in March.
Please like, follow and comment!!
Notes:
Past trading plan:

USDJPY Bearish momentum extension if MA50 (1d) breaksThe USDJPY pair is on a bearish trend after failing to break Resistance (1).
There is a Rising Support since the January 16th Low and if broken can lead to a Rectangle creation.
Trading Plan:
1. Sell if the price closes a (1d) candle under the MA50 (1d).
2. Sell again if it closes a (1d) candle under the Rising Support.
Targets:
1. 132.000 (the Rising Support).
2. 130.000 (Rectangle bottom).
Tips:
1. RSI (1d) being under its MA line is an early bearish signal before the MA50 (1d) validates it.
Please like, follow and comment!!
Notes:
Past trading plan:

Sony Group Corporation DCA - Inverted head and shoulders + C&HCompany: Sony Group Corporation
Ticker: 6758
Exchange: TSE
Sector: Electronics
Introduction:
Hello and thank you for taking the time to read my post. Today, we analyze the daily chart of Sony Group Corporation, focusing on an interesting combination of two price patterns, an inverted head and shoulders and a cup and handle pattern. This combination provides additional confirmation for classical chart analysts and offers a compelling trading opportunity.
Price Patterns:
Inverted Head and Shoulders: This pattern has been forming for 384 days and features a clear horizontal resistance line at ¥12,380. This serves as our reference point for the pattern.
Cup and Handle: The right shoulder of the inverted head and shoulders pattern contains a 126-day old cup and handle pattern, which provides further confirmation and a second possible price pattern. The same horizontal resistance line at ¥12,380 serves as the reference point for this pattern.
Bullish Environment:
The price has been above the 200 EMA for some time, indicating a bullish environment.
Price Targets:
Inverted Head and Shoulders: The price target for this pattern is ¥15,520, representing a potential price increase of 25%.
Cup and Handle: The price target for this pattern is ¥14,725, representing a potential price increase of 19%.
Trade Opportunity:
A breakout has occurred, making this trade actionable without further observation.
Conclusion:
The Sony Group Corporation daily chart analysis highlights the combination of an inverted head and shoulders pattern and a cup and handle pattern. This provides a compelling trade opportunity with clear price targets. As always, it's essential to consider risk management and proper position sizing when trading based on chart patterns.
Please note that this analysis is not financial advice. Always do your own due diligence when investing or trading.
If you found this analysis helpful, please like, share, and follow for more updates. Happy trading!
Best regards,
Karim Subhieh

NZDJPY: Breakout & Bullish Forecast 🇳🇿🇯🇵
NZDJPY broke and closed above a huge horizontal zone of supply on a daily.
The broken structure turned into a demand zone.
I will expect a bullish continuation from that zone.
Goals: 0.869 / 0.8765
❤️Please, support my work with like, thank you!❤️

NZDJPY - Resistance Becomes Support!Hey Traders👋🏻
On The Daily Time Frame The NZDJPY Price Reached A Resistance Level (584.812-85.246) !
Currently, The Price Broke The Key Level (Resistance Level Becomes New Support Level)
If Price Stays Above The Key Zone,
NZDJPY Can Continue The Bullish Move 📈
-----------
TARGET: 86.848🎯
___________
if you agreed with this IDEA, please leave a LIKE, SUBSCRIBE or COMMENT!

NZDJPY: Approaching the Sell Zone.NZDJPY has been trading sideways inside a Rectangle pattern for a full year. Our TP = 86.300 is close to getting hit, the 1D technicals are naturally green (RSI = 65.478, MACD = 0.580, ADX = 24.917) since we are on a bullish wave but the price is approaching the Sell Zone of this pattern. That is the region between the 0.786 Fibonacci level (86.300) and the R1 Zone (87.335 - 88.145).
In addition, the 1D RSI hasn't been higher since November 1st 2022. Consequently, we are going short now targeting on the long term the 0.236 Fibonacci (TP = 81.550).
Prior idea:
## If you like our free content follow our profile to get more daily ideas. ##
## Comments and likes are greatly appreciated. ##

Gbp/Jpy weekly forecast Hello traders i like to trade this currency pairs on a bigger time frame to catch massive pips .gbpjpy is setting for nice sell movement as you can see we have a confirmed trendline we mix it up with zone to have confluence this is a nice setup wait for 4 hr candle to close to confirm gbpjpy want to sell let me know what you think in the comment

CHFJPY - New Bullish Move 📈Hello Traders👋🏻
The CHFJPY Broke The Key Level (151.110-151.528) ✔
So, The Resistance Level Becomes New Support Level
If Price Stays Above The Key Zone,
CHFJPY Can Create New Higher Low and Continue The Bullish Move 📈
-----------
TARGET 1: 153.450🎯
TARGET 2: 155.888🎯
___________
if you agreed with this IDEA, please leave a LIKE, SUBSCRIBE or COMMENT!

CADJPY: The 1D MA50 is crucialCSDJPY is on the rising Channel of its medium term Channel Up, rebounding on the 1D MA50. The 1D technicals are neutral (RSI = 53.031, MACD = 0.270, ADX = 28.072) and that always favors technically the dominant trend. So as long as the price is inside the rising Channel, our target will be the 1D MA200 (TP = 101.350). If a candle closes under the rising Channel and ideally the 1D MA50 as well, we will sell targeting the bottom of the Channel Up (TP = 96.000).
The 1D RSI is on a HL trendline. Technically a low risk buy will be on that line.
## If you like our free content follow our profile to get more daily ideas. ##
## Comments and likes are greatly appreciated. ##
