USD/JPY - H4 - Breakdown Watch!(29.11.2025)📝 Technical Description FX:USDJPY
USD/JPY has been moving inside a clean ascending channel on the H4 timeframe.
Price is now sitting inside the Reversal Zone, struggling to break above the channel’s mid-line resistance. A bearish correction is possible if the market fails to reclaim the upper zone.
This setup remains a pending order, and requires confirmation before execution.*
📊 Trading Plan (My View)🔻 Bearish Scenario (Primary Setup)
If price rejects the Reversal Zone, expect a bearish channel breakdown.
Target a correction toward the key support zones shown on the chart.
🎯 Key Levels
Reversal Zone: 156.300 – 156.500
Support Zone (Target): 153.093
⚠️ Today’s Fundamental Updates – 29 Nov 2025
1️⃣ Bank of Japan Policy Sentiment Shifts
BoJ Governor Ueda hinted that an interest rate increase may come sooner,
as the government boosts spending to stimulate the economy.
➡ This generally strengthens the JPY, increasing downside pressure on USD/JPY.
2️⃣ US Dollar Weakness Drivers
Rising expectations of rate cuts from the Federal Reserve.
Treasury yields softening due to recession worries.
➡ A weaker USD supports the bearish setup on USD/JPY.
📌 Summary
Strong channel resistance + bearish fundamentals on USD → JPY
= High-probability reversal correction setup once confirmation appears.
⚠️ Wait for breakout confirmation before entering.
⚠️ Disclaimer
This analysis is for education only.
Not financial advice. Always trade with proper risk management.
❤️ Support the Work
If this analysis helped you,👉 Please LIKE 👍 & COMMENT 💬
Your support motivates me to post more high-quality setups daily!
#usdjpy #forex #forexanalysis #priceaction #channelpattern #technicalanalysis
#fxsignals #tradingview #chartanalysis #jpy #boj #fundamentals #usdweakness #reversalpattern
Jpy

Bullish momentum to extend?USD/JPY is falling towards the pivot, which has been identified as a pullback support and could bounce to the 1st resistance.
Pivot: 154.41
1st Support: 151.03
1st Resistance: 158.33
Disclaimer:
The opinions given above constitute general market commentary and do not constitute the opinion or advice of IC Markets or any form of personal or investment advice.
Any opinions, news, research, analyses, prices, other information, or links to third-party sites contained on this website are provided on an "as-is" basis, are intended to be informative only, and are not advice, a recommendation, research, a record of our trading prices, an offer of, or solicitation for, a transaction in any financial instrument and thus should not be treated as such. The information provided does not involve any specific investment objectives, financial situation, or needs of any specific person who may receive it. Please be aware that past performance is not a reliable indicator of future performance and/or results. Past performance or forward-looking scenarios based upon the reasonable beliefs of the third-party provider are not a guarantee of future performance. Actual results may differ materially from those anticipated in forward-looking or past performance statements. IC Markets makes no representation or warranty and assumes no liability as to the accuracy or completeness of the information provided, nor any loss arising from any investment based on a recommendation, forecast, or any information supplied by any third party.

Falling towards key support?NZD/JPY is falling towards the support level, which is a pullback support that aligns with the 38.2% Fibonacci retracement and could bounce from this level to our take profit.
Entry: 88.76
Why we like it:
There is a pullback support that aligns with the 38.2% Fibonacci retracement.
Stop loss: 87.66
Why we like it:
There is a pullback support.
Take profit: 90.19
Why we like it:
There is a resistance level at the 100% Fibonacci projection.
Enjoying your TradingView experience? Review us!
Please be advised that the information presented on TradingView is provided to Vantage (‘Vantage Global Limited’, ‘we’) by a third-party provider (‘Everest Fortune Group’). Please be reminded that you are solely responsible for the trading decisions on your account. There is a very high degree of risk involved in trading. Any information and/or content is intended entirely for research, educational and informational purposes only and does not constitute investment or consultation advice or investment strategy. The information is not tailored to the investment needs of any specific person and therefore does not involve a consideration of any of the investment objectives, financial situation or needs of any viewer that may receive it. Kindly also note that past performance is not a reliable indicator of future results. Actual results may differ materially from those anticipated in forward-looking or past performance statements. We assume no liability as to the accuracy or completeness of any of the information and/or content provided herein and the Company cannot be held responsible for any omission, mistake nor for any loss or damage including without limitation to any loss of profit which may arise from reliance on any information supplied by Everest Fortune Group.

NZDJPY to continue in the rally?NZDJPY - 24h expiry
There is no clear indication that the upward move is coming to an end.
Offers ample risk/reward to buy at the market.
15min EMA is at 89.45.
Our outlook is bullish.
Our bespoke resistance of 89 has been clearly broken.
We look to Buy at 89.45 (stop at 89.05)
Our profit targets will be 90.65 and 90.95
Resistance: 89.56 / 90.00 / 90.50
Support: 89.00 / 88.65 / 88.40
Risk Disclaimer
The trade ideas beyond this page are for informational purposes only and do not constitute investment advice or a solicitation to trade. This information is provided by Signal Centre, a third-party unaffiliated with OANDA, and is intended for general circulation only. OANDA does not guarantee the accuracy of this information and assumes no responsibilities for the information provided by the third party. The information does not take into account the specific investment objectives, financial situation, or particular needs of any particular person. You should take into account your specific investment objectives, financial situation, and particular needs before making a commitment to trade, including seeking, under a separate engagement, as you deem fit.
You accept that you assume all risks in independently viewing the contents and selecting a chosen strategy.
Where the research is distributed in Singapore to a person who is not an Accredited Investor, Expert Investor or an Institutional Investor, Oanda Asia Pacific Pte Ltd (“OAP“) accepts legal responsibility for the contents of the report to such persons only to the extent required by law. Singapore customers should contact OAP at 6579 8289 for matters arising from, or in connection with, the information/research distributed.

GBPJPY Strongly bullish long-termThe GBPJPY pair has been trading within a 6-year Channel Up and is currently on its 3rd Bullish Leg.
With the 1W MA100 (green trend-line) in firm Support, we expect this rally to continue long-term (even at a slower pace as per 1W RSI comparison with previous Legs) and rise by at least +36% in total (minimum on both previous Legs), targeting 240.00.
---
** Please LIKE 👍, FOLLOW ✅, SHARE 🙌 and COMMENT ✍ if you enjoy this idea! Also share your ideas and charts in the comments section below! This is best way to keep it relevant, support us, keep the content here free and allow the idea to reach as many people as possible. **
---
💸💸💸💸💸💸
👇 👇 👇 👇 👇 👇

USDJPY currently on a resistance leveltoday's market analysis for USDJPY, it seems the USDJPY is currently on a bearish run with a very sensitive area.
if the price breaks the resistance line then this whole setup is canceled and we might be looking for a bullish approach.
Note: you should be looking for today's financial news regarding USD.

AUDJPYHello Traders,
We are waiting for a confirmation from CPI news! Any big surprise means we should not trade against it!
This is out Daily Chart!
A bullish chart it really is!
We are searching for middle of the channel to react!
The trend-line could be used as Liquidity hunt!

USDJPY – 30M | Break + Retest Setup Toward Liquidity TargetFX:USDJPY
Price is currently respecting a descending structure while building higher-lows along the trendline support. A successful break and hold above the 156.600–156.800 supply zone will confirm bullish continuation and shift structure.
If the breakout fails, price may retest the rising trendline (155.900–156.150) before pushing higher.
Key Scenarios
✅ Bullish Case (Primary Plan)
Break and hold above 156.800
→ 🎯 Target: 157.893 (Liquidity Sweep Zone)
📌 Alternative Entry:
Buy from retest zone 156.150–155.900 if structure remains intact.
❌ Invalidation
A full break below 155.500 invalidates bullish outlook.
Current Levels to Watch
Support Zones: 156.150 / 155.900 / 155.500
Resistance Zones: 156.800 / 157.300 / 157.893 Target
⚠️ This analysis is for educational purposes only — not financial advice.

Bearish reversal off pullback resistance?NZD/JPY is reacting off the pivot whic acts as a pullback resitance and could fall to the 1st support.
Pivot: 87.74
1st Support: 87.33
1st Resistance: 88.03
Disclaimer:
The opinions given above constitute general market commentary and do not constitute the opinion or advice of IC Markets or any form of personal or investment advice.
Any opinions, news, research, analyses, prices, other information, or links to third-party sites contained on this website are provided on an "as-is" basis, are intended to be informative only, and are not advice, a recommendation, research, a record of our trading prices, an offer of, or solicitation for, a transaction in any financial instrument and thus should not be treated as such. The information provided does not involve any specific investment objectives, financial situation, or needs of any specific person who may receive it. Please be aware that past performance is not a reliable indicator of future performance and/or results. Past performance or forward-looking scenarios based upon the reasonable beliefs of the third-party provider are not a guarantee of future performance. Actual results may differ materially from those anticipated in forward-looking or past performance statements. IC Markets makes no representation or warranty and assumes no liability as to the accuracy or completeness of the information provided, nor any loss arising from any investment based on a recommendation, forecast, or any information supplied by any third party.

Could we see a bearish reversal from here?EUR/JPY is rising towards the resistance level which is a pullback resistance and could reverse from this level to our take profit.
Entry: 181.17
Why we like it:
There is a pullback resistance level.
Stop loss: 182.03
Why we like it:
There is a swing high resistance level
Take profit: 178.84
Why we like it:
There is a pullback support level that aligns with the 50% Fibonacci retracement.
Enjoying your TradingView experience? Review us!
Please be advised that the information presented on TradingView is provided to Vantage (‘Vantage Global Limited’, ‘we’) by a third-party provider (‘Everest Fortune Group’). Please be reminded that you are solely responsible for the trading decisions on your account. There is a very high degree of risk involved in trading. Any information and/or content is intended entirely for research, educational and informational purposes only and does not constitute investment or consultation advice or investment strategy. The information is not tailored to the investment needs of any specific person and therefore does not involve a consideration of any of the investment objectives, financial situation or needs of any viewer that may receive it. Kindly also note that past performance is not a reliable indicator of future results. Actual results may differ materially from those anticipated in forward-looking or past performance statements. We assume no liability as to the accuracy or completeness of any of the information and/or content provided herein and the Company cannot be held responsible for any omission, mistake nor for any loss or damage including without limitation to any loss of profit which may arise from reliance on any information supplied by Everest Fortune Group.

USD/JPY – Bearish Flag Breakdown (25.11.2025)📝 Description 📌 Setup Overview FX:USDJPY
USD/JPY has completed a Bearish Flag on the M30 timeframe and price has now broken below the flag support with momentum.
The Ichimoku Cloud is acting as resistance, showing sellers stepping in again after a short pullback.
📉 Bias: Bearish continuation📍 Pattern: Bear Flag (Breakout confirmed)
🎯 Trading Plan
• Entry idea: After a clean breakout & retest confirmation below the flag base zone
• TP1: 156.055 (1st Support)
• TP2: 155.622 (2nd Support)
• SL suggestion: Above 157.000 (invalidates breakdown)
• RR potential: 1:2 — 1:3 depending on entry
🧠 Why this move makes sense
1️⃣ Price rejected Ichimoku cloud + structure resistance
2️⃣ USD weakness continues after recent pullback
3️⃣ JPY demand increases as risk sentiment cools ahead of key macro events
📌 What to expect
If price retests the flag support from below and rejects again, bearish momentum could accelerate toward 156.05 → 155.62.
💬 Your turn
Which target will hit first in your view — TP1 or TP2?
👇 Comment below — I reply to all comments.
🔖 SAVE this post so you don’t miss the trade update.
👍 LIKE if you want more Bear Flag & Triangle setups.
⚠ Disclaimer: For educational purposes only. Not financial advice. Trade based on your plan & risk management.
#USDJPY #forex #bearflag #priceaction #tradingview #technicalanalysis #chartanalysis #forexanalysis #ickycloud #supportandresistance #forextrading #marketstructure #smartmoney

USDJPY - Bulls Watching the Intersection Zone!📈USDJPY remains overall bullish, moving steadily inside its rising channel. After a strong impulsive move upward, the pair is now forming a healthy correction, heading toward a key confluence area.
⚔️As price approaches the intersection of the lower trendlines and the demand zone, we will be looking for trend-following longs. This orange area has acted as a strong support multiple times, and with both trendlines meeting there, it becomes a high-probability spot for buyers to step in.
🏹If the bulls defend this zone , USDJPY could resume its upward movement and push toward new highs. Only a clear break below the demand zone would weaken the bullish outlook.
For now, the plan is simple: wait for the retest… then look for longs from structure. 🤔
⚠️ Disclaimer: This is not financial advice. Always do your own research and manage risk properly.
📚 Stick to your trading plan regarding entries, risk, and management.
Good luck! 🍀
All Strategies Are Good; If Managed Properly!
~Richard Nasr

Bearish reversal off 50% Fibonacci resistance?USD/JPY has rejected off the resistance level which acts as a pullback resistance that aligns with the 50% Fibonacci retracement and could drop from this level to our take profit.
Entry: 157.11
Why we like it:
There is a pullback that aligns with the 50% Fibonacci retracement.
Stop loss: 157.73
Why we like it:
There is a swing high resistance.
Take profit: 156.23
Why we like it:
There is a pullback support level.
Enjoying your TradingView experience? Review us!
Please be advised that the information presented on TradingView is provided to Vantage (‘Vantage Global Limited’, ‘we’) by a third-party provider (‘Everest Fortune Group’). Please be reminded that you are solely responsible for the trading decisions on your account. There is a very high degree of risk involved in trading. Any information and/or content is intended entirely for research, educational and informational purposes only and does not constitute investment or consultation advice or investment strategy. The information is not tailored to the investment needs of any specific person and therefore does not involve a consideration of any of the investment objectives, financial situation or needs of any viewer that may receive it. Kindly also note that past performance is not a reliable indicator of future results. Actual results may differ materially from those anticipated in forward-looking or past performance statements. We assume no liability as to the accuracy or completeness of any of the information and/or content provided herein and the Company cannot be held responsible for any omission, mistake nor for any loss or damage including without limitation to any loss of profit which may arise from reliance on any information supplied by Everest Fortune Group.

AUD/JPY – H4 - Rising Wedge Breakdown | Key Zones Targeted📝 Description:
The AUD/JPY pair is showing a clear Rising Wedge formation on the 4H timeframe, with three clean touches on the trendline—indicating weakening bullish momentum. Price has now broken below the lower trendline, suggesting increased probability of bearish continuation toward the next key zones. FX:AUDJPY
This setup highlights:
Rising Wedge pattern
Trendline break
Retest opportunity
Key support zones at 99.00 and 97.80
AUD fundamentals: driven by commodity demand, RBA policy, and risk sentiment
JPY fundamentals: influenced by BOJ stance, yields, and safe-haven flows
This analysis is ideal for traders monitoring price action, forex patterns, and high-probability setups on AUD/JPY.
Keep an eye on upcoming economic releases from RBA, BOJ, and US data, as they can influence risk sentiment and impact this pair heavily.
✅ Support this analysis with a
LIKE 👍 | COMMENT 💬 | FOLLOW 🔔
It helps a lot & keeps the ideas coming!
⚠️ Disclaimer: This analysis is for educational purposes only and does not constitute financial advice. Forex trading involves high risk. Trade only with capital you can afford to lose and always do your own research.

A fascinating chart - monthly JP20YWhilst the worlds and his wife has been focused on AI and Bitcoin there have been other moves afoot which should also be of concern. One of these is the move in long dated Japanese Government Bond Yields.
I am in now way any sort of expert in JGB, but I know an interesting chart when I see one. The trend on the JGB20YR Yield has been one way traffic since that double bottom back in 2021. Last week the yield hit 2.85 - the highest this century.
Why is this of any interest?
Whilst the BoJ short term policy rate remains at 0.5% the long term market is repricing risk aggressively higher. There are many reasons for this - which people far smarter than me can explain. I'm a mere trader looking at the chart and wondering how to turn it into an opportunity.
As far as I am aware Japan remains the largest foreign holder of US Treasury Debt. As yields in Japan become more attractive then the incentive to send capital across the Pacific into US Treasuries starts to diminish That causes problems for the US as well. We start to get contagion. We have already seen the JPY sat at the bottom of my own STAM model as the weakest of the major currencies. How does the new PM Takaichi and her government, along with Mr Ueda and the BoJ, even hope to deal with this?

USDJPY H4 | Bullish Momentum To ExtendMomentum: Bullish
The price is pulling back toward the buy entry, which sits slightly above the 50% Fibonacci retracement level and remains above the Ichimoku cloud.
Buy Entry: 155.08
Pullback support
Slightly above the 50% Fibonacci retracement
Stop Loss: 153.73
Pullback support
Slightly below the 61.8% Fibonacci retracement
Take Profit: 157.55
Swing high resistance
High Risk Investment Warning
Stratos Markets Limited (tradu.com ), Stratos Europe Ltd (tradu.com ):
CFDs are complex instruments and come with a high risk of losing money rapidly due to leverage. 70% of retail investor accounts lose money when trading CFDs with this provider. You should consider whether you understand how CFDs work and whether you can afford to take the high risk of losing your money.
Stratos Global LLC (tradu.com ): Losses can exceed deposits.
Please be advised that the information presented on TradingView is provided to Tradu (‘Company’, ‘we’) by a third-party provider (‘TFA Global Pte Ltd’). Please be reminded that you are solely responsible for the trading decisions on your account. Any information and/or content is intended entirely for research, educational and informational purposes only and does not constitute investment or consultation advice or investment strategy. The information is not tailored to the investment needs of any specific person and therefore does not involve a consideration of any of the investment objectives, financial situation or needs of any viewer that may receive it. Past performance is not a reliable indicator of future results. Actual results may differ materially from those anticipated in forward-looking or past performance statements. We assume no liability as to the accuracy or completeness of any of the information and/or content provided herein and the Company cannot be held responsible for any omission, mistake nor for any loss or damage including without limitation to any loss of profit which may arise from reliance on any information supplied by TFA Global Pte Ltd.

Forex: Weekly Review Overall market sentiment was, at best, 'choppy' during the week starting Monday 17 November.
A continuation of recent themes (AI overvaluation concerns / hawkish FED repricing) ensured an underlying tentativiity throughout the week and any positivity was short lived (NVIDEA earnings / GOOGLE positivity). Even the return of NFP, with a headline beat, ultimately proved negative as a December FED rate cut diminished to 30%.
All in all, it's a difficult environment, correlations have broken down, particularly the JPY, which struggled throughout the week thanks to the government stimulus. And It currently appears the BOJ don't have rate hike plans until spring 2026. Which brings intervention chatter to the fore. It's likely the BOJ will synchronise intervention with 'soft' US data. And once the BOJ do intervene, it will ultimately be a 'short JPY opportunity'. In the meantime 'verbal intervention threats' (jawboning) will be a 'risk' to any short JPY trades.
The AUD continues to under perform its fundamentals, weighed down by the tepid environment. And the run of soft UK data continues, the GBP remains remarkably resilient. All eyes are on the upcoming UK budget.
On Friday, we did get a FED twist, against the grain, New York FED president WILLIAMS mooted a near term rate cut. There is a theory this was a coordinated speech, lining up a December cut, appeasing the market and swinging the FED RATE MONITOR back towards a December cut. Whether it will prove to be a short lived 'relief bounce', only time will tell. The sooner we get a run of 'real time' US data, the better.
I begin the new week without a clear bias, I'll be reading headlines and watching the VIX in an attempt to guage how serious the market is one way or the other.
On a personal note, it was a week I found difficult to form a solid conviction, only one trade. And it was a particularly speculative AUD CHF short, when I felt the chart was going to roll over. The trade stopped out quite quickly during one of those brief periods of positivity. I'm currently envisioning a continuation of only one or two trades per week and I'm content to slightly up my risk percentage in an attempt to make up the numbers.
Let's see what the new week brings.

Bearish reversal in play?USD/JPY has rejected off the pivot which acts as a swing high resistance and could drop to the 1st support that aligns with the 23.6% Fibonacci retracement.
Pivot: 157.98
1st Support: 154.42
1st Resistance: 161.83
Disclaimer:
The opinions given above constitute general market commentary and do not constitute the opinion or advice of IC Markets or any form of personal or investment advice.
Any opinions, news, research, analyses, prices, other information, or links to third-party sites contained on this website are provided on an "as-is" basis, are intended to be informative only, and are not advice, a recommendation, research, a record of our trading prices, an offer of, or solicitation for, a transaction in any financial instrument and thus should not be treated as such. The information provided does not involve any specific investment objectives, financial situation, or needs of any specific person who may receive it. Please be aware that past performance is not a reliable indicator of future performance and/or results. Past performance or forward-looking scenarios based upon the reasonable beliefs of the third-party provider are not a guarantee of future performance. Actual results may differ materially from those anticipated in forward-looking or past performance statements. IC Markets makes no representation or warranty and assumes no liability as to the accuracy or completeness of the information provided, nor any loss arising from any investment based on a recommendation, forecast, or any information supplied by any third party.

USDJPYAccording to the current quarter, price has been below the average. There was a sign of weakness on the week on 11/09/25 and since then, price has some bullish momentum going on with a more recent pullback. I want to see if price can test the current target which is near a previous resistance. If not, remember that trading is simply a game of probabilities.

USDJPY Potential DownsidesHey Traders, in today's trading session we are monitoring USDJPY for a selling opportunity around 156.700 zone, USDJPY is trading in a downtrend and currently is in a correction phase in which it is approaching the trend at 156.700 support and resistance area.
Trade safe, Joe.

CAD/JPY – Wedge Breakout Pattern (21.11.2025)📝 Setup Overview OANDA:CADJPY
CAD/JPY has broken below a rising wedge structure, signaling weakening bullish momentum. After multiple rejections at the resistance zone, price is now losing steam below the Ichimoku cloud, showing early bearish pressure.A clean breakout + retest scenario opens the door for downside continuation toward the next demand zones.
📌 Trading Plan📍 Entry Idea:
Look for bearish continuation below the wedge support + cloud rejection.
🎯 Targets (Support Levels):
1st Support: 111.022
2nd Support: 110.561
🛑 Resistance Zone:
112.014 – 112.294
This zone continues to act as a strong supply area where sellers took control repeatedly.
📉 Today’s Fundamentals – Bearish CAD Bias
1️⃣ Crude Oil Pullback → Weakens CAD
Canada’s economy is heavily tied to oil prices. Today’s dip in crude oil puts pressure on the CAD, giving JPY an advantage.
2️⃣ Safe-Haven Demand Supports JPY
With global markets showing risk-off sentiment (concerns over slowing global growth + uncertain central bank guidance), investors favor safe-haven currencies like the Japanese Yen.
3️⃣ BoC Policy Tone Still Cautious
Recent Bank of Canada communications show limited confidence in economic momentum.
Markets expect slower growth → bearish CAD outlook.
➡️ Combination of oil weakness + JPY strength + wedge breakdown = bearish continuation setup.
🔖 Hashtags
#CADJPY #ForexAnalysis #PriceAction #WedgeBreakout #Ichimoku #FXTrading #TechnicalAnalysis #FundamentalAnalysis #SmartMoney #TradingViewCommunity #Kabhi_TA_Trading
⚠️ Disclaimer
This analysis is for educational purposes only.
Not financial advice. Always manage your risk and trade based on your plan.
💬 Support the Work
If you found this analysis helpful, please LIKE & COMMENT on the post ❤️
Your support motivates more high-quality setups daily!

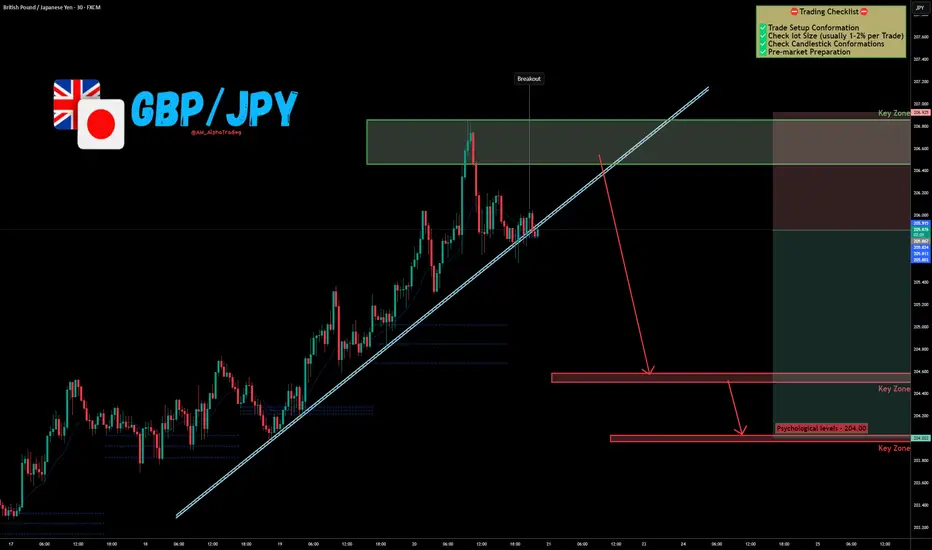
GBP/JPY Rejection at Supply → Next Stop: 204.00 !The GBP/JPY Pair, Price has been trading within a Trendline Breakout on the M30 chart, forming consistent lower highs and lower lows. Price action is now testing the lower boundary of the pattern, signalling a possible breakdown.
✅Market Context:
1️⃣Downward structure building inside the pattern.
2️⃣Sellers are showing strength near support levels.
3️⃣Breakdown below the trendline indicates momentum continuation toward lower zones.
✅Trade Plan :
Entry: Sell after confirmed breakdown below the support (Candle close below trendline or retest of the breakout).
💰Take Profit (TP): At the Key Zone – major support area identified ahead.
🛑Stop Loss (SL): Above the pattern structure / recent swing high.
✅Psychological Discipline:
1️⃣Stick to plan – No Revenge Trades.
2️⃣Accept losing trades as part of the strategy.
3️⃣Risk only 1–2% of your account balance per trade.
✅ Support this analysis with a
LIKE 👍 | COMMENT 💬 | FOLLOW 🔔
It helps a lot & keeps the ideas coming!
⚠️ Disclaimer: This analysis is for educational purposes only and does not constitute financial advice. Forex trading involves high risk. Trade only with capital you can afford to lose and always do your own research.
GBPJPY rejected at the top of its 6-month Channel Up.The GBPJPY pair has been trading within a 6-month Channel Up and yesterday got rejected exactly on its top, making a Higher High. That completed a +3.92% rise, similar to all previous Bullish Legs of this pattern.
As a result, we technically view yesterday's rejection as the start of the new Bearish Leg. All previous corrections hit at least the 1D MA50 (blue trend-line) and we expect that to happen at 202.400 at least.
As for the most optimal buy, that will be on the 1D MA100 (green trend-line), which marked all previous four bottoms (Higher Lows) and initiated the Bullish Legs. The 1D RSI testing its Support Zone, is an additional buy indicator. We expect the next Bullish Leg to reach at least 208.250 (+3.92%).
---
** Please LIKE 👍, FOLLOW ✅, SHARE 🙌 and COMMENT ✍ if you enjoy this idea! Also share your ideas and charts in the comments section below! This is best way to keep it relevant, support us, keep the content here free and allow the idea to reach as many people as possible. **
---
💸💸💸💸💸💸
👇 👇 👇 👇 👇 👇
